ELK-日志收集系统在Centos上环境安装
文章目录
-
- 前言
- 安装
- elastcsearch6.5.4安装
- 准备
- 学习资料
- 启动
- 创建新用户
- 取掉只能本机访问的配置
- 配置跨域访问
- 启动命令
- 测试
- 安装分词ik
-
- LogStash6.5.4安装
-
- Kibana6.5.4安装
-
- windows安装
- nxlog在windows安装
前言
版本: ELK6.5.4
两台机器
| 名称 | ip | 作用 |
|---|
| windows系统 | 192.168.2.32 | 本机,测试 |
| centos7 | 192.168.2.33 | 安装elastcsearch6.5.4 |
elk-stack-guide-cn.pdf电子书,提取码glws
这里先介绍一个杀死占用指定端口的进程方法:
netstat -nlp | grep :9200|awk '{print $7}' | awk -F"/" '{ print $1 }'|xargs kill -9
上面代码杀死占用9200端口的进程
安装
elastcsearch6.5.4安装
准备
Elastic中文官网,基本上下载速度很慢,毕竟跨越国家了。
从我的网盘下载elastcsearch6.5.4,提取码:naqy
- 创建目录elk:mkdir /url/local/elk
- 将elasticsearch-6.5.4.tar.gz传到elk目录下
- 解压:tar -zxvf elasticsearch-6.5.4.tar.gz
学习资料
-
ElasticSearch权威指南或者ElasticSearch权威指南
-
Elasticsearch 基础入门
启动
创建新用户
因为安全问题elasticsearch不让用root用户直接运行,所以要创建新用户
参考Linux用户和权限管理,使用useradd命令创建一个chenyuan用户。
修改elasticsearch-6.5.4拥有都为chenyuan用户,命令:chown -R chenyuan /url/local/elk/elasticsearch-6.5.4
取掉只能本机访问的配置
命令:vim config/elasticsearch.yml
# 去掉 network.host 前边的注释,将它的值改成0.0.0.0
network.host: 0.0.0.0
配置跨域访问
命令:vim config/elasticsearch.yml
添加
http.cors.allow-origin: "*"
http.cors.enabled: true
这两个配置是支持跨域访问用的,这样的话后续安装的head插件和kibana才能够正常的访问es的查询接口。
启动命令
进入/url/local/elk/elasticsearch-6.5.4
切换用户执行elasticsearch命令:sudo -u chenyuan bin/./elasticsearch
如果想以后台方式启动,则在末尾加上-d,比如sudo -u chenyuan bin/./elasticsearch -d
关于启动方式:
- sudo -u chenyuan bin/./elasticsearch:执行启动,日志输出到控制台stdout
- sudo -u chenyuan bin/./elasticsearch -d:以daemon守护进程启动(后台运行),日志输出到/url/local/elk/elasticsearch-6.5.4/logs/elasticsearch.log
- nohup sudo -u chenyuan bin/./elasticsearch > /var/logs/test.log 2>&1 & 将标准输出和标准错误输出都重定向到/var/logs/test.log文件里
可能遇到的问题
- 问题:max file descriptors [65535]xxxxx
例如:max file descriptors [65535] for elasticsearch process is too low, increase to at least [65536]
修改/etc/security/limits.conf,添加如下:
* - nproc 65536
* - nofile 65536
- 问题:max number of threads [3802]xxxx
例如:max number of threads [3802] for user [chenyuan] is too low, increase to at least [4096]
修改/etc/security/limits.d/90-nproc.conf,添加如下:
* soft nproc unlimited
root soft nproc unlimited
- 问题:max virtual memory areas
例如:vm.max_map_count [65530] likely too low, increase to at least [262144]
以root用户执行命令:sudo sysctl -w vm.max_map_count=262144
上述方法修改之后,如果重启虚拟机将失效,所以:
解决办法:
在 /etc/sysctl.conf文件最后添加一行
vm.max_map_count=262144
执行 命令:sysctl -p
如果vm.max_map_count = 262144表示配置正确
即可永久修改。
启动很慢,命令启动日志:
[2019-02-23T09:03:24,612][INFO ][o.e.p.PluginsService     ] [YURwwIO] loaded module [x-pack-watcher]
[2019-02-23T09:03:24,612][INFO ][o.e.p.PluginsService     ] [YURwwIO] no plugins loaded
[2019-02-23T09:04:36,610][INFO ][o.e.x.s.a.s.FileRolesStore] [YURwwIO] parsed [0] roles from file [/usr/local/elk/elasticsearch-6.5.4/config/roles.yml]
[2019-02-23T09:04:48,889][INFO ][o.e.x.m.j.p.l.CppLogMessageHandler] [YURwwIO] [controller/2392] [Main.cc@109] controller (64 bit): Version 6.5.4 (Build b616085ef32393) Copyright (c) 2018 Elasticsearch BV
[2019-02-23T09:04:51,157][DEBUG][o.e.a.ActionModule       ] [YURwwIO] Using REST wrapper from plugin org.elasticsearch.xpack.security.Security
[2019-02-23T09:04:53,758][INFO ][o.e.d.DiscoveryModule    ] [YURwwIO] using discovery type [zen] and host providers [settings]
[2019-02-23T09:05:02,526][INFO ][o.e.n.Node               ] [YURwwIO] initialized
[2019-02-23T09:05:02,540][INFO ][o.e.n.Node               ] [YURwwIO] starting ...
[2019-02-23T09:05:04,737][INFO ][o.e.t.TransportService   ] [YURwwIO] publish_address {192.168.2.33:9300}, bound_addresses {[::]:9300}
[2019-02-23T09:05:05,104][INFO ][o.e.b.BootstrapChecks    ] [YURwwIO] bound or publishing to a non-loopback address, enforcing bootstrap checks
[2019-02-23T09:05:08,110][INFO ][o.e.m.j.JvmGcMonitorService] [YURwwIO] [gc][young][4][26] duration [768ms], collections [1]/[2.1s], total [768ms]/[54.4s], memory [113.1mb]->[98.6mb]/[1015.6mb], all_pools {[young] [51.9mb]->[33.2mb]/[66.5mb]}{[survivor] [6.9mb]->[8.3mb]/[8.3mb]}{[old] [54.2mb]->[57.1mb]/[940.8mb]}
[2019-02-23T09:05:08,186][INFO ][o.e.m.j.JvmGcMonitorService] [YURwwIO] [gc][4] overhead, spent [1s] collecting in the last [2.1s]
[2019-02-23T09:05:09,380][INFO ][o.e.c.s.MasterService    ] [YURwwIO] zen-disco-elected-as-master ([0] nodes joined), reason: new_master {YURwwIO}{YURwwIOOQBqs6RrOyyqfSQ}{yY4qVOEsS6q56blUe8gWKg}{192.168.2.33}{192.168.2.33:9300}{ml.machine_memory=1021906944, xpack.installed=true, ml.max_open_jobs=20, ml.enabled=true}
[2019-02-23T09:05:09,435][INFO ][o.e.c.s.ClusterApplierService] [YURwwIO] new_master {YURwwIO}{YURwwIOOQBqs6RrOyyqfSQ}{yY4qVOEsS6q56blUe8gWKg}{192.168.2.33}{192.168.2.33:9300}{ml.machine_memory=1021906944, xpack.installed=true, ml.max_open_jobs=20, ml.enabled=true}, reason: apply cluster state (from master [master {YURwwIO}{YURwwIOOQBqs6RrOyyqfSQ}{yY4qVOEsS6q56blUe8gWKg}{192.168.2.33}{192.168.2.33:9300}{ml.machine_memory=1021906944, xpack.installed=true, ml.max_open_jobs=20, ml.enabled=true} committed version [1] source [zen-disco-elected-as-master ([0] nodes joined)]])
[2019-02-23T09:05:09,907][INFO ][o.e.x.s.t.n.SecurityNetty4HttpServerTransport] [YURwwIO] publish_address {192.168.2.33:9200}, bound_addresses {[::]:9200}
[2019-02-23T09:05:09,920][INFO ][o.e.n.Node               ] [YURwwIO] started
[2019-02-23T09:05:44,075][WARN ][o.e.m.j.JvmGcMonitorService] [YURwwIO] [gc][young][17][27] duration [22.2s], collections [1]/[23s], total [22.2s]/[1.2m], memory [132mb]->[97.8mb]/[1015.6mb], all_pools {[young] [66.5mb]->[533.7kb]/[66.5mb]}{[survivor] [8.3mb]->[5.6mb]/[8.3mb]}{[old] [57.1mb]->[91.7mb]/[940.8mb]}
[2019-02-23T09:05:44,321][WARN ][o.e.m.j.JvmGcMonitorService] [YURwwIO] [gc][17] overhead, spent [22.2s] collecting in the last [23s]
[2019-02-23T09:05:56,374][WARN ][o.e.m.j.JvmGcMonitorService] [YURwwIO] [gc][19] overhead, spent [10.8s] collecting in the last [11s]
[2019-02-23T09:05:59,843][WARN ][o.e.x.s.a.s.m.NativeRoleMappingStore] [YURwwIO] Failed to clear cache for realms [[]]
[2019-02-23T09:06:01,512][INFO ][o.e.l.LicenseService     ] [YURwwIO] license [e64dcf35-113e-4c71-b3cf-a7993b3f027d] mode [basic] - valid
[2019-02-23T09:06:02,134][WARN ][o.e.c.s.ClusterApplierService] [YURwwIO] cluster state applier task [apply cluster state (from master [master {YURwwIO}{YURwwIOOQBqs6RrOyyqfSQ}{yY4qVOEsS6q56blUe8gWKg}{192.168.2.33}{192.168.2.33:9300}{ml.machine_memory=1021906944, xpack.installed=true, ml.max_open_jobs=20, ml.enabled=true} committed version [2] source [local-gateway-elected-state]])] took [47.9s] above the warn threshold of 30s
[2019-02-23T09:06:02,183][INFO ][o.e.g.GatewayService     ] [YURwwIO] recovered [2] indices into cluster_state
[2019-02-23T09:06:02,186][WARN ][o.e.c.s.MasterService    ] [YURwwIO] cluster state update task [local-gateway-elected-state] took [48.7s] above the warn threshold of 30s
[2019-02-23T09:06:08,171][INFO ][o.e.c.r.a.AllocationService] [YURwwIO] Cluster health status changed from [RED] to [YELLOW] (reason: [shards started [[666][2]] ...]).
测试
重新打开一个终端,执行命令:curl localhost:9200,说明本机可以访问
换台电脑,在chrome浏览器打开: http://192.168.2.33:9200,有结果则表示外网可访问
安装分词ik
ik分词各版本下载地址,下载成功后,我的是 elasticsearch-analysis-ik-6.5.4.zip,注意版本要与elasticsearch对应上,将包上传到/url/local/elk/elasticsearch-6.5.4/plugins/ik(ik目录在自己创建),然后解决unzip elasticsearch-analysis-ik-6.5.4.zip
重启elasticsearch,如果输出日志里有[2019-02-23T15:05:04,127][INFO ][o.e.p.PluginsService ] [YURwwIO] loaded plugin [analysis-ik]表示安装ik成功
安装elasticsearch-head
这个只是测试,可以不安装
该插件能直接对 Elasticsearch 的数据进行增删改查,因此存在安全性的问题,建议生产环境下不要使用该插件!
要求本机安装了nodejs,阿里云centos环境之Gradle/Nodejs安装(十六)
elasticsearch-head的源码位置。
进入 /url/local/elk目录。
执行git命令,两者源码一样:git clone git://github.com/mobz/elasticsearch-head.git或wget https://github.com/mobz/elasticsearch-head/archive/master.zip。
cd elasticsearch-head
npm install --registry https://registry.npm.taobao.org  --unsafe-perm=true --allow-root
#前台启动方式
npm run start
#或者后台启动方式
nohup npm run start &
打开http://192.68.2.33:9100/,能成功打开页面
注意要把9100端口对外开放。
问题:system call filters failed to install; check the logs and fix your configuration or disable system call filters at your own risk
原因:Centos6不支持SecComp,而ES5.4.1默认bootstrap.system_call_filter为true进行检测,所以导致检测失败,失败后直接导致ES不能启动。
解决方法:在elasticsearch.yml中新增配置bootstrap.system_call_filter,设为false,注意要在Memory下面:
bootstrap.memory_lock: false
效果如下

LogStash6.5.4安装
学习资料
Logstash 最佳实践
准备
从我的网盘下载elastcsearch6.5.4,提取码:naqy
- 创建目录elk:mkdir /url/local/elk
- 将logstash-6.5.0.tar.gz传到elk目录下
- 解压:tar -zxvf logstash-6.5.0.tar.gz
配置
编辑 /usr/local/logstash/config/logstash.yml配置文件修改如下内容:
node.name: cpy04.dev.xjh.com    #设置节点名称,一般写主机名
path.data: /usr/local/logstash/plugin-data    #创建logstash 和插件使用的持久化目录
config.reload.automatic: true    #开启配置文件自动加载
config.reload.interval: 10    #定义配置文件重载时间周期
http.host: "cpy04.dev.xjh.com"    #定义访问主机名,一般为域名或IP
启动
进入mkdir /url/local/elk/logstash-6.5.0/bin目录下,执行logstash脚本,当然logstash需要其它参数的配置,这在下面讲。如果想后台运行,你需要同时在命令前面加 nohup,后面加 &。
命令行参数
Logstash 命令行参数,比较重要的是-e和-f。
-e是后面跟配置,比如:./logstash -e ‘input { stdin { } } output { stdout {} }’
-e是后面跟配置文件,比如将input { stdin { } } output { stdout {} }放在test.conf配置文件里,命令行就变成./logstash -f test.conf
注意
input输入是文件的话,输入插件默认使用 “\n” 判断日志中每行的边界位置
启动命令:nohup bin/./logstash -f myconf/nxlog_logstash.conf --config.reload.automatic &
停止命令:netstat -nlp | grep :9600|awk ‘{print $7}’ | awk -F"/" ‘{ print $1 }’|xargs kill -9
Kibana6.5.4安装
学习资料
kibana中文教程
安装
从我的网盘下载elastcsearch6.5.4,提取码:naqy
- 将kibana-6.5.4-linux-x86_64.tar.gz传到elk目录下
- 解压:tar -zxvf kibana-6.5.4-linux-x86_64.tar.gz
- 创建一个logs目录
编辑conf/kibana.yml配置文件
server.port: 5601
server.host: "0.0.0.0"
elasticsearch.url: "http://localhost:9200"
kibana.index: ".newkibana"
logging.dest: /usr/local/elk/kibana-6.5.4-linux-x86_64/logs/kibana.log #配置kibana的日志文件路径,不然默认是messages里记录日志
xpack.security.enabled: false   #添加这条,这条是配置kibana的安全机制,暂时关闭。
默认是kibana.index: ".kibana"会报Kibana server is not ready yet错误,这里配置为.newkibana
启动
前台启动:bin/./kibana
后台启动:nohup /bin/./kibana &
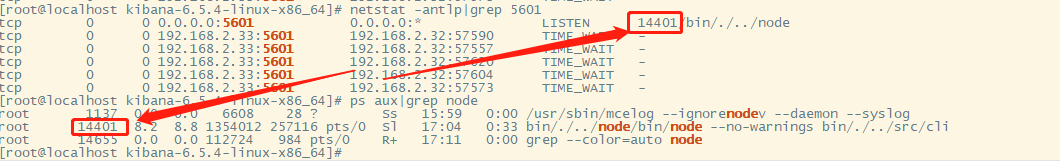
启动成功后,占用5601端口。
访问http://192.168.2.33:5601试试,注意5601端口要对外开放.由于我们并没有安装x-pack,所以此时是没有用户名和密码的,可以直接访问的:
由于kibana是使用node.js开发的,所以进程名称为node,可以使用ps aux|grep node与netstat -antlp|grep 5601<//kbd>做对比验证进程是否是node,效果
windows安装
windows安装可参考ELK学习记录三 :elasticsearch、logstash及kibana的安装与配置(windows),其中除了logStash需要安装到windows上外,其它没必需,因为logStash负责收集日志的,与客户端亲密性更高。
因为 windows 平台上没有 inode 的概念,Logstash 某些版本在 windows 平台上监听文件不是很靠谱。windows 平台上,推荐考虑使用 nxlog 作为收集端
nxlog在windows安装
官网下载地址,下载nxlog-ce-2.10.2150.msi,点击安装。
64位默认安装路径:C:\Program Files (x86)\nxlog,
32位默认安装路径:C:\Program Files\nxlog,32
日志文件默认路径:C:\Program Files (x86)\nxlog\data\nxlog.log。
修改conf下nxlog.conf配置文件
<Input testfile>
	Module im_file
	File "D:\\jar\\dongli\\logs\\spring-boot.log"
	SavePos TRUE
</Input>
<Output out>
	Module om_tcp
	Host 192.168.1.238
	Port 514
</Output>
<Route 1>
	Path testfile => out
</Route>
上面配置是读取D:\jar\dongli\logs\spring-boot.log,通过tcp协议发送到192.168.1.238:514地址上,而192.168.1.238:514我是用logstash监听514端口的。
所以,上面配置意思是读取配置文件发送给logstash。
本文内容由网友自发贡献,版权归原作者所有,本站不承担相应法律责任。如您发现有涉嫌抄袭侵权的内容,请联系:hwhale#tublm.com(使用前将#替换为@)