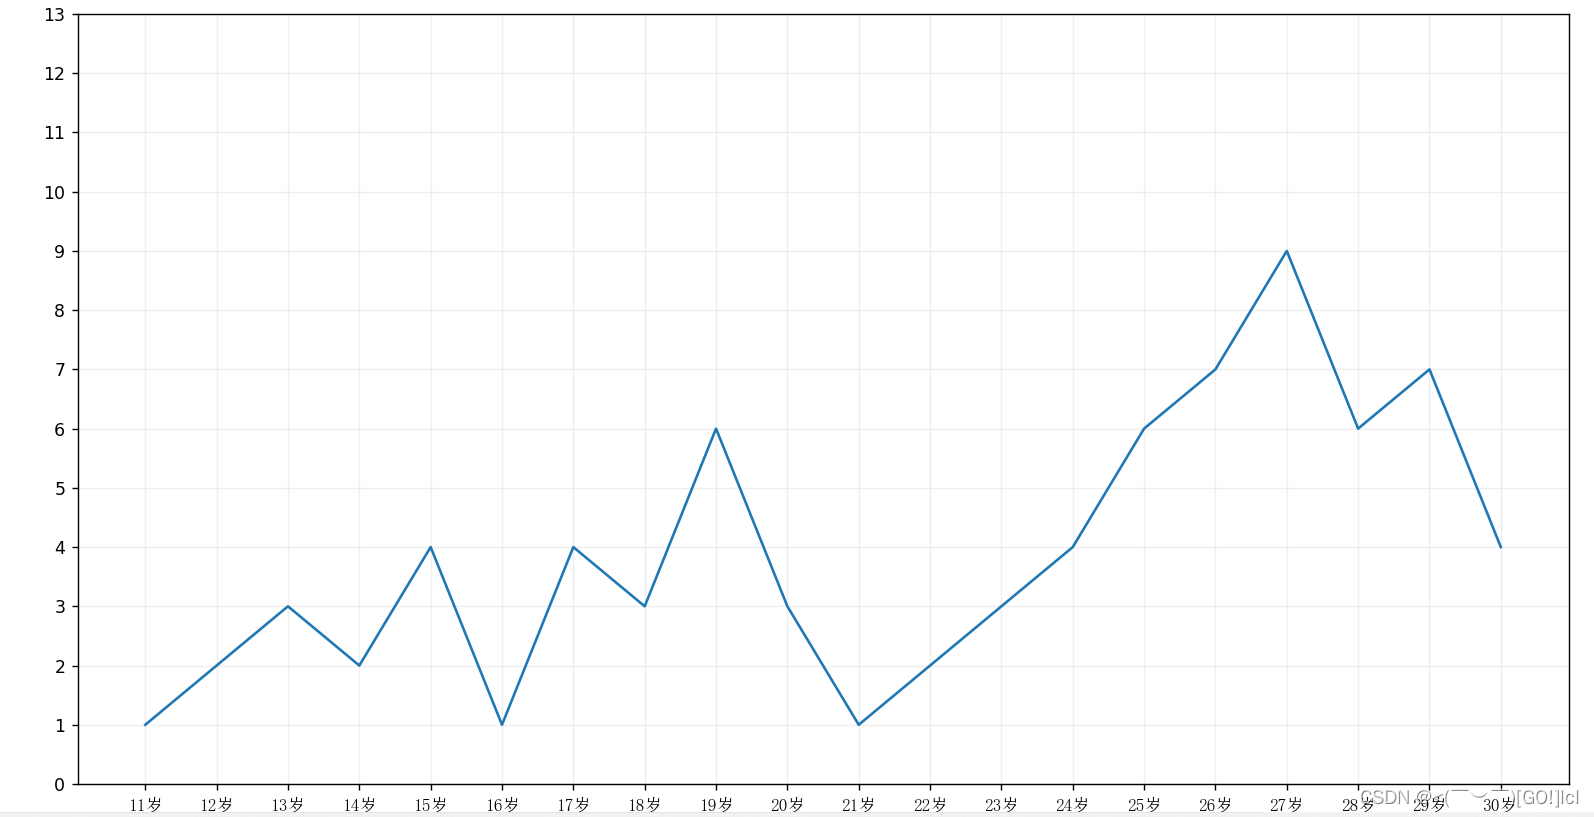
plt.grid
import matplotlib.pyplot as plt
import random
import matplotlib
from matplotlib import cycler
from matplotlib.font_manager import FontProperties

# 支持的中文字体
font1 = FontProperties(fname=r"c:\windows\fonts\simsun.ttc")

y = [1, 2, 3, 2, 4, 1, 4, 3, 6, 3, 1, 2, 3, 4, 6, 7, 9, 6, 7, 4]
x = range(11, 31)

plt.figure(figsize=(20, 8))

plt.plot(x, y)

# 调整x轴上的字符串刻度
_x_ticks = ["{}岁".format(i) for i in x ]
plt.xticks(x, _x_ticks, fontproperties=font1)
# 绘制网格
plt.grid()
plt.show()
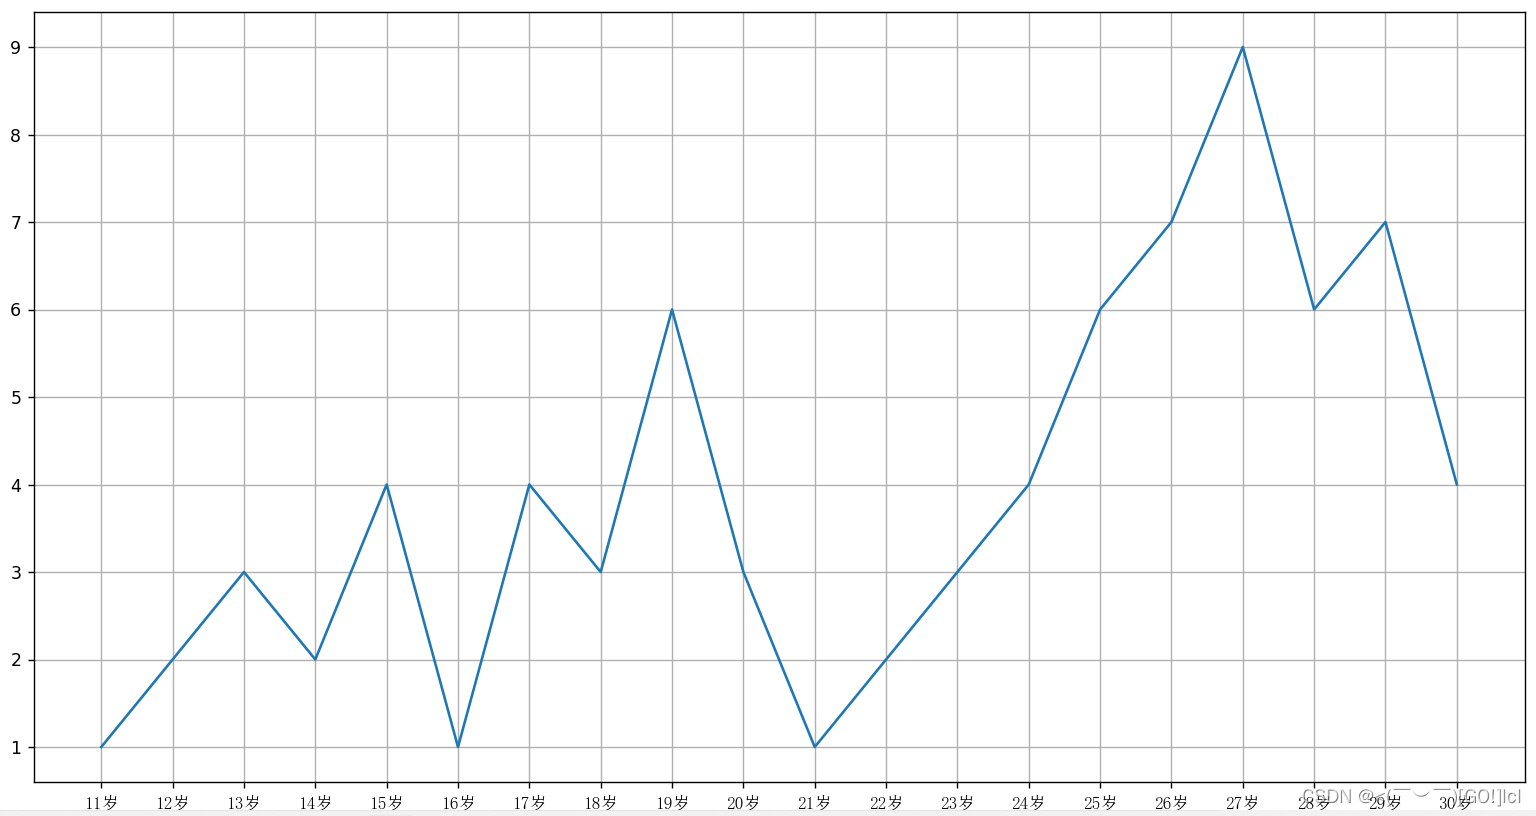
调整y轴更密集一点
import matplotlib.pyplot as plt
import random
import matplotlib
from matplotlib import cycler
from matplotlib.font_manager import FontProperties

# 支持的中文字体
font1 = FontProperties(fname=r"c:\windows\fonts\simsun.ttc")

y = [1, 2, 3, 2, 4, 1, 4, 3, 6, 3, 1, 2, 3, 4, 6, 7, 9, 6, 7, 4]
x = range(11, 31)

plt.figure(figsize=(20, 8))

plt.plot(x, y)

# 调整x轴上的字符串刻度
_x_ticks = ["{}岁".format(i) for i in x ]
plt.xticks(x, _x_ticks, fontproperties=font1)

plt.yticks(range(0,9))

# 绘制网格
plt.grid()

plt.show()
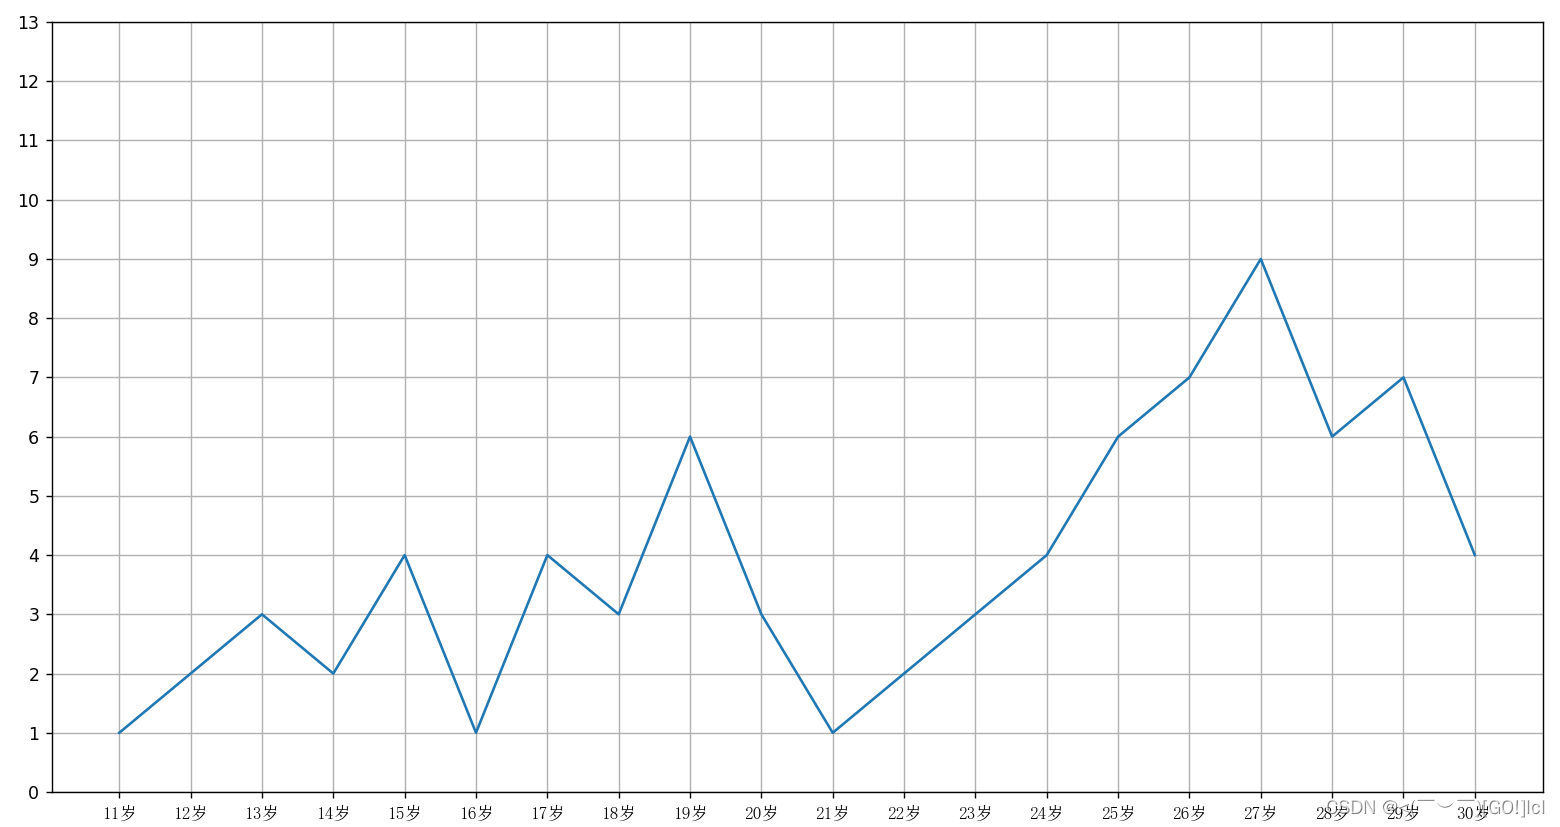
设置网格透明度 plt.grid(alpha=0.2)
import matplotlib.pyplot as plt
import random
import matplotlib
from matplotlib import cycler
from matplotlib.font_manager import FontProperties

# 支持的中文字体
font1 = FontProperties(fname=r"c:\windows\fonts\simsun.ttc")

y = [1, 2, 3, 2, 4, 1, 4, 3, 6, 3, 1, 2, 3, 4, 6, 7, 9, 6, 7, 4]
x = range(11, 31)

plt.figure(figsize=(20, 8))

plt.plot(x, y)

# 调整x轴上的字符串刻度
_x_ticks = ["{}岁".format(i) for i in x]
plt.xticks(x, _x_ticks, fontproperties=font1)

plt.yticks(range(0, 14))

# 绘制网格
plt.grid(alpha=0.2)

plt.show()