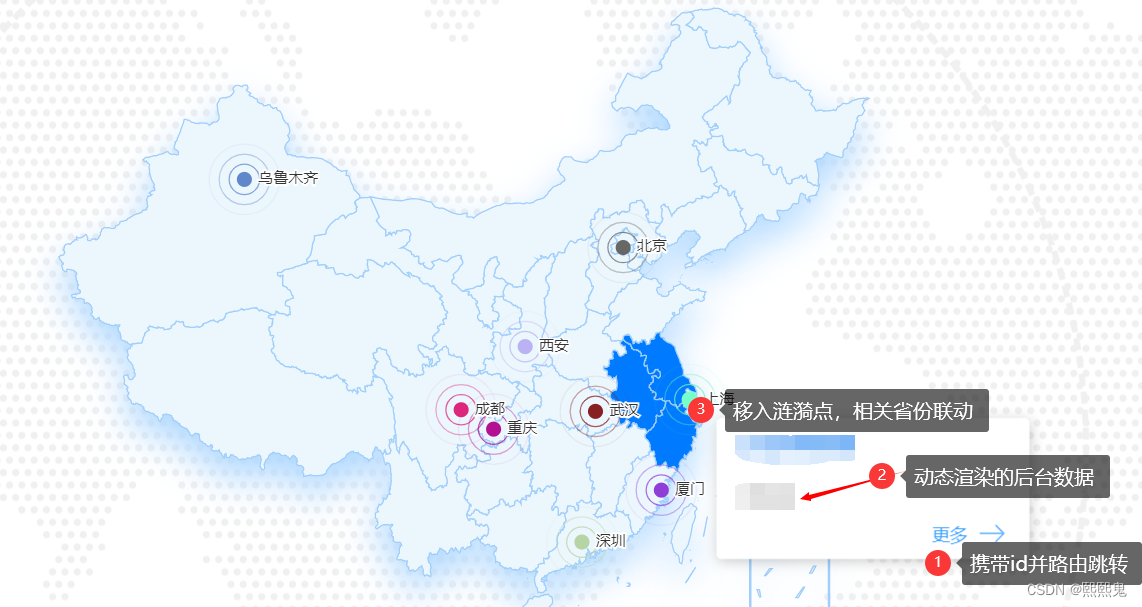
最终做出来的效果是这样的:
最近做项目时,遇到这样的需求:
1、toolTip上的数据根据后台动态渲染
2、鼠标移入地图涟漪点时显示tootTip,点击toolTip上的文字,携带动态数据id进行路由跳转
3、鼠标移入地图涟漪点,与涟漪点相关的省份多区域联动高亮
这么多问题,不要慌,办法都是人想出来的,我们先从第一个问题来开整:
一、众所周知,echart的toolTip有自己的显示样式,但是在实际开发中需要自定义html结构才能满足需求,如我遇到的动态渲染,于是我这样做:
let initOption = {
tooltip: {
          show: false, // 提示框
          triggerOn: "mousemove|click", //必须使用这种方式,因为tooltip需要有点击事件,同时移入effectScatter点区域联动
          extraCssText: "border:none;",//清除tooltip自带的边框颜色
          // alwaysShowContent: true,//提示框不消失
          hideDelay: 2000, //提示框移出或点击2秒后消失
     },
       //使用这种方式添加tooltip的formatter,便于点击事件的获取
      initOption.tooltip.formatter = function (params) {
        if (params.seriesType === `effectScatter`) {
          this.proviesName = [];
          const theData = params.data?.theData;
          //省份集合value
          let provies = [];
          theData.map((item) => {
            provies.push(...item.businessArea.split(","));
          });
          //遍历匹配得到省份合集
          provies?.map((item) => {
            mapCenterData.map((ite) => {
              if (item == ite.value) this.proviesName.push(ite.name);
            });
          });
          //数组去重
          this.proviesName = Array.from(new Set(this.proviesName));

          let before = "";
          let center = "";
          // 格式化提示框信息
          theData.map((item) => {
            item.recruitmentInfoList.map((ite) => {
              center += `
                      <div style="width: 15vw;display: flex;justify-content: space-between;padding: 0 10px; font-size: 14px; margin: 10px 0;">
                          ${ite.title}
                      </div>
                `;
            });
            before +=
              `
                  <div style="position: relative;z-index: 100000000000000000000000;">
                    <div style="font-weight: bold;display: flex;padding: 0 5px;justify-content: space-between;margin-bottom: 20px;">
                      <div style="font-weight: bold;color: #348df2;font-size: 16px;z-index:100;">${item.shortName}</div>
                      </div>` +
              center +
              `
                      <div style="width: 15vw;display: flex;justify-content: flex-end;padding: 0 10px; font-size: 14px;" >
                          <div style="align-items: flex-end;display: flex;align-items: center;color:#3da2ff;pointer-events: auto;" class="toJoin-${
                            item.id
                          }">
                            <p οnclick="${this.getMoreJob(item.id)}">更多</p>
                            <svg style="width:20px;height:20px;margin-left: 10px;" t="1672020296882" class="icon" viewBox="0 0 1024 1024" version="1.1" xmlns="http://www.w3.org/2000/svg" p-id="2518" width="200" height="200"><path d="M1024.2048 512c0 6.656-2.4576 13.2608-7.5264 18.2784l-325.8368 325.8368a25.6 25.6 0 1 1-36.1984-36.1984l282.5216-282.5216H25.8048a25.6 25.6 0 1 1 0-51.2h910.9504l-282.112-282.112a25.6 25.6 0 1 1 36.1984-36.1984l325.8368 325.8368c4.608 4.608 7.5264 11.008 7.5264 18.0736V512z" fill="#3ca1fe" p-id="2519"></path></svg>
                          </div>
                        </div>
                      </div>
                        `;
          });

          return before;
        }
      }.bind(this);
}
tooTip对象是放在初始化的echart对象中,相信聪明的你肯定知道。这样写就能实现toolTip中html自定义。
二、点击文字,携带参数的路由跳转,由于tooltip中不能使用vue语法,只能使用原生点击事件(onclick),大家可以参考上面代码
<p οnclick="${this.getMoreJob(item.id)}">更多</p> //这里可以获取到定义在vue中的方法
三、移入地图涟漪点省份区域联动,实现思路就是在initOption对象中添加:
let initOption = {
    // 设置高亮颜色
        dataRange: {
          show: false,
          x: "left",
          y: "bottom",
          splitList: [
            { start: 5, end: 5, color: "#007aff" }, //当值为5时,区域背景(值随便设置)
          ],
        },
}
然后在ehcart的移入事件中这么写:
       //移入显示区域联动
      this.chart.on("mouseover", (params) => {
        if (params.seriesType == "effectScatter") {
          this.seriesData = [];
          this.proviesName.map((item) => {
            this.seriesData.push({
              name: item + "省",//这里名字得与联动的省份的名字对应,不然没效果
              value: 5, //随便写的值,主要是与dataRange中设置的值相对应,这样就能实现区域联动高亮
            });
            this.chart.setOption({ series: [{}, { data: this.seriesData }] });
          });
        }
      });
鼠标移出还得操作一手,为了除高亮:
//鼠标移出,清除联动高亮
      this.chart.on("mouseout", (params) => {
        if (params.seriesType == "effectScatter") {
          this.seriesData = [];
          this.chart.setOption({ series: [{}, { data: this.seriesData }] });
        }
      });
最后,废话不多说,上完整代码:
 //初始化图表
    initChart() {
      this.chart = echarts.init(this.$refs.map);
      let initOption = {
        grid: {
          bottom: "0%",
          top: "10%",
          left: "10%",
          right: "10%",
        },
        // 设置高亮颜色
        dataRange: {
          show: false,
          x: "left",
          y: "bottom",
          splitList: [
            { start: 5, end: 5, color: "#007aff" }, //当值为5时,区域背景
          ],
        },
        tooltip: {
          show: false, // 提示框
          triggerOn: "mousemove|click", //必须使用这种方式,因为tooltip需要有点击事件,同时移入effectScatter点区域联动
          extraCssText: "border:none;",//清除tooltip自带颜色
          // alwaysShowContent: true,//提示框不消失
          hideDelay: 2000, //提示框2秒后小时
        },
        geo: {
          show: true,
          map: "china",
          zoom: 1.1, // 地图比例
          label: {
            normal: {
              show: false,
            },
            emphasis: {
              show: false,
            },
          },

          roam: false,
          itemStyle: {
            normal: {
              areaColor: "#01215c",
              borderWidth: 5, //设置外层边框
              borderColor: "transparent",
              shadowColor: "#add7ff",
              shadowBlur: 30,
              shadowOffsetX: 0,
              shadowOffsetY: 15,
            },
          },
        },
        series: [
          {
            type: "effectScatter",
            coordinateSystem: "geo",
            showEffectOn: "render",
            rippleEffect: {
              brushType: "stroke",
              scale: 5,
              period: 2, // 秒数
            },
            symbolSize: 12,
            hoverAnimation: true,
            label: {
              normal: {
                formatter: "{b}",
                position: "right",
                show: true,
              },
            },
            zlevel: 1,
            tooltip: {
              show: true, // 提示框
              triggerOn: "click",
            },
          },

          {
            type: "map",
            map: "china",
            aspectScale: 0.75,
            zoom: 1.1, // 地图比例
            itemStyle: {
              normal: {
                areaColor: "#ebf6fd",
                borderColor: "#a1cffb",
                shadowColor: "rgba(255, 230, 175,0.5)",
                borderWidth: 1,
              },
              emphasis: {
                areaColor: "#52C5F7",
              },
            },
            emphasis: {
              label: {
                show: true,
              },
            },
          },
        ],
      };
      //添加tooltip对象
      initOption.tooltip.formatter = function (params) {
        if (params.seriesType === `effectScatter`) {
          this.proviesName = [];
          const theData = params.data?.theData;
          //省份集合value
          let provies = [];
          theData.map((item) => {
            provies.push(...item.businessArea.split(","));
          });
          //遍历匹配得到省份合集
          provies?.map((item) => {
            mapCenterData.map((ite) => {
              if (item == ite.value) this.proviesName.push(ite.name);
            });
          });
          //数组去重
          this.proviesName = Array.from(new Set(this.proviesName));

          let before = "";
          let center = "";
          // 格式化提示框信息
          theData.map((item) => {
            item.recruitmentInfoList.map((ite) => {
              center += `
                      <div style="width: 15vw;display: flex;justify-content: space-between;padding: 0 10px; font-size: 14px; margin: 10px 0;">
                          ${ite.title}
                      </div>
                `;
            });
            before +=
              `
                  <div style="position: relative;z-index: 100000000000000000000000;">
                    <div style="font-weight: bold;display: flex;padding: 0 5px;justify-content: space-between;margin-bottom: 20px;">
                      <div style="font-weight: bold;color: #348df2;font-size: 16px;z-index:100;">${item.shortName}</div>
                      </div>` +
              center +
              `
                      <div style="width: 15vw;display: flex;justify-content: flex-end;padding: 0 10px; font-size: 14px;" >
                          <div style="align-items: flex-end;display: flex;align-items: center;color:#3da2ff;pointer-events: auto;" class="toJoin-${
                            item.id
                          }">
                            <p οnclick="${this.getMoreJob(item.id)}">更多</p>
                            <svg style="width:20px;height:20px;margin-left: 10px;" t="1672020296882" class="icon" viewBox="0 0 1024 1024" version="1.1" xmlns="http://www.w3.org/2000/svg" p-id="2518" width="200" height="200"><path d="M1024.2048 512c0 6.656-2.4576 13.2608-7.5264 18.2784l-325.8368 325.8368a25.6 25.6 0 1 1-36.1984-36.1984l282.5216-282.5216H25.8048a25.6 25.6 0 1 1 0-51.2h910.9504l-282.112-282.112a25.6 25.6 0 1 1 36.1984-36.1984l325.8368 325.8368c4.608 4.608 7.5264 11.008 7.5264 18.0736V512z" fill="#3ca1fe" p-id="2519"></path></svg>
                          </div>
                        </div>
                      </div>
                        `;
          });

          return before;
        }
      }.bind(this);
      this.chart.setOption(initOption);
      //移入显示区域联动
      this.chart.on("mouseover", (params) => {
        if (params.seriesType == "effectScatter") {
          this.seriesData = [];
          this.proviesName.map((item) => {
            this.seriesData.push({
              name: item + "省",
              value: 5,
            });
            this.chart.setOption({ series: [{}, { data: this.seriesData }] });
          });
        }
      });
      //鼠标移出,清除联动高亮
      this.chart.on("mouseout", (params) => {
        if (params.seriesType == "effectScatter") {
          this.seriesData = [];
          this.chart.setOption({ series: [{}, { data: this.seriesData }] });
        }
      });
    },
注意:初始化图表的数据都来原于后台接口请求,涟漪点的数据,与地图每个区域的数据,需要各位根据实际情况渲染到地图上,然后才会有上面的3个问题的出现
最后:原创不易,转载请注明出处