echarts ——timeLine组件

2023-11-13

echarts ——timeLine组件问题

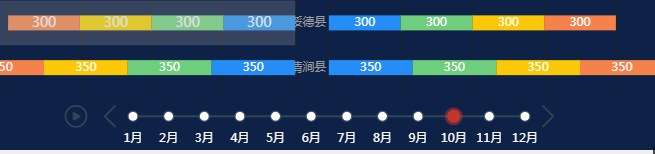
带timeLine 组件的动态图例,从官网社区中的图例非常完美,拷贝到自己的项目中,下面的1月、2月…,只显示0,1,2,3…刚开始以为是获取数据的方法有误,项目空闲期再回看代码发现问题所在。
地址:https://gallery.echartsjs.com/editor.html?c=xRQpCsH8Ci
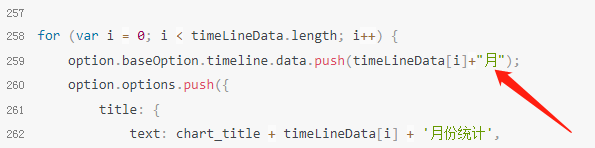
在这里插入图片描述

这行的代码注释掉 !!

这就这行代码
在这儿加上你想要的单位

在这里插入图片描述
以下是全部代码

//图表标题
var chart_title='榆林市十二县农村饮水安全巩固提升情况测试';
//图表X轴数据
var Xdata = ["榆阳区","神木市","府谷县","靖边县","定边县","横山区","吴堡县","米脂县","佳县","子洲县","绥德县","清涧县"];

//图表项目
var fp_key = ['修建饮水工程(处)', '贫困户', '贫困人口','投资金额(万)'];
var fp_bar_postion = ["left","left","left","left","right","right","right","right"];
var fp_coler=['#258df6','#6fce7d','#fbc807','#f5814b'];
//图表项目数据
var fp_val = {
    1: [389, 259, 262, 324, 232, 176, 196, 214, 133, 370, 268, 360, 185, 392, 392, 153, 258, 385, 209, 209, 243, 204, 352, 163,],
    2: [111, 315, 139, 375, 204, 352, 163, 258, 385, 209, 209, 243, 204, 352, 163, 258, 258, 385, 209, 209, 243, 204, 352, 163,],
    3: [227, 210, 328, 292, 241, 110, 130, 185, 392, 392, 153, 187, 150, 200, 250, 300, 258, 385, 209, 209, 243, 204, 352, 163,],
    4: [100, 350, 300, 250, 200, 150, 100, 150, 200, 250, 300, 350, 400, 350, 300, 250, 258, 385, 209, 209, 243, 204, 352, 163,],
    5: [280, 128, 255, 254, 313, 143, 360, 343, 338, 163, 333, 317, 263, 302, 372, 163, 258, 385, 209, 209, 243, 204, 352, 163,],
    6: [121, 388, 233, 309, 133, 308, 297, 283, 349, 273, 229, 238, 224, 291, 185, 203, 258, 385, 209, 209, 243, 204, 352, 163,],
    7: [200, 350, 300, 250, 200, 150, 100, 150, 200, 250, 300, 350, 400, 350, 300, 250, 258, 385, 209, 209, 243, 204, 352, 163,],
    8: [380, 129, 173, 101, 310, 393, 386, 296, 366, 268, 208, 149, 356, 239, 208, 330, 258, 385, 209, 209, 243, 204, 352, 163,],
    9: [363, 396, 388, 108, 325, 120, 180, 292, 200, 309, 223, 236, 209, 271, 215, 216, 258, 385, 209, 209, 243, 204, 352, 163,],
    10: [300, 350, 300, 250, 200, 150, 100, 150, 200, 250, 300, 350, 400, 350, 300, 250, 258, 385, 209, 209, 243, 204, 352, 163,],
    11: [100, 350, 300, 250, 200, 150, 100, 150, 200, 250, 300, 350, 400, 350, 300, 250, 258, 385, 209, 209, 243, 204, 352, 163,],
    12: [280, 128, 255, 254, 313, 143, 360, 343, 338, 163, 333, 317, 263, 302, 372, 163, 258, 385, 209, 209, 243, 204, 352, 163,],

};
//图表月份
var timeLineData = [1, 2, 3, 4, 5, 6, 7, 8, 9, 10, 11, 12,];

option = {
    baseOption: {
        backgroundColor: '#0e2147',
        timeline: {
            show: true,
            axisType: 'category',
            tooltip: {
                show: true,
                formatter: function(params) {
                    console.log(params);
                    return params.name + '月份数据统计';
                }
            },
            autoPlay: true,
            currentIndex: 6,
            playInterval: 1000,
            label: {
                normal: {
                    show: true,
                    interval: 'auto',
                    // formatter: '{value}月',
                },
            },
            data: [],
        },
        title: {
            //   text:'大北京景点帅哥美女统计',
            textStyle: {
                color: '#fff',
                fontSize: 16,
            },
            //subtext: '作者:',
        },
        legend: {
            data: fp_key,
            top: 8,
            right: '20%',
            textStyle: {
                color: '#fff',
            },
        },
        tooltip: {
            show: true,
            trigger: 'axis',
            //formatter: '{b}<br/>{a}: {c}人',
            axisPointer: {
                type: 'shadow',
            }
        },

        toolbox:{
            right:20,
            feature:{
                saveAsImage: {},
                restore: {},
                dataView: {},
                dataZoom: {},
                magicType: {
                    type:['line','bar']
                },
                // brush: {},
            }
        },

        grid: [{
            show: false,
            left: "3%",
            top: 60,
            bottom: 60,
            containLabel: true,
            width:  '45%' ,
        }, {
            show: false,
            left: '50.5%',
            top: 80,
            bottom: 60,
            width:  '9%' ,
        }, {
            show: false,
            right: "3%",
            top: 60,
            bottom: 60,
            containLabel: true,
            width:  '45%' ,
        }, ],

        xAxis: [
            {
                max: function(value) {
                    return value.max*4- 20;
                },
                type: 'value',
                triggerEvent: true,
                inverse: true,
                axisLine: {
                    show: false,
                },
                axisTick: {
                    show: false,
                },
                position: 'top',
                axisLabel: {
                    show: true,
                    textStyle: {
                        color: '#B2B2B2',
                        fontSize: 12,
                    },
                },
                splitLine: {
                    show: true,
                    lineStyle: {
                        color: '#1F2022',
                        width: 1,
                        type: 'solid',
                    },
                },
            },
            {
                gridIndex: 1,
                show: false,
            },
            {
                max: function(value) {
                    return value.max*4- 20;
                },
                gridIndex: 2,
                type: 'value',
                axisLine: {
                    show: false,
                },
                axisTick: {
                    show: false,
                },
                position: 'top',
                axisLabel: {
                    show: true,
                    textStyle: {
                        color: '#B2B2B2',
                        fontSize: 12,
                    },
                },
                splitLine: {
                    show: true,
                    lineStyle: {
                        color: '#1F2022',
                        width: 1,
                        type: 'solid',
                    },
                },
            }
        ],
        yAxis: [{
            type: 'category',
            inverse: true,
            position: 'right',
            axisLine: {
                show: false
            },
            axisTick: {
                show: false
            },
            axisLabel: {
                show: false,
                margin: 8,
                textStyle: {
                    color: '#fff',
                    fontSize: 12,
                },

            },
            data: Xdata,
        }, {
            gridIndex: 1,
            type: 'category',
            inverse: true,
            position: 'left',
            axisLine: {
                show: false
            },
            axisTick: {
                show: false
            },
            axisLabel: {
                show: true,
                textStyle: {
                    color: '#9D9EA0',
                    fontSize: 12,
                },

            },
            data: Xdata.map(function(value) {
                return {
                    value: value,
                    textStyle: {
                        align: 'center',
                    }
                }
            }),
        }, {
            gridIndex: 2,
            type: 'category',
            inverse: true,
            position: 'left',
            axisLine: {
                show: false
            },
            axisTick: {
                show: false
            },
            axisLabel: {
                show: false,
                textStyle: {
                    color: '#9D9EA0',
                    fontSize: 12,
                },

            },
            data: Xdata,
        }, ],
        series: [],

    },

    options: [],


};

for (var i = 0; i < timeLineData.length; i++) {
    option.baseOption.timeline.data.push(timeLineData[i]+"月");
    option.options.push({
        title: {
            text: chart_title + timeLineData[i] + '月份统计',
        },
        series: [{
            name: fp_key[0],
            type: 'bar',
            stack: 'one',
            barGap: 15,
            barWidth: 15,
            label: {
                normal: {
                    show: true,
                    position:'inside',
                    textStyle: {
                        color: '#fff',

                        fontSize: 12,
                    },
                },
                emphasis: {
                    show: true,
                    position: 'inside',
                    offset: [0, 0],
                    textStyle: {
                        color: '#fff',
                        fontSize: 14,
                    },
                },
            },
            itemStyle: {
                normal: {
                    color: function(params) {
                        return fp_coler[0]
                    },
                    opacity: 1,

                },
                emphasis: {
                    opacity: 1,
                },
            },
            data: fp_val[timeLineData[i]],
        },

            {
                name: fp_key[1],
                type: 'bar',
                stack: 'one',
                barGap: 15,
                barWidth: 15,
                label: {
                    normal: {
                        show: true,
                        position:'inside',
                        textStyle: {
                            color: '#fff',

                            fontSize: 12,
                        },
                    },
                    emphasis: {
                        show: true,
                        position: 'inside',
                        offset: [0, 0],
                        textStyle: {
                            color: '#fff',
                            fontSize: 14,
                        },
                    },
                },
                itemStyle: {
                    normal: {
                        color: function(params) {
                            return fp_coler[1]
                        },
                        opacity: 1,

                    },
                    emphasis: {
                        opacity: 1,
                    },
                },
                data: fp_val[timeLineData[i]],
            },

            {
                name: fp_key[2],
                stack: 'one',
                type: 'bar',
                barGap: 15,
                barWidth: 15,
                label: {
                    normal: {
                        show: true,
                        position: 'inside',
                    },
                    emphasis: {
                        show: true,
                        position: 'inside',
                        offset: [0, 0],
                        textStyle: {
                            color: '#fff',
                            fontSize: 14,
                        },
                    },
                },
                itemStyle: {
                    normal: {
                        color: function(params) {
                            return fp_coler[2]
                        },
                        opacity: 1,

                    },
                    emphasis: {
                        opacity: 1,
                    },
                },
                data: fp_val[timeLineData[i]],
            },
            {
                name: fp_key[3],
                stack: 'one',
                type: 'bar',
                barGap: 15,
                barWidth: 15,
                label: {
                    normal: {
                        show: true,
                        position: 'inside',
                    },
                    emphasis: {
                        show: true,
                        position: 'inside',
                        offset: [0, 0],
                        textStyle: {
                            color: '#fff',
                            fontSize: 14,
                        },
                    },
                },
                itemStyle: {
                    normal: {
                        color: function(params) {
                            return fp_coler[3]
                        },
                        opacity: 1,

                    },
                    emphasis: {
                        opacity: 1,
                    },
                },
                data: fp_val[timeLineData[i]],
            },
            {
                name: fp_key[0],
                stack: 'right',
                type: 'bar',
                barGap: 15,
                barWidth: 15,
                xAxisIndex: 2,
                yAxisIndex: 2,
                label: {
                    normal: {
                        show: true,
                        position: 'inside',
                    },
                    emphasis: {
                        show: true,
                        position: 'inside',
                        offset: [0, 0],
                        textStyle: {
                            color: '#fff',
                            fontSize: 14,
                        },
                    },
                },
                itemStyle: {
                    normal: {
                        color: function(params) {
                            return fp_coler[0]
                        },
                        opacity: 1,

                    },
                    emphasis: {
                        opacity: 1,
                    },
                },

                data: fp_val[timeLineData[i]],
            },
            {
                name: fp_key[1],
                stack: 'right',
                type: 'bar',
                barGap: 15,
                barWidth: 15,
                xAxisIndex: 2,
                yAxisIndex: 2,
                label: {
                    normal: {
                        show: true,
                        position:'inside',
                        textStyle: {
                            color: '#fff',
                            fontSize: 12,
                        },
                    },
                    emphasis: {
                        show: true,
                        position: 'inside',
                        offset: [0, 0],
                        textStyle: {
                            color: '#fff',
                            fontSize: 14,
                        },
                    },
                },
                itemStyle: {
                    normal: {
                        color: function(params) {
                            return fp_coler[1]
                        },
                        opacity: 1,

                    },
                    emphasis: {
                        opacity: 1,
                    },
                },
                data: fp_val[timeLineData[i]],
            },
            {
                name: fp_key[2],
                stack: 'right',
                type: 'bar',
                barGap: 15,
                barWidth: 15,
                xAxisIndex: 2,
                yAxisIndex: 2,
                label: {
                    normal: {
                        show: true,
                        position:'inside',
                        textStyle: {
                            color: '#fff',
                            fontSize: 12,
                        },
                    },
                    emphasis: {
                        show: true,
                        position: 'inside',
                        offset: [0, 0],
                        textStyle: {
                            color: '#fff',
                            fontSize: 14,
                        },
                    },
                },
                itemStyle: {
                    normal: {
                        color: function(params) {
                            return fp_coler[2]
                        },
                        opacity: 1,

                    },
                    emphasis: {
                        opacity: 1,
                    },
                },
                data: fp_val[timeLineData[i]],
            },
            {
                name: fp_key[3],
                stack: 'right',
                type: 'bar',
                barGap: 15,
                barWidth: 15,
                xAxisIndex: 2,
                yAxisIndex: 2,
                label: {
                    normal: {
                        show: true,
                        position:'inside',
                        textStyle: {
                            color: '#fff',
                            fontSize: 12,
                        },
                    },
                    emphasis: {
                        show: true,
                        position: 'inside',
                        offset: [0, 0],
                        textStyle: {
                            color: '#fff',
                            fontSize: 14,
                        },
                    },
                },
                itemStyle: {
                    normal: {
                        color: function(params) {
                            return fp_coler[3]
                        },
                        opacity: 1,

                    },
                    emphasis: {
                        opacity: 1,
                    },
                },
                data: fp_val[timeLineData[i]],
            },
        ]
    });
}
本文内容由网友自发贡献,版权归原作者所有,本站不承担相应法律责任。如您发现有涉嫌抄袭侵权的内容,请联系:hwhale#tublm.com(使用前将#替换为@)

echarts ——timeLine组件 的相关文章

随机推荐

  • 使用openCV查看png图片的各通道值

    png格式的图片除了能展现出各种各样的色彩外 还能表现出 透明 的特点 这是因为这种格式的图片除了含有我们常见的RGB三个颜色通道外 还有一个A通道来控制图片的透明效果 使用openCV可以方便的查看各种格式图片各个通道的值 思路如下 首先
  • windows 下的composer 可能遇到(Loading composer repositories with package information)

    最容易遇到下面这个问题 Loading composer repositories with package information Updating dependencies including require dev 在dos界面下输入
  • Unity Inputfield获得和失去焦点

    获取焦点 public InputField inputField void Start inputField ActivateInputField 失去焦点 public InputField inputField void Start
  • electron-egg: 新一代桌面应用开发框架

    当前桌面软件技术有哪些 语言 技术 优点 缺点 C wpf 专业的桌面软件技术 功能强大 学习成本高 Java swing javaFx 跨平台和语言流行 GUI库少 界面不美观 C Qt 跨平台 功能和类库丰富 学习成本高 Swift 无
  • 用Python画笑脸

    开心一下 喵 很早之前画的 放上来做个纪念吧 代码如下 from turtle import screensize 600 600 speed 10 def Arc initial degree step rotate rangeNum s
  • cmake

    ubuntu系统当库安装后 需要包含头文件一般在 usr local include 比如 include directories usr local include ImageMagick 7 这样就能调用各种功能头文件 但还要包含 so
  • 数据结构基本概念及算法分析

    文章目录 1 数据结构基本概念 1 1 基本概念和术语 1 1 1 数据 1 1 2 数据元素 1 1 3 数据项 1 1 4 数据对象 1 1 5 数据结构 1 2 逻辑结构与物理结构 1 2 1 逻辑结构 我们最需要关注的问题 1 2
  • 从在浏览器的输入框输入一个网址,到看到网页的内容,这个过程中发生了什么?

    https www cnblogs com ouyang99 p 10284271 html 从在浏览器的输入框输入一个网址 到看到网页的内容 这个过程中发生了什么 当在浏览器地址栏输入网址 如 www baidu com后浏览器是怎么把最
  • 硬件设计27之RS232

    串口通讯 串口通讯 Serial Communication 是一种设备间非常常用的串行通讯方式 因为它简单便捷 大部分电子设备都支持该通讯方式 电子工程师在调试设备时也经常使用该通讯方式输出调试信息 在计算机科学里 大部分复杂的问题都可以
  • js实现简单的视频播放

    功能1 播放暂停切换 思路 准备一个播放的图片和一个暂停的图片 利用标杆思想 设置一个flag变量 播放的时候将flag设置为false 暂停的时候设置为true 如果flag为true则播放同时改变为播放图片 为false则暂停同时改变为
  • 游游的排列构造

    示例1 输入 5 2 输出 3 1 5 2 4 示例2 输入 5 3 输出 2 1 4 3 5 include
  • C语言一行一行读取文件

    C语言中 使用fgets函数可以一行行读du取文件 1 fgets函数 原型 char fgets char buf int bufsize FILE stream 功能 从文件结构体指针stream中读取数据 每次读取一行 说明 读取的数
  • MySQL常用的文本文件导出导入方式总结

    目录 一 导出 1 1 mysql命令导出文本文件 1 2 select into outfile导出文本文件 1 3 mysqldump导出文本文件 二 导入 2 1 mysqlimport导入文本文件 2 2 LOAD DATA INF
  • 笔记记录--基于ccpd数据集利用Paddle OCR训练车牌检测模型

    目录 1 环境搭建 2 数据集划分 3 训练模型 4 推理测试 1 环境搭建 安装Paddle OCR参考 创建环境 conda create n paddle env python 3 8 conda activate paddle en
  • Zookeeper报错Will not attempt to authenticate using SASL解决办法

    Will not attempt to authenticate using SASL unknown error 经过查资料 这个问题与zookeeper里面的zoo cfg配置有关 在程序填写的zookeper的路径 一定与zoo cf
  • CSS网页设计》》

    这是跟着老师做的一个小案例 小小的有了一点成就感 下次努力 div class header div class logo img src img logo png alt logo div div class nav u u div di
  • Linux设备驱动的软件架构思想与设备驱动的基础内容总结

    Linux设备驱动的软件架构思想与设备驱动的基础内容总结 Linux是一个兼容性特别强的一个系统 而兼容性的实现与驱动强大的适应性密不可分 而这个具体的实现是离不开 总线bus和类class的管理方式 Linux使用bus统一的管理一系列相
  • Tomcat 部署方式

    Tomcat中三种部署项目的方法 第一种方法 在tomcat中的conf目录中 在server xml中的
  • 思科三层交换机IPv6静态和默认路由配置

    基础配置 SWA Switch gt ena Switch conf t Switch config host SWA SWA config vlan 10 SWA config vlan vlan 100 SWA config vlan
  • echarts ——timeLine组件

    echarts timeLine组件问题 带timeLine 组件的动态图例 从官网社区中的图例非常完美 拷贝到自己的项目中 下面的1月 2月 只显示0 1 2 3 刚开始以为是获取数据的方法有误 项目空闲期再回看代码发现问题所在 地址 h