C1.1 Introduction to ARMv7-M debug
This section describes the debug architecture for the ARMv7-M architecture profile. This includes several debug features that are supported only in the M profile.
Debug support is a key element of the ARM architecture. ARMv7-M supports a range of invasive and non-invasive debug mechanisms.
Invasive debug mechanisms are:
• The ability to halt the processor, for example at a breakpoint. This provides a run-stop debug model.
• Debug code using the DebugMonitor exception. This provides less intrusive debug than halting the processor.
Non-invasive debug techniques are:
• Application trace by writing to the Instrumentation Trace Macrocell (ITM), causing a very low level of intrusion.
• Non-intrusive program trace and profiling.
Debug software normally accesses the debug features of the processor using the DAP, see The Debug Access Port on page C1-682. This provides access to debug resources when the processor is running, halted, or held in reset. When a processor is halted, it is in Debug state. When the processor is not halted, it is in Non-Debug state.
The ARMv7-M debug architecture supports the following features:
• High-level trace using the ITM.
• Profiling a variety of system events, including associated timing information. This can include monitoring processor clock counts associated with interrupt and sleep functions.
• PC sampling and event counts associated with load and store operations, instruction folding, and performance statistics based on cycles-per-instruction (CPI) counts.
• Data tracing.
• Instruction trace, using an Embedded Trace Macrocell (ETM).
In the ARMv7-M system address map, debug resources are in the Private Peripheral Bus (PPB) region. Except for the resources in the System Control Space (SCS), each debug component occupies a fixed 4KB address region. The resources are:
• Debug resources in the SCS:
— The Debug Control Block (DCB).
— Debug controls in the System Control Block (SCB).
• Debug components:
— The Instrumentation Trace Macrocell (ITM), for profiling software. This uses non-blocking register accesses, with a fixed low-intrusion overhead, and can be added to a Real-Time Operating System (RTOS), application, or exception handler. If necessary, product code can retain the register access instructions, avoiding probe effects.
— The Debug Watchpoint and Trace (DWT) unit. This provides watchpoint support, program counter
sampling for performance monitoring, and embedded trace trigger control.
— The Flash Patch and Breakpoint (FPB) unit. This unit can remap sections of ROM, typically Flash
memory, to regions of RAM, and can set breakpoints on code in ROM. This unit can be used for debug,
and to provide a code or data patch to an application that requires a field update to a product ROM.
— The Embedded Trace Macrocell (ETM). This provides instruction tracing.
— The Trace Port Interface Unit (TPIU). This provides the external interface for the ITM, DWT, and
ETM.
• The ROM table. A table of entries providing a mechanism to identify the debug infrastructure supported by the implementation.
Note: An implementation might not include all the listed debug features, see Debug support in ARMv7-M on page C1-679.
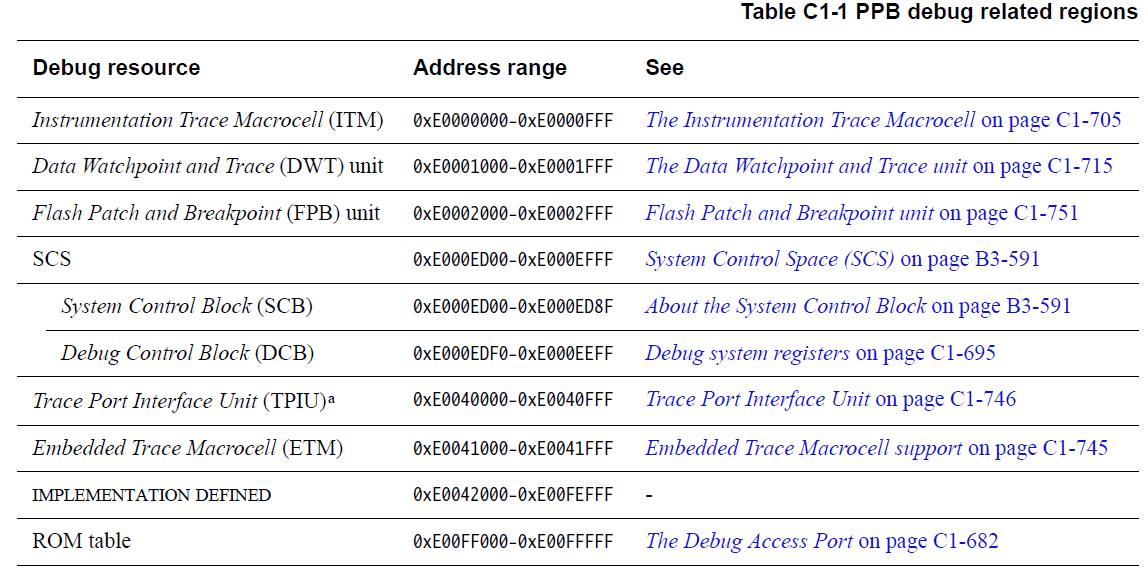
a. Might be implemented as a shared resource, in which case this region of the memory map is reserved.
Appendix D4 Debug ITM and DWT Packet Protocol describes the protocol used for ITM and DWT output, and the ETM Architecture Specification describes the protocol used for ETM output.
A debug implementation that outputs ITM, DWT, or ETM data requires a trace sink, such as a TPIU, to which it exports the trace data from the device, providing one or more of data trace, instruction trace, and profiling. A TPIU can be either the ARMv7-M TPIU implementation shown in Table C1-1, or an external system resource, usually a CoreSight TPIU. For more information about the CoreSight TPIU see the ARM® CoreSight™ SoC-400 Technical Reference Manual.
Many debug components are optional, and the debug configuration of an implementation is IMPLEMENTATION DEFINED. Debug support in ARMv7-M describes how software can determine which debug features are implemented.