前言:最近有个项目需要用到echarts绘制多个图表,需求是要支持大屏展示,还有需要支持不同比例的缩放和任意手动缩放。因此,深入学习了echarts和flex布局。虽然遇到很多问题,但都一一解决了收获良多。故此写下遇到的问题与坑,与之共勉。
1.echarts图表需要在一个有给定宽、高的容器里才会绘图。
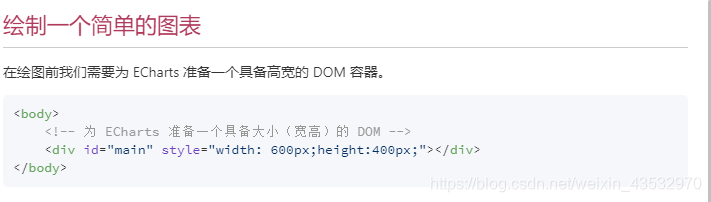
上图截图与echarts官网,地址:echarts官网
不得不提一下,都2020年了还不支持自动获取高度…(感觉可以这个echarts得优化)。
解决方法:给定一个宽高的容器即可。
2.echarts图表需要添加resize()方法才能自适应缩放。
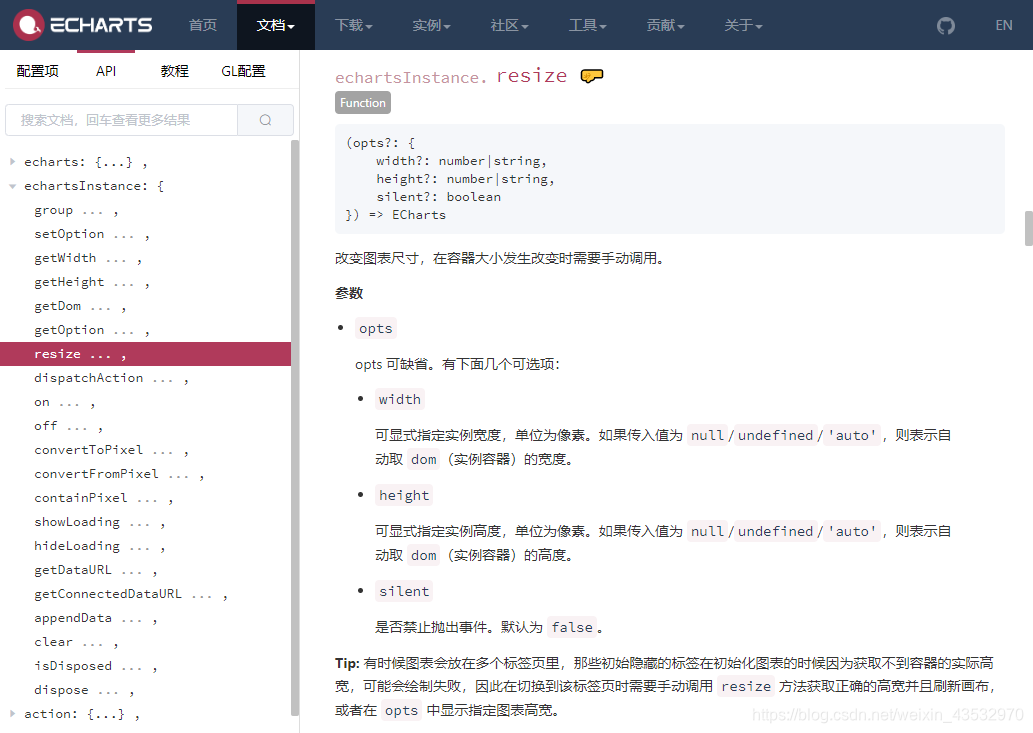
地址:echarts自适应缩放问题截图
echarts的图表不会自动适用屏幕缩放,需要手动添加resize函数才行。
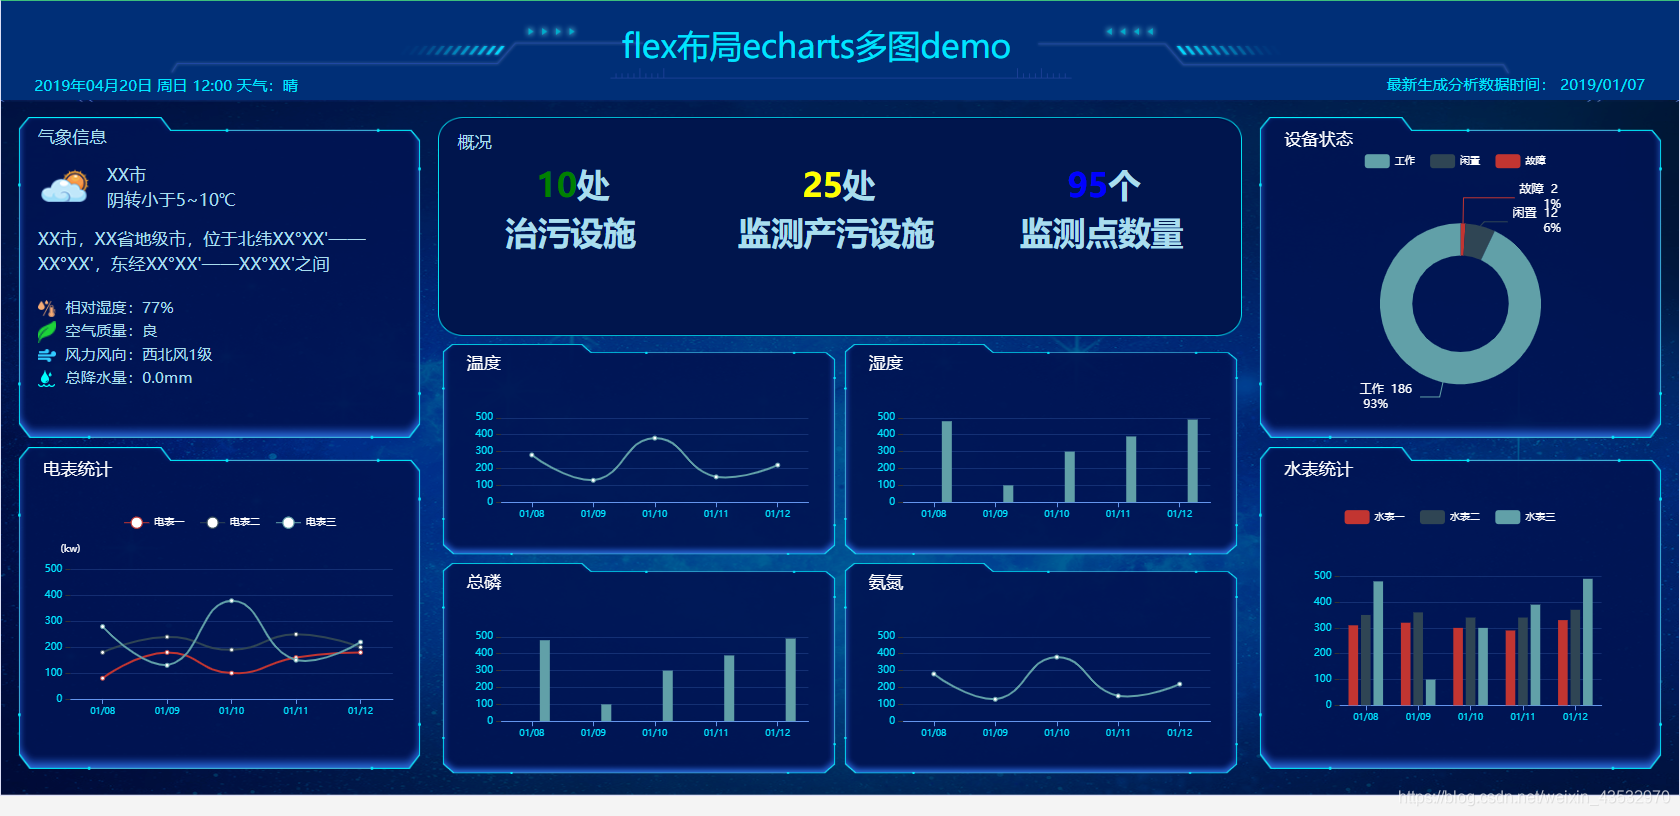
3.(重点)使用flex布局echarts多图不能自适应缩放。
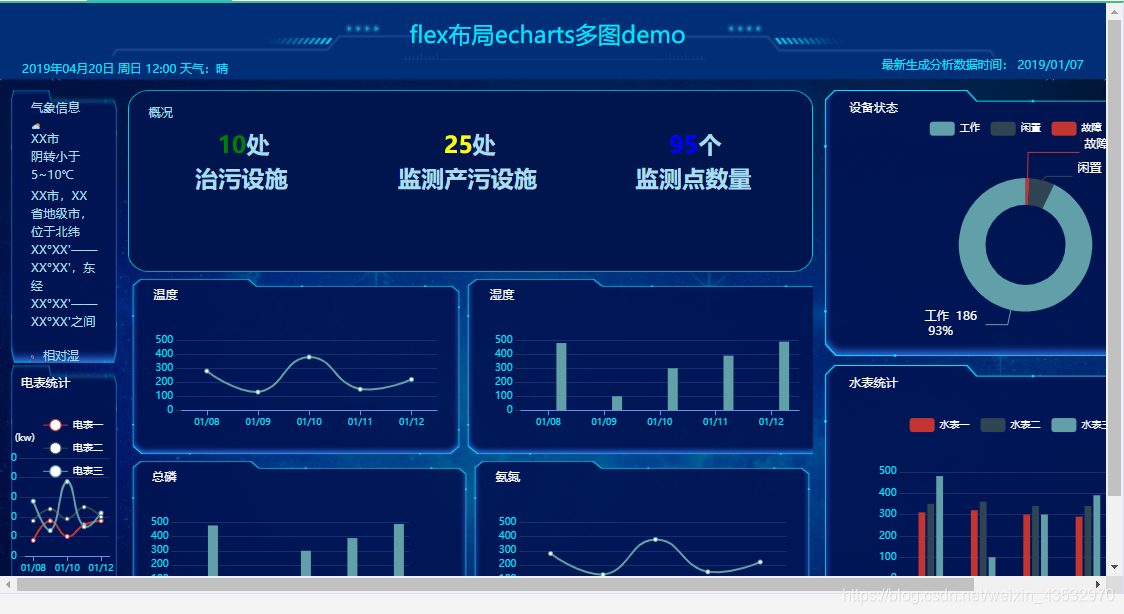
在flex布局下,添加了resize函数后,echarts多图不能自适应缩放。如果一个flex-item里只有一个图的话,那缩放就没问题。但是如果一个flex-item里有2个或2个以上的图,那坑就出现了。
全屏时
缩小时
代码
<template>
<div class="overall-monitoring">
<!-- 头部信息 -->
<div class="header-panel">
<div class="header-panel-title">
<h1>flex布局echarts多图demo</h1>
</div>
<div class="headr-panel-span">
<span class="headr-panel-span-left">2019年04月20日 周日 12:00 天气:晴</span>
<span class="headr-panel-span-right">最新生成分析数据时间: 2019/01/07</span>
</div>
</div>
<!-- 主要内容 -->
<div class="main-panel">
<!-- 左边信息 -->
<div class="main-panel-left">
<div id="weather" class="main-panel-left-top mian-panel-lfet-bg">
<div class="main-panel-left-top-weatherMsg">
<div class="weatherMsg1">
<h3>气象信息</h3>
</div>
<div class="weatherMsg2">
<img src="../../assets/image/nanping-weather-overcast.png">
<div class="weatherMsg2area">
<span>XX市</span><br>
<span>阴转小于5~10℃</span>
</div>
</div>
<div class="weatherMsg3">
<p>XX市,XX省地级市,位于北纬XX°XX'——XX°XX',东经XX°XX'——XX°XX'之间</p>
</div>
<div class="weatherMsg4">
<span><img src="../../assets/image/nanping-weather-humidity.png"> 相对湿度:77%</span><br>
<span><img src="../../assets/image/nanping-weather-air.png"> 空气质量:良</span><br>
<span><img src="../../assets/image/nanping-weather-wind.png"> 风力风向:西北风1级</span><br>
<span><img src="../../assets/image/nanping-weather-rain.png"> 总降水量:0.0mm</span><br>
</div>
</div>
</div>
<div id="ammeter" class="main-panel-left-bottom mian-panel-lfet-bg"></div>
</div>
<!-- 中间信息 -->
<div class="main-panel-middle">
<div class="main-panel-middle-survey">
<h3>概况</h3>
<div>
<span style="color: green;padding-left: 2%;">10</span>
<span>处</span><br>
<span>治污设施</span>
</div>
<div>
<span style="color: yellow;padding-left: 2%;">25</span>
<span>处</span><br>
<span>监测产污设施</span>
</div>
<div>
<span style="color: blue;padding-left: 2%;">95</span>
<span>个</span><br>
<span>监测点数量</span>
</div>
</div>
<div class="main-panel-middle-echarts-top">
<div id="temperature" class="main-panel-middle-echarts-top-1 main-panel-middle-echarts-bg"></div>
<div id="humidity" class="main-panel-middle-echarts-top-2 main-panel-middle-echarts-bg"></div>
</div>
<div class="main-panel-middle-echarts-bottom">
<div id="phosphorus" class="main-panel-middle-echarts-bottom-1 main-panel-middle-echarts-bg"></div>
<div id="ammonia" class="main-panel-middle-echarts-bottom-2 main-panel-middle-echarts-bg"></div>
</div>
</div>
<!-- 右边信息 -->
<div class="main-panel-right">
<div id="equipment" class="main-panel-right-top mian-panel-lfet-bg"></div>
<div id="watermeter" class="main-panel-right-bottom mian-panel-lfet-bg"></div>
</div>
</div>
</div>
</template>
<script>
import echarts from "echarts";
export default {
data() {
return {
// 天气
weather: null,
// 电表统计
ammeterData: {},
// 设备状态
equipmentData: {},
// 水表统计
watermeterData: {},
// 概况
surveyData:null,
// 温度
temperatureData: {},
// 湿度
humidityData: {},
// 总磷
phosphorusData: {},
// 氨氮
ammoniaData: {},
bodyWidth: 0,
contentHeight: 0,
}
},
methods: {
// 动态获取container父元素的宽度高度并初始化给overallmonitoring
initOverallMonitoring() {
this.bodyWidth = document.body.clientWidth;
this.contentHeight = document.getElementsByClassName('content-wrap')[0].offsetHeight;
},
// 自适应
resizeEcharts() {
// console.log("宽度:"+this.bodyWidth);
// console.log("高度:"+this.contentHeight);
this.drawCharts();
},
// 画图
drawCharts() {
let ammeter = document.getElementById('ammeter');
let equipment = document.getElementById('equipment');
let watermeter = document.getElementById('watermeter');
let temperature = document.getElementById('temperature');
let humidity = document.getElementById('humidity');
let phosphorus = document.getElementById('phosphorus');
let ammonia = document.getElementById('ammonia');
this.createLine(ammeter, this.ammeterData);
this.createPie(equipment, this.equipmentData);
this.createBar(watermeter, this.watermeterData);
this.createLine(temperature, this.temperatureData);
this.createBar(humidity, this.humidityData);
this.createBar(phosphorus, this.phosphorusData);
this.createLine(ammonia, this.ammoniaData);
},
// 折线图
createLine(element,obj) {
element = echarts.init(element);
element.setOption({
// 全局样式
textStyle: {
color: 'rgba(255, 255, 255, 1)',
fontSize: 10
},
// 坐标系左上角标题
title: {
left: '5%',
top: '3%',
text: obj.title ? obj.title : '默认标题',
textStyle: {
color: 'rgba(255, 255, 255, 1)',
fontSize: obj.titleSize ? obj.titleSize : 15,
fontWeight: 'normal',
},
},
// 提示框组件
tooltip: {
trigger: 'item',
formatter: obj.title === '电表统计' ? '电表:{a} <br/>时间:{b} <br/> 数值:{c}' : '时间:{b} <br/> 数值:{c}'
},
// 图例
legend: {
left: '25%',
width: '65%',
top: '20%',
height: '40%',
textStyle: {
color: 'rgba(255, 255, 255, 1)'
},
orient: obj.legendOrient ? obj.legendOrient : 'horizontal',
itemGap: obj.legendItemGap ? obj.legendItemGap : 10,
data: obj.legendData ? obj.legendData : '',
},
// 直角坐标系
grid: {
show: false,
left: obj.gridLeft ? obj.gridLeft : '15%',
width: obj.gridWidth ? obj.gridWidth : '78%',
bottom: obj.girdBottom ? obj.girdBottom : '25%',
height: obj.gridHeight ? obj.gridHeight : '40%',
},
// x轴
xAxis: [{
axisLine: {
lineStyle: {
color: 'rgba(100, 149, 237, 1)'
}
},
axisTick: {
alignWithLabel: true,
},
axisLabel: {
textStyle: {
color: 'rgba(0, 228, 255, 1)',
fontSize: 9
}
},
data: ['01/08', '01/09', '01/10', '01/11', '01/12'],
}],
// y轴
yAxis: [{
name: obj.yAxisName ? obj.yAxisName : '',
type: 'value',
min: 0,
max: 500,
splitNumber: 5,
splitLine: {
lineStyle: {
color: 'rgba(100, 149, 237, 0.2)',
}
},
axisLine: {
show: false,
},
axisLabel: {
textStyle: {
color: 'rgba(0, 228, 255, 1)',
fontSize: obj.yAxisSize ? obj.yAxisSize : 10
}
},
}],
// 系列
series: [
{
name: obj.legendData[0],
type: 'line',
lineStyle: { width:2 },
smooth: true,
data: obj.seriesData.length>2 ? obj.seriesData[0] : '',
},
{
name: obj.legendData[1],
type: 'line',
lineStyle: { width:2 },
smooth: true,
data: obj.seriesData.length>2 ? obj.seriesData[1] : '',
},
{
name: obj.legendData[2],
type: 'line',
lineStyle: { width:2 },
smooth: true,
data: [280, 130, 380, 150, 220],
},
]
});
// 添加resize监听事件 目的是让echarts自适应
window.addEventListener("resize", () => {
element.resize();
})
},
// 饼状图
createPie(element,obj) {
element = echarts.init(element);
element.setOption({
// 全局样式
textStyle: {
color: 'rgba(255, 255, 255, 1)',
fontSize: 10
},
// 坐标系左上角标题
title: {
left: '5%',
top: '3%',
text: obj.title ? obj.title : '默认标题',
textStyle: {
color: 'rgba(255, 255, 255, 1)',
fontSize: obj.titleSize ? obj.titleSize : 15,
fontWeight: 'normal',
},
},
// 提示框组件
tooltip: {
trigger: 'item',
formatter: '状态: {b}<br/> 数量: {c}<br/> 占比: {d}%'
},
// 图例
legend: {
left: obj.legendLeft ? obj.legendLeft :'5%',
width: obj.legendWidth ? obj.legendWidth : '65%',
top: obj.legendTop ? obj.legendTop :'20%',
height: obj.legendHeight ? obj.legendHeight : '40%',
orient: obj.legendOrient ? obj.legendOrient :'',
textStyle: {
color: 'rgba(255, 255, 255, 1)'
},
itemGap: obj.legendItemGap ? obj.legendItemGap : 20,
data: obj.legendData ? obj.legendData : [{ name: '故障', value: 2 },{ name: '闲置', value: 12 },{ name: '工作', value: 186 },],
icon: 'roundRect'
},
// 系列
series: [{
type: 'pie',
center: obj.seriesCenter ? obj.seriesCenter : ['55%', '50%'],
radius: obj.seriesRadius ? obj.seriesRadius : ['35%', '55%'],
label: {
position: 'outer',
alignTo: 'edge',
margin: '25%',
formatter: '{b} {c} \n {d}%',
fontSize: obj.seriesLabelSize ? obj.seriesLabelSize : 12,
lineHeight: 15,
},
data: obj.seriesData ? obj.seriesData : [{ name: '故障', value: 2 },{ name: '闲置', value: 12 },{ name: '工作', value: 186 },],
}]
});
// 添加resize监听事件 目的是让echarts自适应
window.addEventListener("resize", () => {
element.resize();
})
},
// 条形图
createBar(element,obj) {
element = echarts.init(element);
element.setOption({
// 全局样式
textStyle: {
color: 'rgba(255, 255, 255, 1)',
fontSize: 10
},
// 坐标系左上角标题
title: {
left: '5%',
top: '3%',
text: obj.title ? obj.title : '默认标题',
textStyle: {
color: 'rgba(255, 255, 255, 1)',
fontSize: obj.titleSize ? obj.titleSize : 15,
fontWeight: 'normal',
},
},
// 提示框组件
tooltip: {
trigger: 'item',
formatter: obj.title === '水表统计' ? '水表:{a} <br/>时间:{b} <br/> 数值:{c}' : '时间:{b} <br/> 数值:{c}'
},
// 图例
legend: {
show: true,
left: '20%',
width: '65%',
top: '18%',
height: '40%',
orient: obj.legendOrient ? obj.legendOrient : 'horizontal',
itemGap: obj.legendItemGap ? obj.legendItemGap : 10,
textStyle: {
color: 'rgba(255, 255, 255, 1)'
},
data: obj.legendData ? obj.legendData : ''
},
// 直角坐标系
grid: {
show: false,
left: obj.gridLeft ? obj.gridLeft :'15%',
width: obj.gridWidth ? obj.gridWidth : '78%',
bottom: obj.girdBottom ? obj.girdBottom : '25%',
height: obj.gridHeight ? obj.gridHeight : '40%',
},
// x轴
xAxis: [{
axisLine: {
lineStyle: {
color: 'rgba(100, 149, 237, 1)'
}
},
axisTick: {
alignWithLabel: true,
},
axisLabel: {
textStyle: {
color: 'rgba(0, 228, 255, 1)',
fontSize: 9
}
},
data: ['01/08', '01/09', '01/10', '01/11', '01/12'],
}],
// y轴
yAxis: [{
name: obj.yAxisName ? obj.yAxisName : '',
type: 'value',
min: 0,
max: 500,
splitNumber: 5,
splitLine: {
lineStyle: {
color: 'rgba(100, 149, 237, 0.2)',
}
},
axisLine: {
show: false,
},
axisLabel: {
textStyle: {
color: 'rgba(0, 228, 255, 1)',
fontSize: obj.yAxisSize ? obj.yAxisSize : 10
}
},
}],
// 系列
series: [
{
name: obj.legendData[0],
type: 'bar' ,
barWidth: obj.seriesBarWidth ? obj.seriesBarWidth : 10,
data: obj.seriesData.length>1 ? obj.seriesData[0] : ''
},
{
name: obj.legendData[1],
type: 'bar' ,
barWidth: obj.seriesBarWidth ? obj.seriesBarWidth : 10,
data: obj.seriesData.length>1 ? obj.seriesData[1] : ''
},
{
name: obj.legendData[2],
type: 'bar' ,
barWidth: obj.seriesBarWidth ? obj.seriesBarWidth : 10,
data: [480, 100, 300, 390, 490]
},
]
});
// 添加resize监听事件 目的是让echarts自适应
window.addEventListener("resize", () => {
element.resize();
})
},
},
watch: {
bodyWidth() {
this.resizeEcharts();
},
},
mounted() {
const that = this;
that.initOverallMonitoring()
window.onresize = () => {
return (() => {
that.bodyWidth = document.body.clientWidth;
that.contentHeight = document.getElementsByClassName('content-wrap')[0].offsetHeight;
})()
};
},
beforeDestroy() {
// 销毁实例之前移除监听事件 防止内存泄漏
window.removeEventListener("resize",() => {
this.ammeter.resize();
this.equipment.resize();
this.watermeter.resize();
this.temperature.resize();
this.humidity.resize();
this.phosphorus.resize();
this.ammonia.resize();
})
}
}
</script>
<style>
/* 容器设置 */
.overall-monitoring {
width: 100%;
height: 100%;
display: flex;
display: -webkit-flex;
flex-direction: column;
font-family: Microsoft Yahei;
}
/* 头部面版 */
.header-panel {
flex: 1;
background:#002f77 url('../../assets/image/nanping-header-bg.png') no-repeat 50%;
background-size: 80%;
color: #00e4ff;
display: flex;
display: -webkit-flex;
flex-direction: column;
}
.header-panel-title {
flex: 5;
padding: 1.5% 0 0 37%;
font-family: Heiti SC;
}
.headr-panel-span {
flex: 3;
}
.headr-panel-span-left {
margin-left: 2%;
}
.headr-panel-span-right {
float: right;
margin-right: 2%;
}
/* 主面版 */
.main-panel {
flex: 7;
width: 100%;
height: 100%;
background: url('../../assets/image/nanping-main-bg.png') no-repeat;
background-size: 100% 100%;
font-family: Microsoft Yahei;
color: #a9ddee;
display: flex;
display: -webkit-flex;
}
/* 左边面版 */
.main-panel-left {
flex: 1;
width: 100%;
height: 100%;
padding: 1% 0.5% 1% 1%;
display: flex;
display: -webkit-flex;
flex-direction: column;
}
.main-panel-left-top {
flex: 1;
overflow: hidden;
margin-bottom: 2%;
}
.main-panel-left-bottom {
flex: 1;
margin-bottom: 2%;
}
.mian-panel-lfet-bg {
background:url('../../assets/image/nanping-rectangle-bg.png') no-repeat;
background-size: 100% 100%;
}
.main-panel-left-top-weatherMsg {
padding: 10px 20px;
}
.weatherMsg2 {
margin: 4% 0;
clear: both;
}
.weatherMsg2>img {
width: 13%;
float: left;
margin: 2% 5% 0 1%;
}
.weatherMsg2>div {
float: left;
}
.weatherMsg2>span {
margin: 1% 0;
}
.weatherMsg3 {
padding: 4% 0 1% 0;
clear:both;
}
.weatherMsg4 {
clear: both;
}
.weatherMsg4>span>img {
width: 5%;
margin-right: 5px;
}
/* 中间面版 */
.main-panel-middle {
flex: 2;
/* width: 50%;
min-width: 50%;
max-width: 50%; */
color: #a9ddee;
padding: 1% 0.5%;
display: flex;
display: -webkit-flex;
flex-direction: column;
}
.main-panel-middle-survey {
flex: 1;
overflow: hidden;
font-weight: bold;
background: url('../../assets/image/nanping-survey-bg12.png') no-repeat;
background-size: 100% 100%;
margin-bottom: 0.5%;
}
.main-panel-middle-survey>h3 {
padding: 15px 0 0 20px;
}
.main-panel-middle-survey>div {
width: 33%;
display: inline-block;
text-align: center;
}
.main-panel-middle-echarts-top,
.main-panel-middle-echarts-bottom {
flex: 1;
overflow: hidden;
display: flex;
display: -webkit-flex;
}
.main-panel-middle-echarts-top-1,
.main-panel-middle-echarts-top-2,
.main-panel-middle-echarts-bottom-1,
.main-panel-middle-echarts-bottom-2 {
flex: 1;
margin: 0.5%;
}
.main-panel-middle-echarts-bg {
background:url('../../assets/image/nanping-rectangle-bg.png') no-repeat;
background-size: 100% 100%;
}
/* 右边面版 */
.main-panel-right {
flex: 1;
/* width: 25%;
min-width: 25%;
max-width: 25%; */
padding: 1% 1% 1% 0.5%;
display: flex;
display: -webkit-flex;
flex-direction: column;
}
.main-panel-right-top,
.main-panel-right-bottom {
flex: 1;
margin-bottom: 2%;
}
</style>
这多图缩放问题我在网上找了很多资料都没能解决,一开始以为是flex布局出了问题。
每个项目都设置flex-shrink为1,无效。
每个项目都设置flex-basis为auto,无效。
后来发现echarts图表自适应出了问题,以为resize()没有生效。
在每个图表后添加resize()方法,生效了但问题没解决。应该说一开始就生效了,只是echarts图表的宽度出了问题。
几经波折又研究echarts、又研究flex布局,究竟怎么才能让echarts图表获取正确的宽度呢?思来想去、寝食不安,终于在今天下午吃午饭前看到了一个网友说为什么不强制设置宽度呢,让它自适应。结果
width:25%;
min-width:25%;
max-width:25%;
在mian-panel-left、mian-panel-middle、mian-panel-right三个flex-item添加上面CSS语句就可以了!!!
哎 千辛万苦绕来绕去结果就这样,感觉要被自己蠢哭。
不过这个过程里学到了许多,例如echarts基本画图和flex基本布局都有了深入的了解,全当为以后学习吧~
最后,可能我写的不好,代码也有待优化。但这就是此时的我,虽然很菜但也成长路上浓厚的一笔。能帮到大家那当然好,如果对大家没帮助就权当笑料啦。
共勉