//路径:com.android.server.am.ActiveServices.java// How long we wait for a service to finish executing.staticfinalintSERVICE_TIMEOUT=20*1000;// How long we wait for a service to finish executing.staticfinalintSERVICE_BACKGROUND_TIMEOUT=SERVICE_TIMEOUT*10;
//com.android.server.am.ProcessRecordvoidappNotResponding(String activityShortComponentName,ApplicationInfo aInfo,String parentShortComponentName,WindowProcessController parentProcess,boolean aboveSystem,String annotation){//收集需要dump堆栈的进程id,分为firstPids、lastPids和nativeProcsArrayList<Integer> firstPids =newArrayList<>(5);SparseArray<Boolean> lastPids =newSparseArray<>(20);synchronized(mService){...// In case we come through here for the same app before completing// this one, mark as anring now so we will bail out.setNotResponding(true);// Dump thread traces as quickly as we can, starting with "interesting" processes.
firstPids.add(pid);// Don't dump other PIDs if it's a background ANRif(!isSilentAnr()){int parentPid = pid;if(parentProcess !=null&& parentProcess.getPid()>0){
parentPid = parentProcess.getPid();}if(parentPid != pid) firstPids.add(parentPid);if(MY_PID!= pid &&MY_PID!= parentPid) firstPids.add(MY_PID);for(int i =getLruProcessList().size()-1; i >=0; i--){ProcessRecord r =getLruProcessList().get(i);if(r !=null&& r.thread !=null){int myPid = r.pid;if(myPid >0&& myPid != pid && myPid != parentPid && myPid !=MY_PID){if(r.isPersistent()){
firstPids.add(myPid);if(DEBUG_ANR)Slog.i(TAG,"Adding persistent proc: "+ r);}elseif(r.treatLikeActivity){
firstPids.add(myPid);if(DEBUG_ANR)Slog.i(TAG,"Adding likely IME: "+ r);}else{
lastPids.put(myPid,Boolean.TRUE);if(DEBUG_ANR)Slog.i(TAG,"Adding ANR proc: "+ r);}}}}}}//开始组装logcat日志// Log the ANR to the main log.StringBuilder info =newStringBuilder();
info.setLength(0);
info.append("ANR in ").append(processName);if(activityShortComponentName !=null){
info.append(" (").append(activityShortComponentName).append(")");}
info.append("\n");
info.append("PID: ").append(pid).append("\n");if(annotation !=null){
info.append("Reason: ").append(annotation).append("\n");}if(parentShortComponentName !=null&& parentShortComponentName.equals(activityShortComponentName)){
info.append("Parent: ").append(parentShortComponentName).append("\n");}ProcessCpuTracker processCpuTracker =newProcessCpuTracker(true);//收集需要dump的native进程id// don't dump native PIDs for background ANRs unless it is the process of interestString[] nativeProcs =null;if(isSilentAnr()){for(int i =0; i <NATIVE_STACKS_OF_INTEREST.length; i++){if(NATIVE_STACKS_OF_INTEREST[i].equals(processName)){
nativeProcs =newString[]{ processName };break;}}}else{
nativeProcs =NATIVE_STACKS_OF_INTEREST;}int[] pids = nativeProcs ==null?null:Process.getPidsForCommands(nativeProcs);ArrayList<Integer> nativePids =null;if(pids !=null){
nativePids =newArrayList<>(pids.length);for(int i : pids){
nativePids.add(i);}}//重点:开始dump堆栈// For background ANRs, don't pass the ProcessCpuTracker to// avoid spending 1/2 second collecting stats to rank lastPids.File tracesFile =ActivityManagerService.dumpStackTraces(firstPids,(isSilentAnr())?null: processCpuTracker,(isSilentAnr())?null: lastPids,
nativePids);String cpuInfo =null;if(isMonitorCpuUsage()){
mService.updateCpuStatsNow();synchronized(mService.mProcessCpuTracker){
cpuInfo = mService.mProcessCpuTracker.printCurrentState(anrTime);}
info.append(processCpuTracker.printCurrentLoad());
info.append(cpuInfo);}
info.append(processCpuTracker.printCurrentState(anrTime));//输出日志到LogcatSlog.e(TAG, info.toString());if(tracesFile ==null){// There is no trace file, so dump (only) the alleged culprit's threads to the logProcess.sendSignal(pid,Process.SIGNAL_QUIT);}synchronized(mService){...//后台进程直接杀死,不弹ANRif(isSilentAnr()&&!isDebugging()){kill("bg anr",true);return;}//给app进程设置一个ANR状态// Set the app's notResponding state, and look up the errorReportReceivermakeAppNotRespondingLocked(activityShortComponentName,
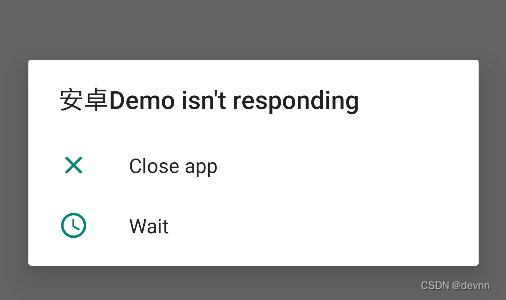
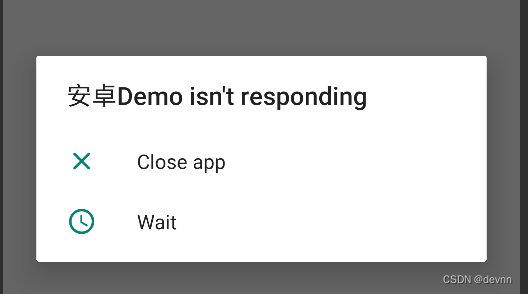
annotation !=null?"ANR "+ annotation :"ANR", info.toString());// mUiHandler can be null if the AMS is constructed with injector only. This will only// happen in tests.//开始弹出ANR弹窗if(mService.mUiHandler !=null){// Bring up the infamous App Not Responding dialogMessage msg =Message.obtain();
msg.what =ActivityManagerService.SHOW_NOT_RESPONDING_UI_MSG;
msg.obj =newAppNotRespondingDialog.Data(this, aInfo, aboveSystem);
mService.mUiHandler.sendMessage(msg);}}}
//com.android.server.am.ActivityManagerServicepublicstaticFiledumpStackTraces(ArrayList<Integer> firstPids,ProcessCpuTracker processCpuTracker,SparseArray<Boolean> lastPids,ArrayList<Integer> nativePids){ArrayList<Integer> extraPids =null;Slog.i(TAG,"dumpStackTraces pids="+ lastPids +" nativepids="+ nativePids);// Measure CPU usage as soon as we're called in order to get a realistic sampling// of the top users at the time of the request.if(processCpuTracker !=null){
processCpuTracker.init();try{Thread.sleep(200);}catch(InterruptedException ignored){}
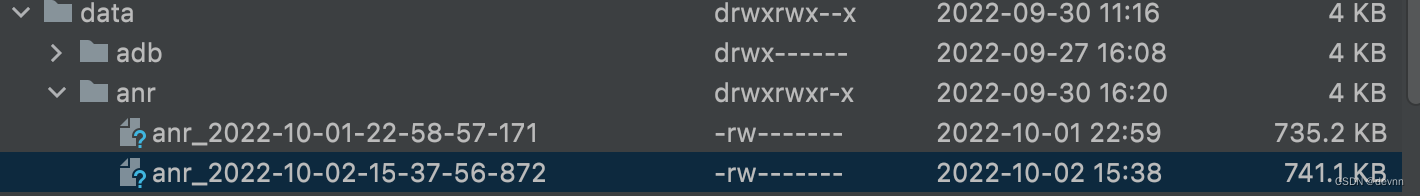
processCpuTracker.update();...//创建ANR的输出文件:ANR_TRACE_DIR = "/data/anr";finalFile tracesDir =newFile(ANR_TRACE_DIR);// Each set of ANR traces is written to a separate file and dumpstate will process// all such files and add them to a captured bug report if they're recent enough.maybePruneOldTraces(tracesDir);// NOTE: We should consider creating the file in native code atomically once we've// gotten rid of the old scheme of dumping and lot of the code that deals with paths// can be removed.File tracesFile =createAnrDumpFile(tracesDir);if(tracesFile ==null){returnnull;}//文件创建完毕,开始dumpdumpStackTraces(tracesFile.getAbsolutePath(), firstPids, nativePids, extraPids);return tracesFile;}
ActivityManagerService.dumpStackTraces:
//com.android.server.am.ActivityManagerServicepublicstaticvoiddumpStackTraces(String tracesFile,ArrayList<Integer> firstPids,ArrayList<Integer> nativePids,ArrayList<Integer> extraPids){Slog.i(TAG,"Dumping to "+ tracesFile);// We don't need any sort of inotify based monitoring when we're dumping traces via// tombstoned. Data is piped to an "intercept" FD installed in tombstoned so we're in full// control of all writes to the file in question.// We must complete all stack dumps within 20 seconds.long remainingTime =20*1000;// First collect all of the stacks of the most important pids.if(firstPids !=null){int num = firstPids.size();for(int i =0; i < num; i++){Slog.i(TAG,"Collecting stacks for pid "+ firstPids.get(i));finallong timeTaken =dumpJavaTracesTombstoned(firstPids.get(i), tracesFile,
remainingTime);
remainingTime -= timeTaken;if(remainingTime <=0){Slog.e(TAG,"Aborting stack trace dump (current firstPid="+ firstPids.get(i)+"); deadline exceeded.");return;}if(DEBUG_ANR){Slog.d(TAG,"Done with pid "+ firstPids.get(i)+" in "+ timeTaken +"ms");}}}// Next collect the stacks of the native pidsif(nativePids !=null){for(int pid : nativePids){Slog.i(TAG,"Collecting stacks for native pid "+ pid);finallong nativeDumpTimeoutMs =Math.min(NATIVE_DUMP_TIMEOUT_MS, remainingTime);finallong start =SystemClock.elapsedRealtime();Debug.dumpNativeBacktraceToFileTimeout(
pid, tracesFile,(int)(nativeDumpTimeoutMs /1000));finallong timeTaken =SystemClock.elapsedRealtime()- start;
remainingTime -= timeTaken;if(remainingTime <=0){Slog.e(TAG,"Aborting stack trace dump (current native pid="+ pid +"); deadline exceeded.");return;}if(DEBUG_ANR){Slog.d(TAG,"Done with native pid "+ pid +" in "+ timeTaken +"ms");}}}// Lastly, dump stacks for all extra PIDs from the CPU tracker.if(extraPids !=null){for(int pid : extraPids){Slog.i(TAG,"Collecting stacks for extra pid "+ pid);finallong timeTaken =dumpJavaTracesTombstoned(pid, tracesFile, remainingTime);
remainingTime -= timeTaken;if(remainingTime <=0){Slog.e(TAG,"Aborting stack trace dump (current extra pid="+ pid +"); deadline exceeded.");return;}if(DEBUG_ANR){Slog.d(TAG,"Done with extra pid "+ pid +" in "+ timeTaken +"ms");}}}Slog.i(TAG,"Done dumping");}
/**
* Dump java traces for process {@code pid} to the specified file. If java trace dumping
* fails, a native backtrace is attempted. Note that the timeout {@code timeoutMs} only applies
* to the java section of the trace, a further {@code NATIVE_DUMP_TIMEOUT_MS} might be spent
* attempting to obtain native traces in the case of a failure. Returns the total time spent
* capturing traces.
*/privatestaticlongdumpJavaTracesTombstoned(int pid,String fileName,long timeoutMs){finallong timeStart =SystemClock.elapsedRealtime();boolean javaSuccess =Debug.dumpJavaBacktraceToFileTimeout(pid, fileName,(int)(timeoutMs /1000));if(javaSuccess){// Check that something is in the file, actually. Try-catch should not be necessary,// but better safe than sorry.try{long size =newFile(fileName).length();if(size <JAVA_DUMP_MINIMUM_SIZE){Slog.w(TAG,"Successfully created Java ANR file is empty!");
javaSuccess =false;}}catch(Exception e){Slog.w(TAG,"Unable to get ANR file size", e);
javaSuccess =false;}}if(!javaSuccess){Slog.w(TAG,"Dumping Java threads failed, initiating native stack dump.");if(!Debug.dumpNativeBacktraceToFileTimeout(pid, fileName,(NATIVE_DUMP_TIMEOUT_MS/1000))){Slog.w(TAG,"Native stack dump failed!");}}returnSystemClock.elapsedRealtime()- timeStart;}
又调用了 Debug.dumpJavaBacktraceToFileTimeout处理dump。
看下Debug类:
//android.os.Debug/**
* Append the Java stack traces of a given native process to a specified file.
*
* @param pid pid to dump.
* @param file path of file to append dump to.
* @param timeoutSecs time to wait in seconds, or 0 to wait forever.
* @hide
*/publicstaticnativebooleandumpJavaBacktraceToFileTimeout(int pid,String file,int timeoutSecs);/**
* Append the native stack traces of a given process to a specified file.
*
* @param pid pid to dump.
* @param file path of file to append dump to.
* @param timeoutSecs time to wait in seconds, or 0 to wait forever.
* @hide
*/publicstaticnativebooleandumpNativeBacktraceToFileTimeout(int pid,String file,int timeoutSecs);
void*SignalCatcher::Run(void* arg){
SignalCatcher* signal_catcher =reinterpret_cast<SignalCatcher*>(arg);...// Set up mask with signals we want to handle.
SignalSet signals;
signals.Add(SIGQUIT);
signals.Add(SIGUSR1);while(true){int signal_number = signal_catcher->WaitForSignal(self, signals);if(signal_catcher->ShouldHalt()){
runtime->DetachCurrentThread();returnnullptr;}switch(signal_number){case SIGQUIT:
signal_catcher->HandleSigQuit();break;case SIGUSR1:
signal_catcher->HandleSigUsr1();break;default:LOG(ERROR)<<"Unexpected signal %d"<< signal_number;break;}}}
监听到SIGQUIT信号后交给了HandleSigQuit函数处理:
voidSignalCatcher::HandleSigQuit(){
Runtime* runtime =Runtime::Current();
std::ostringstream os;
os <<"\n"<<"----- pid "<<getpid()<<" at "<<GetIsoDate()<<" -----\n";DumpCmdLine(os);// Note: The strings "Build fingerprint:" and "ABI:" are chosen to match the format used by// debuggerd. This allows, for example, the stack tool to work.
std::string fingerprint = runtime->GetFingerprint();
os <<"Build fingerprint: '"<<(fingerprint.empty()?"unknown": fingerprint)<<"'\n";
os <<"ABI: '"<<GetInstructionSetString(runtime->GetInstructionSet())<<"'\n";
os <<"Build type: "<<(kIsDebugBuild ?"debug":"optimized")<<"\n";
runtime->DumpForSigQuit(os);if((false)){
std::string maps;if(android::base::ReadFileToString("/proc/self/maps",&maps)){
os <<"/proc/self/maps:\n"<< maps;}}
os <<"----- end "<<getpid()<<" -----\n";Output(os.str());}
voidRuntime::DumpForSigQuit(std::ostream& os){// Print backtraces first since they are important do diagnose ANRs,// and ANRs can often be trimmed to limit upload size.
thread_list_->DumpForSigQuit(os);GetClassLinker()->DumpForSigQuit(os);GetInternTable()->DumpForSigQuit(os);GetJavaVM()->DumpForSigQuit(os);GetHeap()->DumpForSigQuit(os);
oat_file_manager_->DumpForSigQuit(os);if(GetJit()!=nullptr){GetJit()->DumpForSigQuit(os);}else{
os <<"Running non JIT\n";}DumpDeoptimizations(os);TrackedAllocators::Dump(os);GetMetrics()->DumpForSigQuit(os);
os <<"\n";BaseMutex::DumpAll(os);// Inform anyone else who is interested in SigQuit.{
ScopedObjectAccess soa(Thread::Current());
callbacks_->SigQuit();}}
class AnrTestActivity :AppCompatActivity(){overridefunonCreate(savedInstanceState: Bundle?){super.onCreate(savedInstanceState)setContentView(R.layout.activity_anr_test)this.findViewById<Button>(R.id.button).setOnClickListener{
SystemClock.sleep(10000)}}
连续点击两次,5s之后会弹出ANR弹窗。 Logcat输出日志如下:
2022-10-02 15:38:00.505 594-5381/system_process E/ActivityManager: ANR in com.devnn.demo (com.devnn.demo/.AnrTestActivity)
PID: 5232
Reason: Input dispatching timed out (f99e8bb com.devnn.demo/com.devnn.demo.AnrTestActivity (server) is not responding. Waited 5008ms for MotionEvent(deviceId=8, source=0x00005002, displayId=0, action=DOWN, actionButton=0x00000000, flags=0x00000000, metaState=0x00000000, buttonState=0x00000000, classification=NONE, edgeFlags=0x00000000, xPrecision=22.8, yPrecision=12.8, xCursorPosition=nan, yCursorPosition=nan, pointers=[0: (804.9, 1173.9)]), policyFlags=0x62000000)
Parent: com.devnn.demo/.AnrTestActivity
Load: 0.05 / 0.01 / 0.0
----- Output from /proc/pressure/memory -----
some avg10=0.00avg60=0.00avg300=0.00total=0
full avg10=0.00avg60=0.00avg300=0.00total=0
----- End output from /proc/pressure/memory -----
CPU usage from 158257ms to 0ms ago (2022-10-02 15:35:18.256 to 2022-10-02 15:37:56.513):
6.2% 279/android.hardware.bluetooth@1.1-service.sim: 0.3% user + 5.9% kernel
2.2% 292/android.hardware.graphics.composer@2.3-service: 0% user + 2.1% kernel
1.6% 594/system_server: 0.3% user + 1.3% kernel / faults: 1085 minor
1.4% 300/android.hardware.sensors@2.1-service.multihal: 0% user + 1.4% kernel
0.4% 277/android.hardware.audio.service.ranchu: 0% user + 0.4% kernel / faults: 10 minor
0.2% 371/audioserver: 0% user + 0.2% kernel / faults: 4 minor
0.2% 5232/com.devnn.demo: 0% user + 0.2% kernel / faults: 272 minor
0.2% 318/surfaceflinger: 0% user + 0.2% kernel
0% 16/ksoftirqd/1: 0% user + 0% kernel
0% 365/adbd: 0% user + 0% kernel
0% 477/llkd: 0% user + 0% kernel
0% 872/android.hardware.gnss@2.0-service.ranchu: 0% user + 0% kernel
0% 10/rcu_preempt: 0% user + 0% kernel
0% 2014/com.android.systemui: 0% user + 0% kernel / faults: 39 minor
0% 9/ksoftirqd/0: 0% user + 0% kernel
0% 1002/com.android.phone: 0% user + 0% kernel / faults: 100 minor
0% 3645/kworker/0:2-events_power_efficient: 0% user + 0% kernel
0% 157/logd: 0% user + 0% kernel
0% 427/libgoldfish-rild: 0% user + 0% kernel / faults: 16 minor
0% 3270/kworker/1:1-mm_percpu_wq: 0% user + 0% kernel
0% 159/servicemanager: 0% user + 0% kernel
0% 160/hwservicemanager: 0% user + 0% kernel
0% 478/hostapd_nohidl: 0% user + 0% kernel
0% 5346/kworker/u4:0-events_unbound: 0% user + 0% kernel
0% 11/migration/0: 0% user + 0% kernel
0% 15/migration/1: 0% user + 0% kernel
0% 164/qemu-props: 0% user + 0% kernel
0% 188/jbd2/dm-5-8: 0% user + 0% kernel
0% 269/statsd: 0% user + 0% kernel
0% 342/logcat: 0% user + 0% kernel
0% 418/media.metrics: 0% user + 0% kernel / faults: 1 minor
0% 442/android.hardware.biometrics.fingerprint@2.1-service: 0% user + 0% kernel
0% 761/wpa_supplicant: 0% user + 0% kernel
0% 3615/logcat: 0% user + 0% kernel
0% 5068/kworker/u4:1-phy0: 0% user + 0% kernel
1.9% TOTAL: 0.1% user + 1.7% kernel + 0% softirq
CPU usage from 20ms to 335ms later (2022-10-02 15:37:56.533 to 2022-10-02 15:37:56.848):
22% 594/system_server: 15% user + 7.5% kernel / faults: 161 minor
22% 5381/AnrConsumer: 7.5% user + 15% kernel
6.9% 279/android.hardware.bluetooth@1.1-service.sim: 0% user + 6.9% kernel
6.9% 1215/bluetooth@1.1-s: 0% user + 6.9% kernel
3.5% 292/android.hardware.graphics.composer@2.3-service: 0% user + 3.5% kernel
18% TOTAL: 8.6% user + 10% kernel
"main"prio=5tid=1 Sleeping
|group="main"sCount=1dsCount=0flags=1obj=0x71fb36a8 self=0x7fada5a477b0
|sysTid=5232nice=-10 cgrp=top-app sched=0/0 handle=0x7faecb97d4f8
|state=S schedstat=(57753170774230577099871)utm=286stm=291core=0HZ=100|stack=0x7ffc29566000-0x7ffc29568000 stackSize=8192KB
| held mutexes=
at java.lang.Thread.sleep(Native method)
- sleeping on <0x06059c02>(a java.lang.Object)
at java.lang.Thread.sleep(Thread.java:442)
- locked <0x06059c02>(a java.lang.Object)
at java.lang.Thread.sleep(Thread.java:358)
at android.os.SystemClock.sleep(SystemClock.java:131)
at com.devnn.demo.AnrTestActivity.onCreate$lambda-0(AnrTestActivity.kt:17)
at com.devnn.demo.AnrTestActivity.lambda$UpadNwrDNzrVyNaTI0ysWoH569M(AnrTestActivity.kt:-1)
at com.devnn.demo.-$$Lambda$AnrTestActivity$UpadNwrDNzrVyNaTI0ysWoH569M.onClick(lambda:-1)
at android.view.View.performClick(View.java:7448)
at android.view.View.performClickInternal(View.java:7425)
2022-10-02 16:30:14.001 594-5956/system_process E/ActivityManager: ANR in com.devnn.demo (com.devnn.demo/.AnrTestActivity)
PID: 5906
Reason: Input dispatching timed out (1313584 com.devnn.demo/com.devnn.demo.AnrTestActivity (server) is not responding. Waited 5007ms for MotionEvent(deviceId=8, source=0x00005002, displayId=0, action=DOWN, actionButton=0x00000000, flags=0x00000000, metaState=0x00000000, buttonState=0x00000000, classification=NONE, edgeFlags=0x00000000, xPrecision=22.8, yPrecision=12.8, xCursorPosition=nan, yCursorPosition=nan, pointers=[0: (721.0, 1641.9)]), policyFlags=0x62000000)
Parent: com.devnn.demo/.AnrTestActivity
Load: 0.8 / 0.67 / 0.39
----- Output from /proc/pressure/memory -----
some avg10=0.00avg60=0.00avg300=0.00total=0
full avg10=0.00avg60=0.00avg300=0.00total=0
----- End output from /proc/pressure/memory -----
CPU usage from 285508ms to 0ms ago (2022-10-02 16:25:25.779 to 2022-10-02 16:30:11.287):
8.1% 279/android.hardware.bluetooth@1.1-service.sim: 0.6% user + 7.4% kernel
4.4% 292/android.hardware.graphics.composer@2.3-service: 0.3% user + 4.1% kernel
4.3% 594/system_server: 1.4% user + 2.8% kernel / faults: 19536 minor
2.8% 318/surfaceflinger: 0.3% user + 2.4% kernel / faults: 871 minor
2% 300/android.hardware.sensors@2.1-service.multihal: 0% user + 1.9% kernel
0.5% 2014/com.android.systemui: 0% user + 0.5% kernel / faults: 4342 minor
0.4% 365/adbd: 0% user + 0.4% kernel / faults: 946 minor
0.2% 1152/com.android.launcher3: 0% user + 0.2% kernel / faults: 50 minor
0.2% 157/logd: 0% user + 0.2% kernel / faults: 13 minor
0.2% 277/android.hardware.audio.service.ranchu: 0% user + 0.1% kernel / faults: 5 minor
0.2% 10/rcu_preempt: 0% user + 0.2% kernel
0.1% 1002/com.android.phone: 0% user + 0% kernel / faults: 1267 minor
Logat里看不出具体原因,所以要看trace文件。
----- pid 5906 at 2022-10-02 16:30:11 -----
Cmd line: com.devnn.demo
Build fingerprint: 'Android/sdk_phone_x86_64/generic_x86_64:11/RSR1.210722.012/7758210:userdebug/test-keys'
ABI: 'x86_64'
Build type: optimized
...省略无关内容
"main"prio=5tid=1 Blocked
|group="main"sCount=1dsCount=0flags=1obj=0x71fb36a8 self=0x7fada5a477b0
|sysTid=5906nice=-10 cgrp=top-app sched=0/0 handle=0x7faecb97d4f8
|state=S schedstat=(27928138042053378730782)utm=161stm=117core=0HZ=100|stack=0x7ffc29566000-0x7ffc29568000 stackSize=8192KB
| held mutexes=
at com.devnn.demo.AnrTestActivity.clickTest(AnrTestActivity.kt:48)
- waiting to lock <0x026f6b14>(a java.lang.Object) held by thread 2
- locked <0x0188dfbd>(a java.lang.Object)
at com.devnn.demo.AnrTestActivity.onCreate$lambda-1(AnrTestActivity.kt:21)
at com.devnn.demo.AnrTestActivity.lambda$W1-GSjdjbC-dtyUoueoTRdjL4Es(AnrTestActivity.kt:-1)
at com.devnn.demo.-$$Lambda$AnrTestActivity$W1-GSjdjbC-dtyUoueoTRdjL4Es.onClick(lambda:-1)
at android.view.View.performClick(View.java:7448)
at android.view.View.performClickInternal(View.java:7425)
at android.view.View.access$3600(View.java:810)
at android.view.View$PerformClick.run(View.java:28305)
at android.os.Handler.handleCallback(Handler.java:938)
at android.os.Handler.dispatchMessage(Handler.java:99)
at android.os.Looper.loop(Looper.java:223)
at android.app.ActivityThread.main(ActivityThread.java:7656)
at java.lang.reflect.Method.invoke(Native method)
at com.android.internal.os.RuntimeInit$MethodAndArgsCaller.run(RuntimeInit.java:592)
at com.android.internal.os.ZygoteInit.main(ZygoteInit.java:947)
可以看到主线程状态是Bocked(阻塞)。
waiting to lock <0x026f6b14>(a java.lang.Object) held by thread 2
- locked <0x0188dfbd>(a java.lang.Object)
"Thread-5"prio=5tid=2 Blocked
|group="main"sCount=1dsCount=0flags=1obj=0x12db7fc0 self=0x7fada5a55630
|sysTid=5953nice=0cgrp=top-app sched=0/0 handle=0x7fabdc49fcf0
|state=S schedstat=(1560220174771593)utm=0stm=0core=0HZ=100|stack=0x7fabdc39c000-0x7fabdc39e000 stackSize=1043KB
| held mutexes=
at com.devnn.demo.AnrTestActivity.clickTest$lambda-4(AnrTestActivity.kt:39)
- waiting to lock <0x0188dfbd>(a java.lang.Object) held by thread 1
- locked <0x026f6b14>(a java.lang.Object)
at com.devnn.demo.AnrTestActivity.lambda$A4lEoLZVf4n-xUBZSqj2v3ihIqw(AnrTestActivity.kt:-1)
at com.devnn.demo.-$$Lambda$AnrTestActivity$A4lEoLZVf4n-xUBZSqj2v3ihIqw.run(lambda:-1)
at java.lang.Thread.run(Thread.java:923)
//java.lang.ThreadpublicclassThreadimplementsRunnable{publicenumState{/**
* Thread state for a thread which has not yet started.
*/NEW,/**
* Thread state for a runnable thread. A thread in the runnable
* state is executing in the Java virtual machine but it may
* be waiting for other resources from the operating system
* such as processor.
*/RUNNABLE,/**
* Thread state for a thread blocked waiting for a monitor lock.
* A thread in the blocked state is waiting for a monitor lock
* to enter a synchronized block/method or
* reenter a synchronized block/method after calling
* {@link Object#wait() Object.wait}.
*/BLOCKED,/**
* Thread state for a waiting thread.
* A thread is in the waiting state due to calling one of the
* following methods:
* <ul>
* <li>{@link Object#wait() Object.wait} with no timeout</li>
* <li>{@link #join() Thread.join} with no timeout</li>
* <li>{@link LockSupport#park() LockSupport.park}</li>
* </ul>
*
* <p>A thread in the waiting state is waiting for another thread to
* perform a particular action.
*
* For example, a thread that has called <tt>Object.wait()</tt>
* on an object is waiting for another thread to call
* <tt>Object.notify()</tt> or <tt>Object.notifyAll()</tt> on
* that object. A thread that has called <tt>Thread.join()</tt>
* is waiting for a specified thread to terminate.
*/WAITING,/**
* Thread state for a waiting thread with a specified waiting time.
* A thread is in the timed waiting state due to calling one of
* the following methods with a specified positive waiting time:
* <ul>
* <li>{@link #sleep Thread.sleep}</li>
* <li>{@link Object#wait(long) Object.wait} with timeout</li>
* <li>{@link #join(long) Thread.join} with timeout</li>
* <li>{@link LockSupport#parkNanos LockSupport.parkNanos}</li>
* <li>{@link LockSupport#parkUntil LockSupport.parkUntil}</li>
* </ul>
*/TIMED_WAITING,/**
* Thread state for a terminated thread.
* The thread has completed execution.
*/TERMINATED;}}
在VMThread中有它们的对应关系:
//VMThread.java/**
* Holds a mapping from native Thread statuses to Java one. Required for
* translating back the result of getStatus().
*/staticfinalThread.State[]STATE_MAP=newThread.State[]{Thread.State.TERMINATED,// ZOMBIEThread.State.RUNNABLE,// RUNNINGThread.State.TIMED_WAITING,// TIMED_WAITThread.State.BLOCKED,// MONITORThread.State.WAITING,// WAITThread.State.NEW,// INITIALIZINGThread.State.NEW,// STARTINGThread.State.RUNNABLE,// NATIVEThread.State.WAITING,// VMWAITThread.State.RUNNABLE// SUSPENDED};