一、安装Promtheus
在 Prometheus 官网 Download | Prometheus 获取适用于 Linux 的 Prometheus 安
装包,这里我选择最新的 2.46.0 版本,我是 Linux 系统,选择下载 prometheus-2.46.0.linux-amd64.tar.gz
下载安装包:
wget https://github.com/prometheus/prometheus/releases/download/v2.46.0/prometheus-
2.46.0.linux-amd64.tar.gz

解压安装包
tar zxvf prometheus-2.46.0.linux-amd64.tar.gz

进到解压目录
cd prometheus-2.46.0.linux-amd64/

查看版本信息
./prometheus --version
生成prometheus启动脚本,自行修改目录,我的解压目录是/opt/prometheus-2.46.0.linux-amd64/prometheus
vim /etc/systemd/system/prometheus.service
[Unit]
Description=Prometheus
Documentation=https://prometheus.io/docs/introduction/overview/
Wants=network-online.target
After=network-online.target

[Service]
ExecStart=/opt/prometheus-2.46.0.linux-amd64/prometheus \
  --config.file=/opt/prometheus-2.46.0.linux-amd64/prometheus.yml \
  --storage.tsdb.path=/opt/prometheus-2.46.0.linux-amd64/data
ExecReload=/bin/kill -HUP $MAINPID
TimeoutStopSec=20s
Restart=always

[Install]
WantedBy=default.target
systemctl daemon-reload
systemctl enable prometheus
systemctl start prometheus
systemctl status prometheus

访问
http://IP:9090/targets
进行确认

二、安装Blackbox_expoter
下载地址:
Releases · prometheus/blackbox_exporter · GitHub
tar zxvf blackbox_exporter-0.24.0.linux-amd64.tar.gz -C /usr/local/
vim /etc/systemd/system/blackbox_exporter.service
[Unit]
Description=Blackbox Exporter
Wants=network-online.target
After=network-online.target

[Service]
ExecStart=/usr/local/blackbox_exporter-0.24.0.linux-amd64/blackbox_exporter \
  --config.file=/usr/local/blackbox_exporter-0.24.0.linux-amd64/blackbox.yml
ExecReload=/bin/kill -HUP $MAINPID
TimeoutStopSec=20s
Restart=always

[Install]
WantedBy=default.target
systemctl daemon-reload
systemctl enable blackbox_exporter
systemctl start blackbox_exporter
systemctl status blackbox_exporter

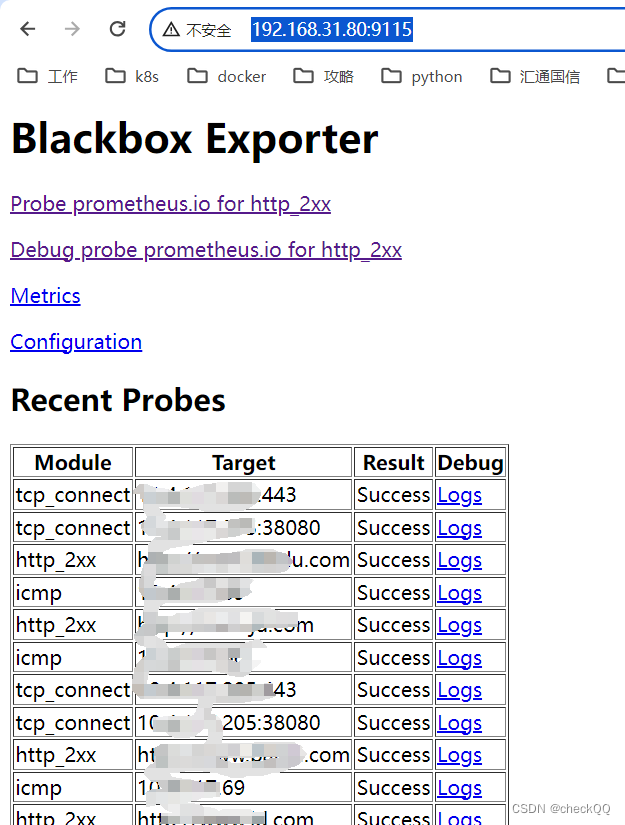
访问IP:9115进行确认
三、安装Grafana
下载地址:
Download Grafana | Grafana Labs
wget
https://dl.grafana.com/oss/release/grafana-10.1.0-1.x86_64.rpm
yum install -y urw-fonts
rpm -ivh grafana-10.1.0-1.x86_64.rpm
数据配置路径,比如数据目录、日志目录、插件目录:/etc/sysconfig/grafana-server
默认的用户名和密码为 admin ,也可以在配置文件 /etc/grafana/grafana.ini中配置 admin_user 和 admin_password 两个参数来进行覆盖。
配置中文界面:
vim /etc/grafana/grafana.ini
default_language = zh-Hans
systemctl daemon-reload
systemctl enable grafana-server.service
systemctl start grafana-server
访问 http:IP:3000 进行确认

四、配置Prometheus
配置prmetheus.yml使用blackbox_exporter
vim /opt/prometheus-2.46.0.linux-amd64/prometheus.yml
检查网站状态,网络状态,与端口存活。
# my global config
global:
  scrape_interval: 15s # Set the scrape interval to every 15 seconds. Default is every 1 minute.
  evaluation_interval: 15s # Evaluate rules every 15 seconds. The default is every 1 minute.
  # scrape_timeout is set to the global default (10s).

# Alertmanager configuration
alerting:
  alertmanagers:
    - static_configs:
        - targets:
          # - alertmanager:9093

# Load rules once and periodically evaluate them according to the global 'evaluation_interval'.
rule_files:
  # - "first_rules.yml"
  # - "second_rules.yml"

# A scrape configuration containing exactly one endpoint to scrape:
# Here it's Prometheus itself.
scrape_configs:
  # The job name is added as a label `job=<job_name>` to any timeseries scraped from this config.
  - job_name: "prometheus"

    # metrics_path defaults to '/metrics'
    # scheme defaults to 'http'.

    static_configs:
      - targets: ["localhost:9090"]

  - job_name: 网站状态
    metrics_path: /probe
    params:
      module: [http_2xx]
    static_configs:
    - targets:
      - http://www.baidu.com
      - http://www.jd.com
      labels:
        group: web
    relabel_configs:
    - source_labels: [__address__]
      target_label: __param_target
    - source_labels: [__param_target]
      target_label: instance
    - target_label: __address__
      replacement: 192.168.31.80:9115


  - job_name: 网络联通性
    metrics_path: /probe
    params:
      module: [icmp]
    static_configs:
    - targets:
      - 10.4.117.66
      - 10.4.117.69
      labels:
        group: icmp
    relabel_configs:
    - source_labels: [__address__]
      target_label: __param_target
    - source_labels: [__param_target]
      target_label: instance
    - target_label: __address__
      replacement: 192.168.31.80:9115

  - job_name: TCP端口状态
    metrics_path: /probe
    params:
      module: [tcp_connect]
    static_configs:
    - targets:
      - 10.4.117.205:443
      - 10.4.117.205:38080
      labels:
        group: tcp-port-status
    relabel_configs:
    - source_labels: [__address__]
      target_label: __param_target
    - source_labels: [__param_target]
      target_label: instance
    - target_label: __address__
      replacement: 192.168.31.80:9115
五、Grafana插件安装
默认仪表盘部分插件没有,示例安装:grafana-piechart-panel
grafana-cli plugins install grafana-piechart-panel
指定插件路径
vim /etc/grafana/grafana.ini
[plugin.piechart]
path = /var/lib/grafana/plugins/grafana-piechart-panel
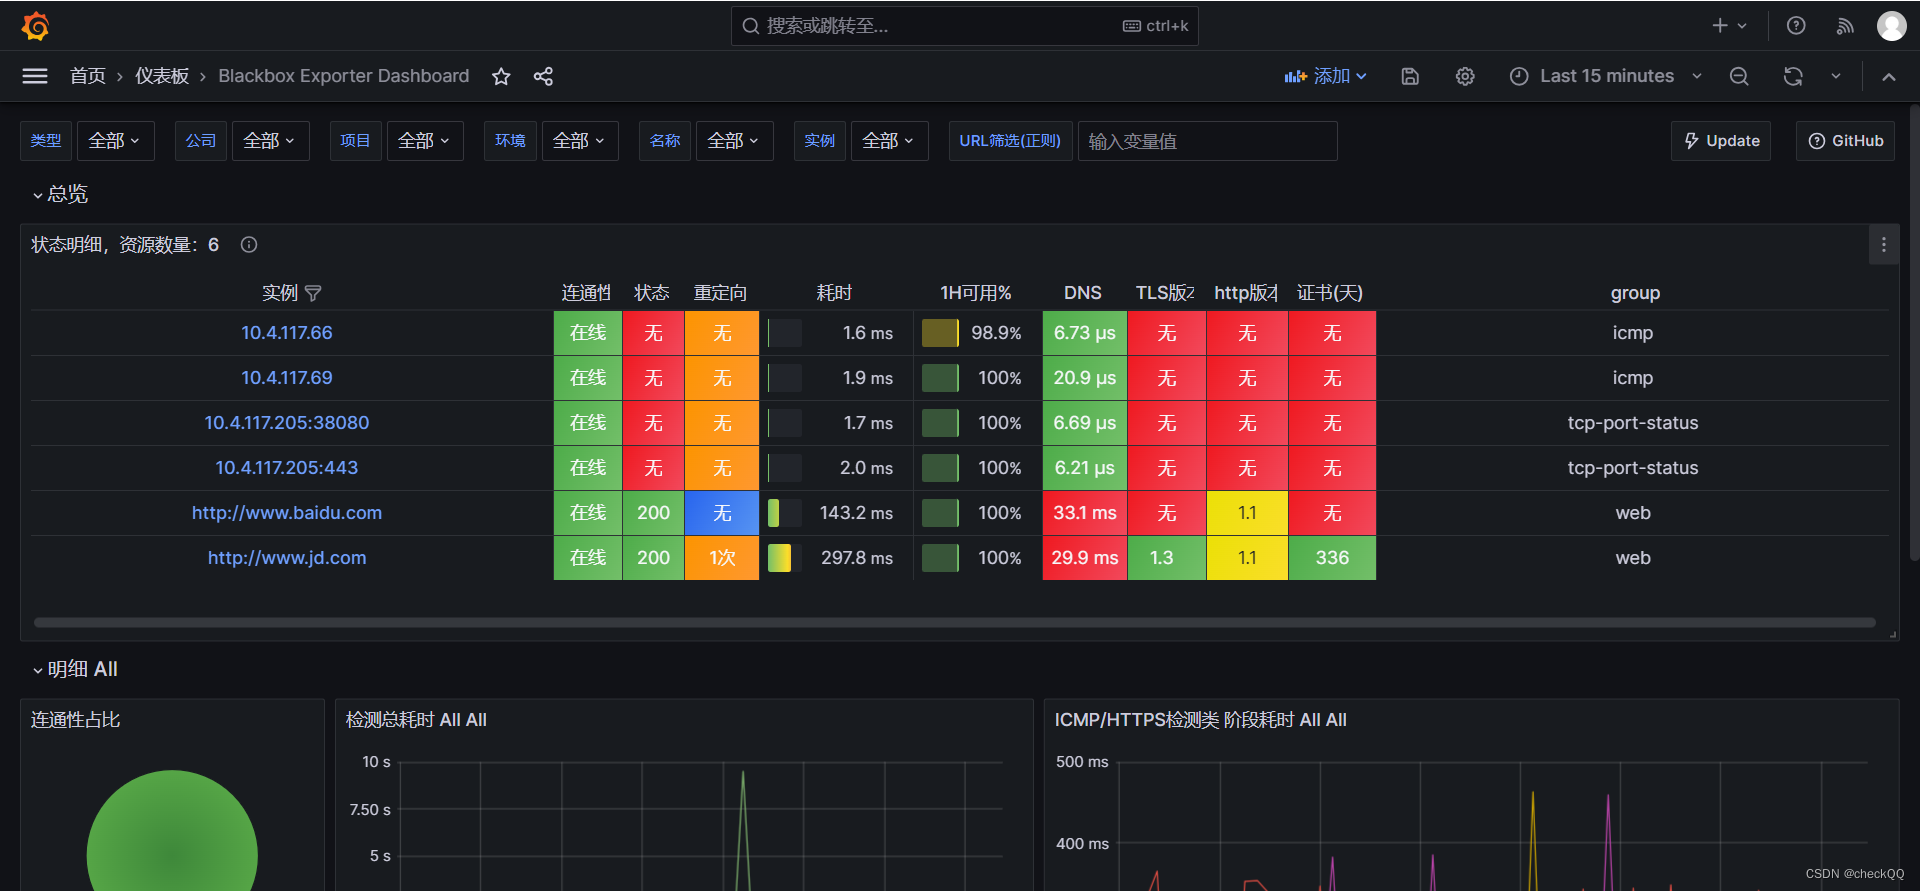
六、Grafana 模板选择
Dashboards | Grafana Labs
模板地址
示例:
模板ID:13659
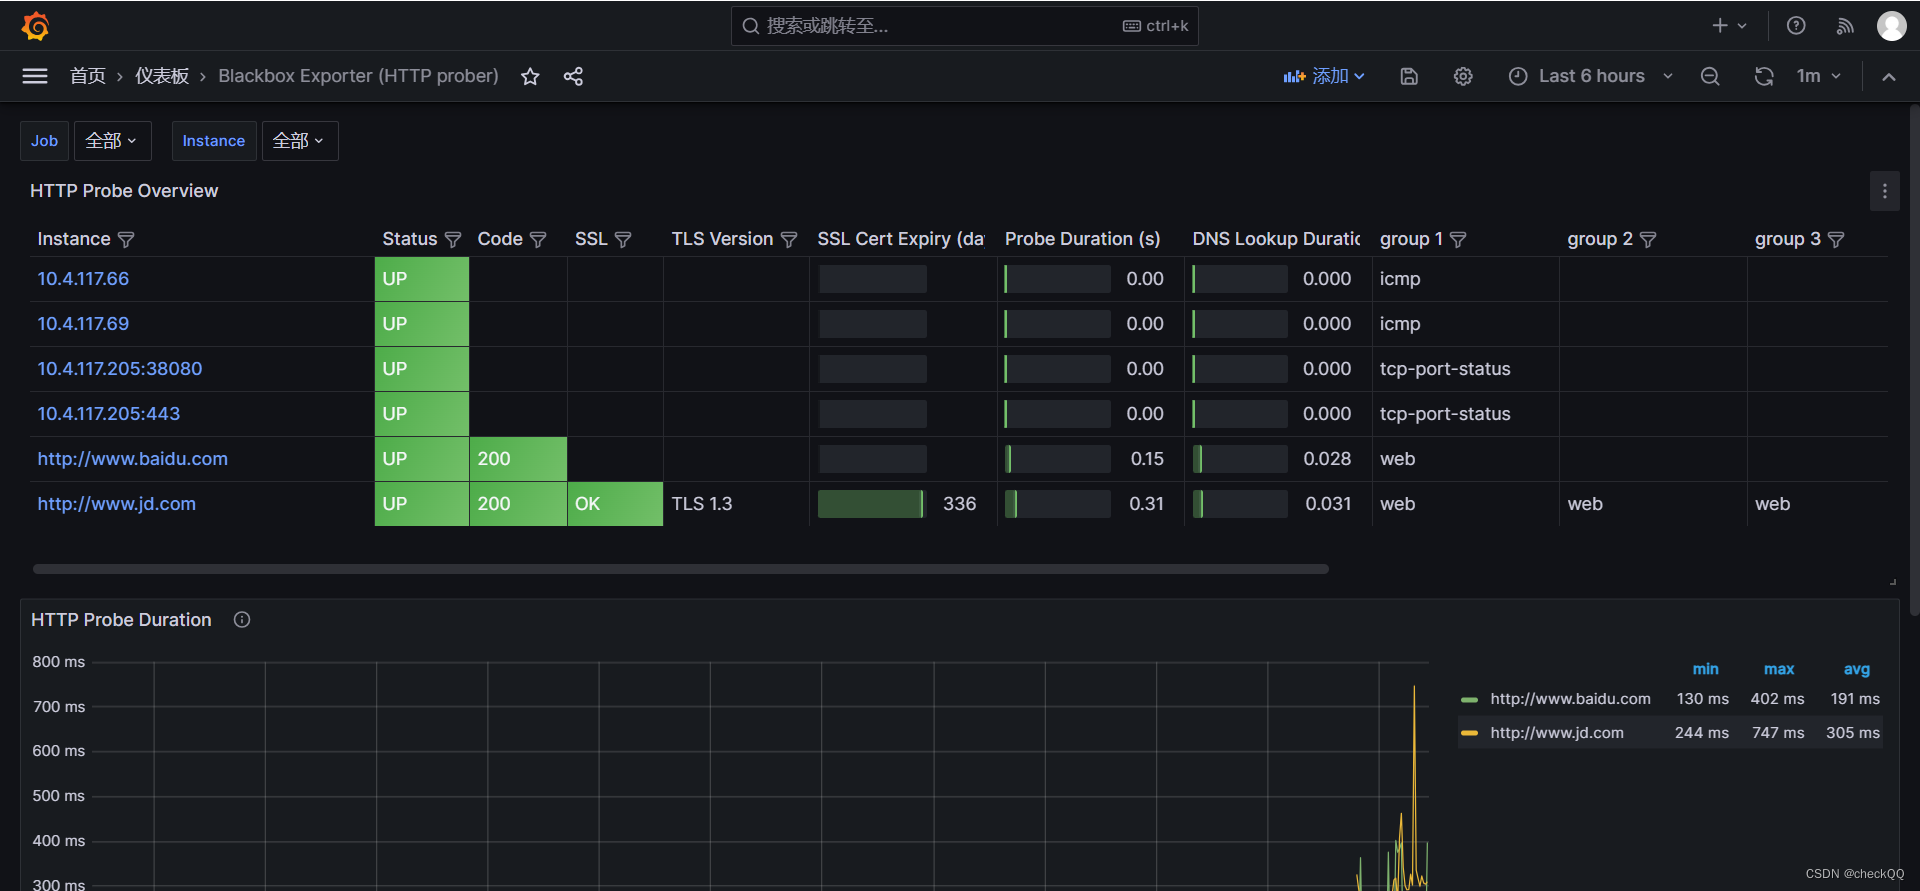
模板ID:9965