文章目录
- 1,创建一个Figure对象
-
- 2,在tkinter窗口中用matplotlib的figure对象画图
-
1,创建一个Figure对象
1.1 Figure对象
https://segmentfault.com/a/1190000006158803
- 在matplotlib中,整个图像为一个Figure对象。在Figure对象中可以包含一个,或者多个Axes对象。每个Axes对象都是一个拥有自己坐标系统的绘图区域。
2,在tkinter窗口中用matplotlib的figure对象画图
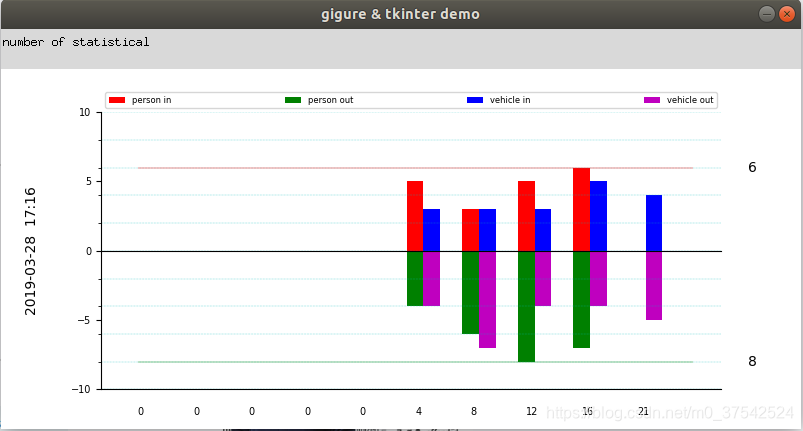
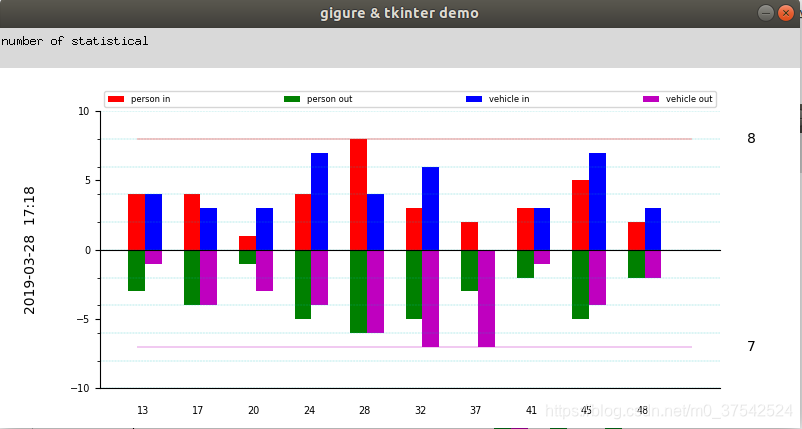
2.1,效果展示
2.2,代码
import numpy as np
import matplotlib.pyplot as plt
from matplotlib.backends.backend_tkagg import FigureCanvasTkAgg
from matplotlib.ticker import MultipleLocator
from matplotlib.figure import Figure
from tkinter import *
import random
import time
class FigurePlot(object):
def __init__(self, root, shape):
self.wnd = root
fig = Figure()
plot_frame = Frame(self.wnd, width=shape[0], height=shape[1], bg='green')
plot_frame.propagate(0)
plot_frame.pack(side=TOP, fill=BOTH)
self.canvas = FigureCanvasTkAgg(fig, master=plot_frame)
self.canvas._tkcanvas.pack(side=TOP, fill=BOTH, expand=1)
self.axis1 = fig.add_subplot(111)
self.axis1.set_ylim((-10,10))
self.axis1.yaxis.set_minor_locator(MultipleLocator(2))
self.axis1.yaxis.set_major_locator(MultipleLocator(5))
self.axis1.tick_params(labelsize=7)
self.axis1.grid(True, which='minor', axis='y', c='c', linestyle='-.',
linewidth=0.2)
self.axis1.get_xaxis().set_visible(False)
self.axis1.spines['right'].set_visible(False)
self.axis1.xaxis.set_ticks_position('top')
self.axis1.spines['top'].set_position(('data', 0))
class CrossLinePlot(object):
def __init__(self):
self.start_time = time.time()
self.count = 0
self.bar_size = 10
self.time_interval = 4
self.p_ab = 0
self.p_ba = 0
self.v_ab = 0
self.v_ba = 0
self.list_xy = []
for i in range(self.bar_size):
data = [i,0,0,0,0,0]
self.list_xy.insert(0, data)
self.index = i
class ShowPlot(object):
def __init__(self, root):
self.cross_plot = CrossLinePlot()
self.wnd = root
def show_statistics(self, p_value, v_value):
self.cross_plot.p_ab += p_value[0]
self.cross_plot.p_ba += p_value[1]
self.cross_plot.v_ab += v_value[0]
self.cross_plot.v_ba += v_value[1]
start_time = self.cross_plot.start_time
time_interval = self.cross_plot.time_interval
bar_size = self.cross_plot.bar_size
bar_width = 0.3
now_time = time.time()
if int((now_time-start_time)/time_interval)-self.cross_plot.count >= 1:
self.cross_plot.count = int((now_time-start_time)/time_interval)
y1 = self.cross_plot.p_ab
y2 = -self.cross_plot.p_ba
y3 = self.cross_plot.v_ab
y4 = -self.cross_plot.v_ba
t = int(now_time-start_time)
self.cross_plot.index += 1
data = [self.cross_plot.index, t, y1, y2, y3, y4]
self.cross_plot.list_xy.insert(0, data)
if len(self.cross_plot.list_xy) > bar_size:
del self.cross_plot.list_xy[bar_size]
self.cross_plot.p_ab = 0
self.cross_plot.p_ba = 0
self.cross_plot.v_ab = 0
self.cross_plot.v_ba = 0
self.wnd.fig_plot.axis1.cla()
a = np.array(self.cross_plot.list_xy)
a = np.transpose(a)
a = a.tolist()
self.wnd.fig_plot.axis1.bar(x=a[0], height=a[2],
color='r', width=bar_width,
label='person in')
self.wnd.fig_plot.axis1.bar(x=a[0], height=a[3],
color='g', width=bar_width,
label='person out')
self.wnd.fig_plot.axis1.bar(x=list(map(lambda n:n+bar_width,a[0])),
height=a[4],
color='b', width=bar_width,
label='vehicle in')
self.wnd.fig_plot.axis1.bar(x=list(map(lambda n:n+bar_width,a[0])),
height=a[5],
color='m', width=bar_width,
label='vehicle out')
self.wnd.fig_plot.axis1.legend(prop={'size':6},
bbox_to_anchor=(0, 1, 1, 0),
ncol=4, loc=3, mode='expand')
in_max = 0
out_max = 0
in_c = 'c'
out_c = 'c'
for x,t,y1,y2,y3,y4 in zip(a[0],a[1],a[2],a[3],a[4],a[5]):
in_max = y1 if y1>y3 and y1>in_max else(
y3 if y3>=y1 and y3>=in_max else in_max)
out_max = y2 if y2<y4 and y2<out_max else(
y4 if y4<=y2 and y4<=out_max else out_max)
in_c = 'r' if in_max==y1 else('b' if in_max==y3 else in_c)
out_c = 'g' if out_max==y2 else('m' if out_max==y4 else out_c)
self.wnd.fig_plot.axis1.text(x, -12, int(t%60), size=7,
ha='left', va='bottom')
self.wnd.fig_plot.axis1.text(x+11, in_max, in_max, ha='left', va='center')
self.wnd.fig_plot.axis1.text(x+11, out_max, -out_max, ha='left', va='center')
self.wnd.fig_plot.axis1.hlines(in_max, x, x+10,
color=in_c, linewidth=0.3)
self.wnd.fig_plot.axis1.hlines(out_max, x, x+10,
color=out_c, linewidth=0.3)
self.wnd.fig_plot.axis1.text(-0.1, 0.5,
time.strftime('%Y-%m-%d %H:%M', time.localtime()),
ha='right', va='center',
rotation='vertical',
transform=self.wnd.fig_plot.axis1.transAxes)
self.wnd.fig_plot.axis1.set_ylim((-10,10))
self.wnd.fig_plot.axis1.xaxis.set_ticks_position('top')
self.wnd.fig_plot.axis1.spines['top'].set_position(('data', 0))
self.wnd.fig_plot.axis1.yaxis.set_minor_locator(MultipleLocator(2))
self.wnd.fig_plot.axis1.yaxis.set_major_locator(MultipleLocator(5))
self.wnd.fig_plot.axis1.grid(True, which='minor', axis='y',
c='c', linestyle='-.',
linewidth=0.2)
self.wnd.fig_plot.canvas.draw()
class RootWindow(object):
def __init__(self, shape, locate):
self.wnd = Tk()
self.wnd.resizable(width=False,height=False)
self.wnd.withdraw()
s_shape = str(shape[0])+'x'+str(shape[1])
s_locate = '+' + str(locate[0]-shape[0]) + '+' + str(locate[1])
self.wnd.geometry(s_shape + s_locate)
self.wnd.title("gigure & tkinter demo")
label_local = (0, 5)
label = Label(self.wnd, text='number of statistical')
label.place(x=label_local[0], y=label_local[1])
fig_frame_shape = (shape[0],shape[1]-40)
fig_frame_local = (0, 40)
fig_frame = Frame(self.wnd, width=fig_frame_shape[0],
height=fig_frame_shape[1])
fig_frame.propagate(0)
fig_frame.place(x=fig_frame_local[0], y=fig_frame_local[1])
self.fig_plot = FigurePlot(fig_frame, fig_frame_shape)
def wnd_update(self):
self.wnd.update()
self.wnd.deiconify()
if __name__ == '__main__':
root = RootWindow((800,400),(500,300))
show_plot = ShowPlot(root)
while True:
a1 = random.randint(0, 4)
time.sleep(0.5)
a2 = random.randint(0, 4)
time.sleep(0.5)
a3 = random.randint(0, 4)
time.sleep(0.5)
a4 = random.randint(0, 4)
time.sleep(0.5)
show_plot.show_statistics((a1, a2), (a3, a4))
root.wnd_update()
root.wnd.mainlop()
本文内容由网友自发贡献,版权归原作者所有,本站不承担相应法律责任。如您发现有涉嫌抄袭侵权的内容,请联系:hwhale#tublm.com(使用前将#替换为@)