matplotlib第一章
matplotlib通常有两种绘图接口:
①显示创建figure和axes
②依赖pyplot自动创建figure和axes,并绘图
matplotlib环境
本文是在jupyter notebook下运行的,使用的matplotlb版本是3.5.1
首先在代码中加入matplotlib的包
import matplotlib.pyplot as plt
import matplotlib as mpl
import numpy as np
另外,如果想知道自己的包版本的话,可以加上
mpl.__version__
第一种绘图接口
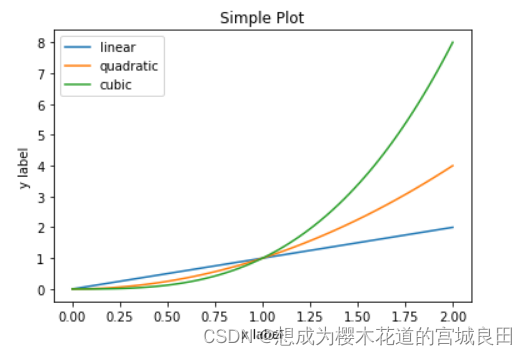
x = np.linspace(0, 2, 100);
ax = plt.subplot(); 显示创建figure和axes
ax.plot(x, x, label = 'linear');
ax.plot(x, x**2, label = 'quadratic');
ax.plot(x, x**3, label = 'cubic');
ax.set_xlabel('x label');
ax.set_ylabel('y label');
ax.set_title("Simple Plot");
ax.legend();
结果如下图所示
在学习过程中遇到一个问题,在上面代码块中第一句,实际的教程应该是
fig, ax = plt.subplot();
但是这种情况,我运行是会报错的,在尝试去掉fig这一参数,能成功运行。原因尚未清楚,希望有大佬解答一下
第二种绘图接口
x = np.linspace(0, 2, 100);
plt.plot(x, x, label = 'linear');
plt.plot(x, x**2, label = 'quadratic');
plt.plot(x, x**3, label = 'cubic');
plt.xlabel('x label');
plt.ylabel('y label');
plt.title("Simple Plot");
plt.legend();
结果与第一种绘图接口一致(横纵坐标都一致)
通用画图模板
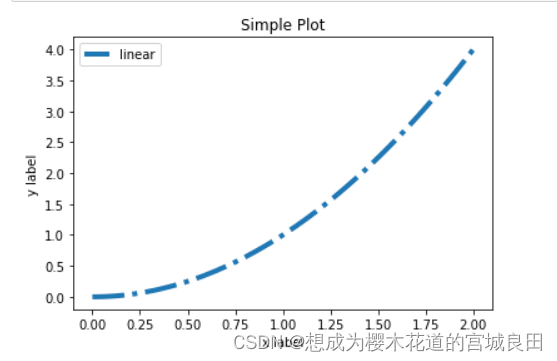
以下给出的是通用的绘图模板,其中一些模块将在后续扩展学习
x = np.linspace(0, 2, 100);
y = x**2;
mpl.rc('lines', linewidth = 4, linestyle = '-.');
fig, ax = plt.subplots();
ax.plot(x, y, label = 'linear');
ax.set_xlabel('x label');
ax.set_ylabel('y label');
ax.set_title("Simple Plot");
ax.legend();
思考题
- 请思考两种绘图模式的优缺点和各自适合的使用场景
第一种绘图模式我认为更适合于学术论文写作需要作图的情况下使用
第二种绘图模式适合调试代码,能快速查看结果的情况下使用 - 在第五节绘图模板中我们是以OO模式作为例子展示的,请思考并写一个pyplot绘图模式的简单模板
x = np.linspace(0, 2, 100);
y = x**2;
mpl.rc('lines', linewidth = 4, linestyle = '-.');
plt.plot(x, y, label = 'linear');
plt.xlabel('x label');
plt.ylabel('y label');
plt.title("Simple Plot");
plt.legend();
总结
两种绘图模式的主要区别在于
第二种绘图接口与第一种不同的是:
①不需要subplot
②xlabel、ylabel、title去掉set前缀
本文内容由网友自发贡献,版权归原作者所有,本站不承担相应法律责任。如您发现有涉嫌抄袭侵权的内容,请联系:hwhale#tublm.com(使用前将#替换为@)