AddressSanitizer (ASan) is an instrumentation tool created by Google security researchers to identify memory access problems in C and C++ programs.
When the source code of a C/C++ application is compiled with AddressSanitizer enabled, the program will be instrumented at runtime to identify and report memory access errors.
But what are memory access errors and how can AddressSanitizer help to identify them?
Memory access errors and AddressSanitizer
C and C++ are very insecure and error-prone languages. And one of the main sources of problems is memory access errors.
Different kind of bugs in the source code could trigger a memory access error, including:
- Buffer overflow or buffer overrun occurs when a program overruns a buffer’s boundary and overwrites adjacent memory locations.
- Stack overflow is when a program crosses the boundary of function’s stack.
- Heap overflow is when a program overruns a buffer allocated in the heap.
- Memory leak is when a program allocates memory but does not deallocate.
- Use after free (dangling pointer) is when a program uses memory regions already deallocated.
- Uninitialized variable is when a program reads a memory location before it is initialized.
All these errors are due to programming bugs. They could prevent the application from executing, cause invalid results or expose a vulnerability that could be exploited by a malicious actor. They are usually very hard to reproduce, debug and fix.
That is why we need tools. And AddressSanitizer is one of them.
AddressSanitizer in a nutshell
AddressSanitizer is implemented through compilation flags. To use AddressSanitizer, we need to compile and link the program using the -fsanitize=address switch.
For example, can you find a memory access error in the C program below?
#include <stdio.h>
#include <string.h>
#include <stdlib.h>

int main(int argc, const char *argv[])
{
    char *msg = "Hello world!";
    char *ptr = NULL;

    ptr = malloc(strlen(msg));

    strcpy(ptr, msg);

    printf("%s\n", ptr);

    return 0;
}
This program compiles without any warning and runs:
$ gcc main.c -o main -Wall -Werror -g
% ./main
Hello world!
But the program has a heap buffer overflow error and AddressSanitizer can identify and report the problem. We just need to compile the program with the -fsanitize=address switch:
$ gcc main.c -o main -Wall -Werror -g -fsanitize=address
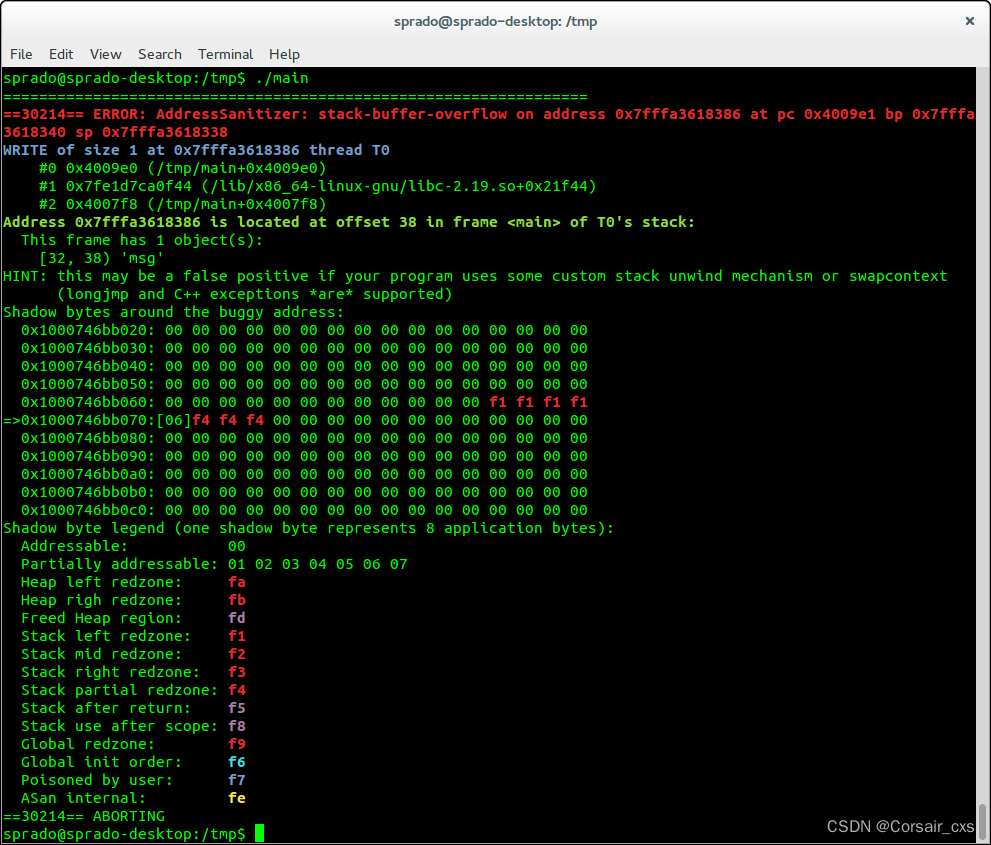
Now, when we run the application, the memory access problem will be identified and a report of the error will be displayed in the terminal:
$ ./main
=================================================================
==30259==ERROR: AddressSanitizer: heap-buffer-overflow on address 0x60200000001c at pc 0x7f64667423a6 bp 0x7ffd069d7380 sp 0x7ffd069d6b28
WRITE of size 13 at 0x60200000001c thread T0
    #0 0x7f64667423a5  (/usr/lib/x86_64-linux-gnu/libasan.so.4+0x663a5)
    #1 0x55934507fa26 in main /home/sprado/Temp/main.c:12
    #2 0x7f646630cb96 in __libc_start_main (/lib/x86_64-linux-gnu/libc.so.6+0x21b96)
    #3 0x55934507f8f9 in _start (/home/sprado/Temp/main+0x8f9)

0x60200000001c is located 0 bytes to the right of 12-byte region [0x602000000010,0x60200000001c)
allocated by thread T0 here:
    #0 0x7f64667bab50 in __interceptor_malloc (/usr/lib/x86_64-linux-gnu/libasan.so.4+0xdeb50)
    #1 0x55934507fa0f in main /home/sprado/Temp/main.c:10
    #2 0x7f646630cb96 in __libc_start_main (/lib/x86_64-linux-gnu/libc.so.6+0x21b96)

SUMMARY: AddressSanitizer: heap-buffer-overflow (/usr/lib/x86_64-linux-gnu/libasan.so.4+0x663a5)
Shadow bytes around the buggy address:
  0x0c047fff7fb0: 00 00 00 00 00 00 00 00 00 00 00 00 00 00 00 00
  0x0c047fff7fc0: 00 00 00 00 00 00 00 00 00 00 00 00 00 00 00 00
  0x0c047fff7fd0: 00 00 00 00 00 00 00 00 00 00 00 00 00 00 00 00
  0x0c047fff7fe0: 00 00 00 00 00 00 00 00 00 00 00 00 00 00 00 00
  0x0c047fff7ff0: 00 00 00 00 00 00 00 00 00 00 00 00 00 00 00 00
=>0x0c047fff8000: fa fa 00[04]fa fa fa fa fa fa fa fa fa fa fa fa
  0x0c047fff8010: fa fa fa fa fa fa fa fa fa fa fa fa fa fa fa fa
  0x0c047fff8020: fa fa fa fa fa fa fa fa fa fa fa fa fa fa fa fa
  0x0c047fff8030: fa fa fa fa fa fa fa fa fa fa fa fa fa fa fa fa
  0x0c047fff8040: fa fa fa fa fa fa fa fa fa fa fa fa fa fa fa fa
  0x0c047fff8050: fa fa fa fa fa fa fa fa fa fa fa fa fa fa fa fa
Shadow byte legend (one shadow byte represents 8 application bytes):
  Addressable:           00
  Partially addressable: 01 02 03 04 05 06 07
  Heap left redzone:       fa
  Freed heap region:       fd
  Stack left redzone:      f1
  Stack mid redzone:       f2
  Stack right redzone:     f3
  Stack after return:      f5
  Stack use after scope:   f8
  Global redzone:          f9
  Global init order:       f6
  Poisoned by user:        f7
  Container overflow:      fc
  Array cookie:            ac
  Intra object redzone:    bb
  ASan internal:           fe
  Left alloca redzone:     ca
  Right alloca redzone:    cb
==30259==ABORTING
If you compile the application with debugging symbols (-g switch), the tool will also be able to convert addresses into file names and line numbers. That way, we can easily identify the line of the source code that caused the error (see line 6 in the listing above).
So can you see the error now? We overflowed the ptr pointer because we forgot to allocate an extra byte for the null character ('\0’).
In this other example, we have a memory leak problem:
#include <stdio.h>
#include <stdlib.h>
#include <string.h>

void alloc()
{
    char *ptr;

    ptr = malloc(10);

    memset(ptr, 0, 10);
}

int main(int argc, const char *argv[])
{
    int i;

    for (i = 0; i < 3; i++)
        alloc();

    printf("OK!\n");

    return 0;
}
Again, the program is compiled without warnings and runs:
$ gcc main.c -o main -Wall -Werror -g
sprado@sprado-office:~/Temp$ ./main
OK!
But the memory leak problems are quickly identified when we compile and run the program with AddressSanitizer enabled:
$ gcc main.c -o main -Wall -Werror -g -fsanitize=address

$ ./main
==20677==WARNING: Trying to symbolize code, but external symbolizer is not initialized!

=================================================================
==20677==ERROR: LeakSanitizer: detected memory leaks

Direct leak of 30 byte(s) in 3 object(s) allocated from:
#0 0x465319 (/tmp/main+0x465319)
#1 0x47b588 (/tmp/main+0x47b588)
#2 0x47b8c7 (/tmp/main+0x47b8c7)
#3 0x7f5e28457f44 (/lib/x86_64-linux-gnu/libc.so.6+0x21f44)

SUMMARY: AddressSanitizer: 30 byte(s) leaked in 3 allocation(s).
The memory leak check is enabled by default on x86_64. But depending on the architecture, to check for a memory leak we may need to add detect_leaks=1 to the environment variable ASAN_OPTIONS. Check the documentation for more information about this feature.
More about AddressSanitizer
AddressSanitizer works on x86 (32-bit and 64-bit), ARM (32-bit and 64-bit), MIPS (32-bit and 64-bit) and PowerPC64. The supported operating systems are Linux, Darwin (OS X and iOS Simulator), FreeBSD and Android.
Another interesting fact is that AddressSanitizer is implemented via some libraries, which are kept in the LLVM repository and shared with the GCC project. This is a clear example that, in recent years, there has been an increasing collaboration between the communities of GCC and Clang.
It is also important to note that these memory checks add considerable processing overhead to the application, and should only be used during development and testing.
According to the benchmarks published in the project documentation, AddressSanitizer could decrease the application’s execution time by up to 2x. Which is not good for production code, but not that bad for testing purposes. In fact, the performance is impressive, considering that the tool intercepts and checks every memory access made by the application.
So are you curious about how AddressSanitizer works?
How does AddressSanitizer work?
To instrument memory allocation and identify leaks, the malloc and free family of functions are replaced, so every memory allocation/deallocation is monitored by the tool.
Easy, right? But how to identify buffer overflows?
First, all memory that shouldn’t be accessed is poisoned. That includes memory around allocated regions, deallocated memory, and memory around variables in the stack.
Then every read or write memory access …
*ptr = ...;
… will be compiled to a code that will check if that memory address is poisoned or not. If poisoned, it will report an error.
if (IsPoisoned(ptr)) {
  ReportError(ptr, kAccessSize, kIsWrite);
}
*ptr = ...;
According to the documentation, the tricky part is how to implement IsPoisoned() very fast and ReportError() very compact.
Basically, the virtual address space of an application is divided into the main application memory that is used by the application code and a shadow memory that stores metadata about poisoned (not addressable) memory.
AddressSanitizer maps every 8 bytes of application memory into 1 byte of shadow memory. If a memory address is unpoisoned (i.e. addressable) the bit in the shadow memory is 0. If a memory address is poisoned (i.e. not addressable) the bit in the shadow memory is 1. That way, AddressSanitizer can identify which memory access is allowed or not and report errors.
If you want to get into the details about the implementation, read the documentation of the AddressSanitizer algorithm.
What about Valgrind?
You may know Valgrind, a very popular instrumentation framework that is also able to identify and report memory access problems.
The great advantage of Valgrind is that it can instrument the code without the need to recompile it.
However, the tradeoff is a big performance hit. According to this presentation, while AddressSanitizer execution overhead is around 2x, Valgrind’s overhead could be more than 20x!
In addition to AddressSanitizer, there are also another sanitizers provided by the project:
- ThreadSanitizer is capable of identifying concurrency problems (data races and deadlocks).
- MemorySanitizer is a detector of uninitialized memory reads in C/C++ programs.
- Hardware-assisted AddressSanitizer is a newer variant of AddressSanitizer that is based on partial hardware assistance, consuming much less memory.
- UndefinedBehaviorSanitizer is a fast undefined behavior detector.
- The Kernel Address Sanitizer (KASAN) is a dynamic memory error detector for the Linux kernel (subject for a future article).
Support for AddressSanitizer exists in Clang since version 3.1 and GCC since version 4.8. If any of your projects use GCC or Clang, you should really stop what you are doing right now, enable the -fsanitize=address compiler switch and test your code. Do it. You may be surprised with the result!
About the author: Sergio Prado has been working with embedded systems for more than 20 years. If you want to know more about his work, please visit the About page or Embedded Labworks website.
Please email your comments to sergio at embeddedbits.org or sign up the newsletter to receive updates.
See also
- GCC extensions to the C language
- Extracting firmware from devices using JTAG
- Bug hunting with static analysis tools
- Reverse engineering my router’s firmware with binwalk
- A new blog about embedded systems
本文内容由网友自发贡献,版权归原作者所有,本站不承担相应法律责任。如您发现有涉嫌抄袭侵权的内容,请联系:hwhale#tublm.com(使用前将#替换为@)