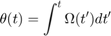
Allan方差最初由David W. Allan开发,用于测量精密仪器的频率稳定性。 它还可用于识别固定陀螺仪测量中存在的各种噪声源。对于一份陀螺仪样本数据,其采样时间为
τ
0
\tau_{0}
τ0,数据集合的长度分别为
τ
0
,
2
τ
0
,
…
,
m
τ
0
,
(
m
<
(
L
−
1
)
/
2
)
\tau_{0}, 2 \tau_{0}, \ldots, m \tau_{0},(m<(L-1) / 2)
τ0,2τ0,…,mτ0,(m<(L−1)/2),获得在每段数据上的平均值,Allan方差定义为数据平均值的样本方差,Allan方差在数据量较大时精度较高。
Allan方差的计算
采样时间为
τ
0
\tau_{0}
τ0,
Ω
\Omega
Ω每一段的数据样本集合。
% Load logged data from one axis of a three-axis gyroscope. This recording
% was done over a six hour period with a 100 Hz sampling rate.
load('LoggedSingleAxisGyroscope', 'omega', 'Fs')
t0 = 1/Fs;
maxNumM = 100;
L = size(theta, 1);
maxM = 2.^floor(log2(L/2));
m = logspace(log10(1), log10(maxM), maxNumM).';
m = ceil(m); % m must be an integer.
m = unique(m); % Remove duplicates.

tau = m*t0;

avar = zeros(numel(m), 1);
for i = 1:numel(m)
    mi = m(i);
    avar(i,:) = sum( ...
        (theta(1+2*mi:L) - 2*theta(1+mi:L-mi) + theta(1:L-2*mi)).^2, 1);
end
avar = avar ./ (2*tau.^2 .* (L - 2*m));
最后,Allan方差
σ
(
t
)
=
σ
2
(
t
)
\sigma(t)=\sqrt{\sigma^{2}(t)}
σ(t)=σ2(t)用于确定陀螺仪噪声参数。
% Find the index where the slope of the log-scaled Allan deviation is equal
% to the slope specified.
slope = -0.5;
logtau = log10(tau);
logadev = log10(adev);
dlogadev = diff(logadev) ./ diff(logtau);
[~, i] = min(abs(dlogadev - slope));
% Find the y-intercept of the line.
b = logadev(i) - slope*logtau(i);
% Determine the angle random walk coefficient from the line.
logN = slope*log(1) + b;
N = 10^logN
% Plot the results.
tauN = 1;
lineN = N ./ sqrt(tau);
figure
loglog(tau, adev, tau, lineN, '--', tauN, N, 'o')
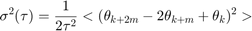
title('Allan Deviation with Angle Random Walk')
xlabel('\tau')
ylabel('\sigma(\tau)')
legend('\sigma', '\sigma_N')
text(tauN, N, 'N')
grid on
axis equal
N =
0.0126
Rate Random Walk
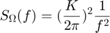
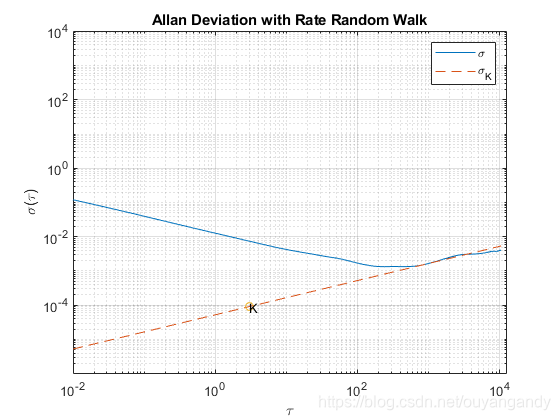
陀螺仪输出的红噪声(布朗噪声)频谱被定义为Rate Random Walk ,PSD(功率谱密度)如下: 其中K为Rate Random Walk系数,代入原始PSD方程并执行积分: 上面的等式是在log-log图上绘制的斜率为-1/2的线。 N的值可以直接从该行读取。
% Find the index where the slope of the log-scaled Allan deviation is equal
% to the slope specified.
slope = 0.5;
logtau = log10(tau);
logadev = log10(adev);
dlogadev = diff(logadev) ./ diff(logtau);
[~, i] = min(abs(dlogadev - slope));

% Find the y-intercept of the line.
b = logadev(i) - slope*logtau(i);

% Determine the rate random walk coefficient from the line.
logK = slope*log10(3) + b;
K = 10^logK

% Plot the results.
tauK = 3;
lineK = K .* sqrt(tau/3);
figure
loglog(tau, adev, tau, lineK, '--', tauK, K, 'o')
title('Allan Deviation with Rate Random Walk')
xlabel('\tau')
ylabel('\sigma(\tau)')
legend('\sigma', '\sigma_K')
text(tauK, K, 'K')
grid on
axis equal
K =

   9.0679e-05
Bias Instability 零偏不稳定性
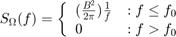
零偏不稳定性被定义为陀螺仪输出的粉红噪声频谱pink noise(闪烁噪声-flicker noise),功率谱密度表示如下: 其中B为零偏不稳定性系数,
f
0
f_{0}
f0为截止频率。 代入原始PSD方程并执行积分: 其中:
C
i
Ci
Ci =余弦积分函数.其中,
τ
\tau
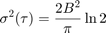
τ远大于截止频率的倒数时,PSD方程为: 当绘制在对数图上时,上面的等式是斜率为0的直线。 B的值可以直接从该行读取,缩放比例为:
% Find the index where the slope of the log-scaled Allan deviation is equal
% to the slope specified.
slope = 0;
logtau = log10(tau);
logadev = log10(adev);
dlogadev = diff(logadev) ./ diff(logtau);
[~, i] = min(abs(dlogadev - slope));
% Find the y-intercept of the line.
b = logadev(i) - slope*logtau(i);
% Determine the bias instability coefficient from the line.
scfB = sqrt(2*log(2)/pi);
logB = b - log10(scfB);
B = 10^logB
% Plot the results.
tauB = tau(i);
lineB = B * scfB * ones(size(tau));
figure
loglog(tau, adev, tau, lineB, '--', tauB, scfB*B, 'o')
title('Allan Deviation with Bias Instability')
xlabel('\tau')
ylabel('\sigma(\tau)')
legend('\sigma', '\sigma_B')
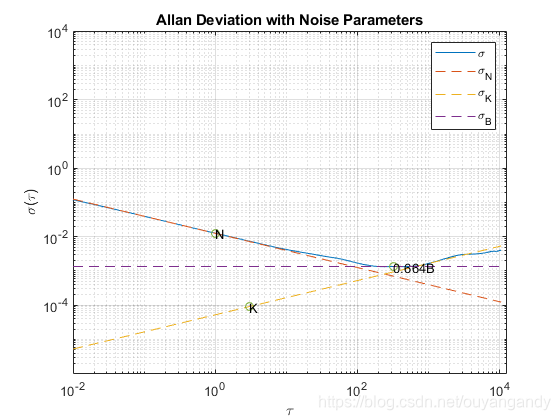
text(tauB, scfB*B, '0.664B')
grid on
axis equal
B =
0.0020
现在已经计算了所有噪声参数,将Allan偏差绘制为量化参数的所有线。
陀螺仪仿真
使用imu传感器基于上面确定的噪声参数模拟陀螺仪测量。
% Simulating the gyroscope measurements takes some time. To avoid this, the
% measurements were generated and saved to a MAT-file. By default, this
% example uses the MAT-file. To generate the measurements instead, change
% this logical variable to true.
generateSimulatedData = false;

if generateSimulatedData
    % Set the gyroscope parameters to the noise parameters determined
    % above.
    gyro = gyroparams('NoiseDensity', N, 'RandomWalk', K, ...
        'BiasInstability', B);
    omegaSim = helperAllanVarianceExample(L, Fs, gyro);
else
    load('SimulatedSingleAxisGyroscope', 'omegaSim')
end
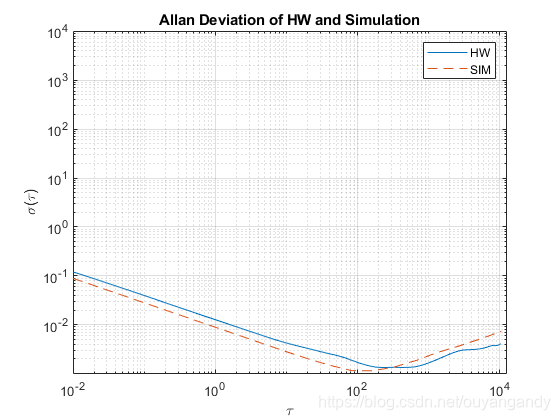
计算模拟的Allan偏差并将其与记录的数据进行比较:
[avarSim, tauSim] = allanvar(omegaSim, 'octave', Fs);
adevSim = sqrt(avarSim);
adevSim = mean(adevSim, 2); % Use the mean of the simulations.

figure
loglog(tau, adev, tauSim, adevSim, '--')
title('Allan Deviation of HW and Simulation')
xlabel('\tau');
ylabel('\sigma(\tau)')
legend('HW', 'SIM')
grid on
axis equal