Excel电子表格中的数据透视表用于以交互方式汇总数据。假设在工作表中有许多发票的数据。在这种情况下,可以使用数据透视表汇总按客户或产品分组的发票。在本文中,将学习如何以编程方式处理Excel中的数据透视表。特别是,将了解如何在Java中创建数据透视表并基于该数据透视表生成图表。
- 使用Java在Excel中创建数据透视表
- 使用数据透视表生成图表
为了使用Excel数据透视表,我们将使用Aspose.Cells for Java,它是一个功能强大的API,可让您从Java应用程序内部生成,修改和转换Excel文件。点击下方按钮可下载试用。下载最新版
使用Java在Excel中创建数据透视表
以下是使用Java在Excel中创建数据透视表的步骤。
- 使用工作簿类创建一个新的或加载一个现有的Excel文件。
- 用数据填充工作表(可选)。
- 使用Worksheet.getPivotTables()方法将数据透视表收集到一个PivotTableCollection对象中。
- 使用PivotTableCollection.add(string, string, string)方法添加一个新的透视表,并在PivotTable对象中获得其引用。
- 设置选项,如总计、格式化等。
- 使用PivotTable.addFieldToArea(int, int)方法向区域添加字段。
- 使用Workbook.save(string)方法保存工作簿。
下面的代码示例演示如何使用Java在Excel中添加数据透视表。
// Instantiate an Workbook object
Workbook workbook = new Workbook("worksheet.xlsx");

// Access the sheet
Worksheet sheet2 = workbook.getWorksheets().get(1);

// Get the pivottables collection in the sheet
PivotTableCollection pivotTables = sheet2.getPivotTables();

// Add a PivotTable to the worksheet
int index = pivotTables.add("=Data!A1:F30", "B3", "PivotTable1");

// Access the instance of the newly added PivotTable
PivotTable pivotTable = pivotTables.get(index);

// Show the grand totals
pivotTable.setRowGrand(true);
pivotTable.setColumnGrand(true);

// Set the PivotTable report is automatically formatted
pivotTable.setAutoFormat(true);

// Set the PivotTable autoformat type.
pivotTable.setAutoFormatType(PivotTableAutoFormatType.REPORT_6);

// Drag the first field to the row area.
pivotTable.addFieldToArea(PivotFieldType.ROW, 0);

// Drag the third field to the row area.
pivotTable.addFieldToArea(PivotFieldType.ROW, 2);

// Drag the second field to the row area.
pivotTable.addFieldToArea(PivotFieldType.ROW, 1);

// Drag the fourth field to the column area.
pivotTable.addFieldToArea(PivotFieldType.COLUMN, 3);

// Drag the fifth field to the data area.
pivotTable.addFieldToArea(PivotFieldType.DATA, 5);

// Set the number format of the first data field
pivotTable.getDataFields().get(0).setNumber(7);

// Save the Excel file
workbook.save("pivotTable.xls");
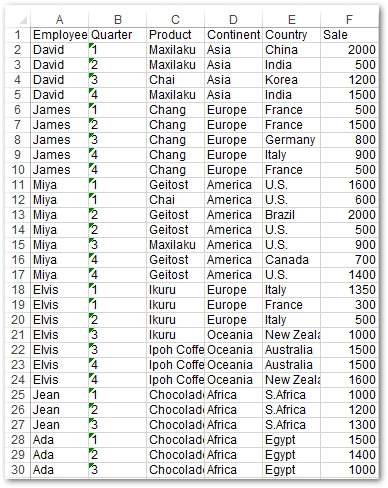
Excel表格
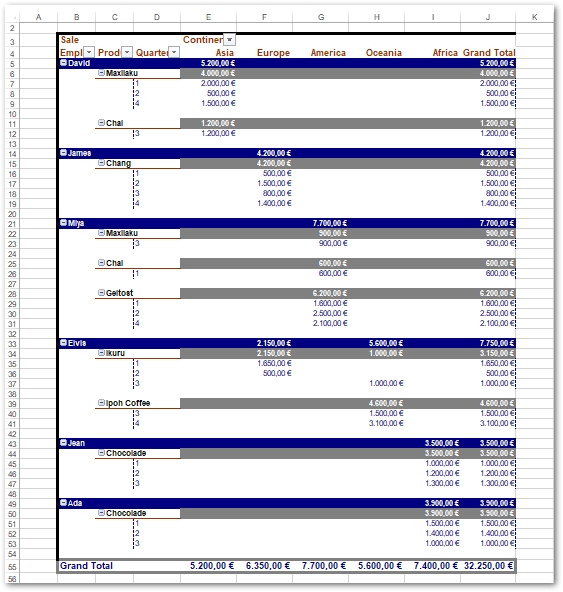
数据透视表
使用Java中的Excel数据透视表生成图表
以下是使用Java中的Excel数据透视表生成图表的步骤。
- 使用工作簿类创建一个新的或加载一个现有的Excel文件。
- 填充工作表(可选)。
- 使用Workbook.getWorksheets().add(SheetType.CHART)方法添加一个新的图表类型的工作表,并在一个工作表对象中获得其引用。
- 使用Worksheet.getCharts().add()方法添加一个新的图表,并在Chart对象中获得其引用。
- 使用Chart.setPivotSource(string)方法将透视表设置为图表的数据源。
- 使用Workbook.save(string)方法保存工作簿。
下面的代码示例显示了如何在Java中使用Excel透视表生成图表。
// Instantiate an Workbook object
 Workbook workbook = new Workbook("pivotTable.xls");

 // Add a new sheet
 int sheetIndex = workbook.getWorksheets().add(SheetType.CHART);
 Worksheet sheet3 = workbook.getWorksheets().get(sheetIndex);

 // Name the sheet
 sheet3.setName("PivotChart");

 // Add a column chart
 int chartIndex = sheet3.getCharts().add(ChartType.COLUMN, 0, 5, 28, 16);
 Chart chart = sheet3.getCharts().get(chartIndex);

 // Set the pivot chart data source
 chart.setPivotSource("PivotTable!PivotTable1");
 chart.setHidePivotFieldButtons(false);

 // Save the Excel file
 workbook.save("pivotChart_test.xls");
如果您有任何疑问或需求,请随时加入Aspose技术交流群(761297826),我们很高兴为您提供查询和咨询。