ClickHouse的资源使用都是从查询thread级别就开始进行追踪,主要的相关代码在 ThreadStatus 类中。每个查询线程都会有一个thread local的ThreadStatus对象,ThreadStatus对象中包含了对内存使用追踪的 MemoryTracker、profile cpu time的埋点对象 ProfileEvents、以及监控thread 热点线程栈的 QueryProfiler。
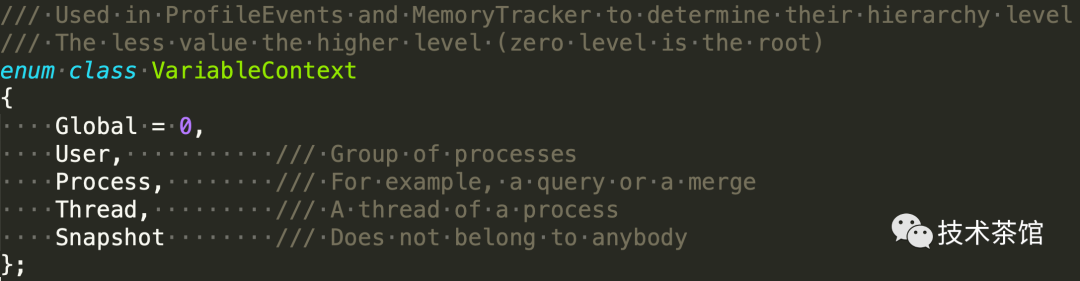
/** Encapsulates all per-thread info (ProfileEvents, MemoryTracker, query_id, query context, etc.). * The object must be created in thread function and destroyed in the same thread before the exit. * It is accessed through thread-local pointer. * * This object should be used only via "CurrentThread", see CurrentThread.h */class ThreadStatus : public boost::noncopyable{public: ThreadStatus(); ~ThreadStatus(); /// Linux's PID (or TGID) (the same id is shown by ps util) const UInt64 thread_id = 0; /// Also called "nice" value. If it was changed to non-zero (when attaching query) - will be reset to zero when query is detached. Int32 os_thread_priority = 0; /// TODO: merge them into common entity ProfileEvents::Counters performance_counters{VariableContext::Thread}; MemoryTracker memory_tracker{VariableContext::Thread}; // CPU and Real time query profilers std::unique_ptr<QueryProfilerReal> query_profiler_real; std::unique_ptr<QueryProfilerCpu> query_profiler_cpu; ......}
MemoryTrack中还有额外的峰值信息(peak)统计,内存上限检查,一旦某个查询线程的申请内存请求在上层(查询级别、用户级别、server级别)MemoryTracker遇到超过限制错误,查询线程就会抛出OOM(Out Of Memory)异常导致查询退出。同时查询线程的MemoryTracker每申请一定量的内存都会统计出当前的工作栈,非常方便排查内存OOM(Out Of Memory)的原因。
文件所在路径: src/Common/new_delete.cpp/// newvoid * operator new(std::size_t size){ Memory::trackMemory(size); return Memory::newImpl(size);}void * operator new[](std::size_t size){ Memory::trackMemory(size); return Memory::newImpl(size);}void * operator new(std::size_t size, const std::nothrow_t &) noexcept{ if (likely(Memory::trackMemoryNoExcept(size))) return Memory::newNoExept(size); return nullptr;}void * operator new[](std::size_t size, const std::nothrow_t &) noexcept{ if (likely(Memory::trackMemoryNoExcept(size))) return Memory::newNoExept(size); return nullptr;}/// delete/// C++17 std 21.6.2.1 (11)/// If a function without a size parameter is defined, the program should also define the corresponding function with a size parameter./// If a function with a size parameter is defined, the program shall also define the corresponding version without the size parameter./// cppreference:/// It's unspecified whether size-aware or size-unaware version is called when deleting objects of/// incomplete type and arrays of non-class and trivially-destructible class types.void operator delete(void * ptr) noexcept{ Memory::untrackMemory(ptr); Memory::deleteImpl(ptr);}void operator delete[](void * ptr) noexcept{ Memory::untrackMemory(ptr); Memory::deleteImpl(ptr);}void operator delete(void * ptr, std::size_t size) noexcept{ Memory::untrackMemory(ptr, size); Memory::deleteSized(ptr, size);}void operator delete[](void * ptr, std::size_t size) noexcept{ Memory::untrackMemory(ptr, size); Memory::deleteSized(ptr, size);}
Allocator相关的代码如下
文件所在路径: src/Common/Allocator.h/** Responsible for allocating / freeing memory. Used, for example, in PODArray, Arena. * Also used in hash tables. * The interface is different from std::allocator * - the presence of the method realloc, which for large chunks of memory uses mremap; * - passing the size into the `free` method; * - by the presence of the `alignment` argument; * - the possibility of zeroing memory (used in hash tables); * - random hint address for mmap * - mmap_threshold for using mmap less or more */template <bool clear_memory_, bool mmap_populate>class Allocator{public: /// Allocate memory range. void * alloc(size_t size, size_t alignment = 0){ checkSize(size); CurrentMemoryTracker::alloc(size); return allocNoTrack(size, alignment); } /// Free memory range. void free(void * buf, size_t size){ checkSize(size); freeNoTrack(buf, size); CurrentMemoryTracker::free(size); } ......}
/** Tracks memory consumption. * It throws an exception if amount of consumed memory become greater than certain limit. * The same memory tracker could be simultaneously used in different threads. */class MemoryTracker{ std::atomic<Int64> amount {0}; std::atomic<Int64> peak {0}; std::atomic<Int64> hard_limit {0}; std::atomic<Int64> profiler_limit {0}; Int64 profiler_step = 0; /// To test exception safety of calling code, memory tracker throws an exception on each memory allocation with specified probability. double fault_probability = 0; /// To randomly sample allocations and deallocations in trace_log. double sample_probability = 0; /// Singly-linked list. All information will be passed to subsequent memory trackers also (it allows to implement trackers hierarchy). /// In terms of tree nodes it is the list of parents. Lifetime of these trackers should "include" lifetime of current tracker. std::atomic<MemoryTracker *> parent {}; /// You could specify custom metric to track memory usage. CurrentMetrics::Metric metric = CurrentMetrics::end(); /// This description will be used as prefix into log messages (if isn't nullptr) std::atomic<const char *> description_ptr = nullptr; ......}
/// Total (wall clock) time spent in processing (queries and other tasks) threads (not that this is a sum).extern const Event RealTimeMicroseconds; /// Total time spent in processing (queries and other tasks) threads executing CPU instructions in user space. This include time CPU pipeline was stalled due to cache misses, branch mispredictions, hyper-threading, etc.extern const Event UserTimeMicroseconds; /// Total time spent in processing (queries and other tasks) threads executing CPU instructions in OS kernel space. This include time CPU pipeline was stalled due to cache misses, branch mispredictions, hyper-threading, etc.extern const Event SystemTimeMicroseconds; extern const Event SoftPageFaults;extern const Event HardPageFaults;/// Total time a thread spent waiting for a result of IO operation, from the OS point of view. This is real IO that doesn't include page cache.extern const Event OSIOWaitMicroseconds;/// Total time a thread was ready for execution but waiting to be scheduled by OS, from the OS point of view.extern const Event OSCPUWaitMicroseconds; /// CPU time spent seen by OS. Does not include involuntary waits due to virtualization.extern const Event OSCPUVirtualTimeMicroseconds;/// Number of bytes read from disks or block devices. Doesn't include bytes read from page cache. May include excessive data due to block size, readahead, etc.extern const Event OSReadBytes; /// Number of bytes written to disks or block devices. Doesn't include bytes that are in page cache dirty pages. May not include data that was written by OS asynchronously.extern const Event OSWriteBytes; /// Number of bytes read from filesystem, including page cache.extern const Event OSReadChars; /// Number of bytes written to filesystem, including page cache.extern const Event OSWriteChars;
/* * Priority of the query. * 1 - the highest, higher value - lower priority; * 0 - do not use priorities.*/priority;/* * Priority of the query. * 1 - the highest, higher value - lower priority; * 0 - do not use priorities.*/os_thread_priority;
/** Quota for resources consumption for specific interval. * Used to limit resource usage by user. * Quota is applied "softly" - could be slightly exceed, because it is checked usually only on each block of processed data. * Accumulated values are not persisted and are lost on server restart. * Quota is local to server, * but for distributed queries, accumulated values for read rows and bytes * are collected from all participating servers and accumulated locally. */struct Quota : public IAccessEntity{ enum ResourceType { QUERIES, /// Number of queries. ERRORS, /// Number of queries with exceptions. RESULT_ROWS, /// Number of rows returned as result. RESULT_BYTES, /// Number of bytes returned as result. READ_ROWS, /// Number of rows read from tables. READ_BYTES, /// Number of bytes read from tables. EXECUTION_TIME, /// Total amount of query execution time in nanoseconds. MAX_RESOURCE_TYPE }; ......}