一、可视化海量点应用场景
在正文开始之前我先说说我为啥会使用这个技术来实现数据的可视化。
事情是这样的,我接手了一个项目,里面有个需求是在地图上标记出他们公司的产品的使用分布。我接手的时候呢,我前面的那位大哥是使用marker点覆盖物,加上for循环来渲染实现的,可能他在维护这个项目的时候,公司的产品上线的比较少,最多的时候也不超过2000个,所以通过for循环marker也没出现什么卡顿现象。
可到我这里,好家伙,一下子数据飙到1w多,进那个页面之后直接卡死,浏览器直接崩溃了。所以说通过for循环marker的方式在数据量小的时候还可以,在大数据面前显然是不可取的。
在高德官方呢也给出了解决方案,
- 一个是通过MassMarks海量点来解决
- 一个是通过layer加上 Loca.GeoJSONSource的方式处理
二、示例代码
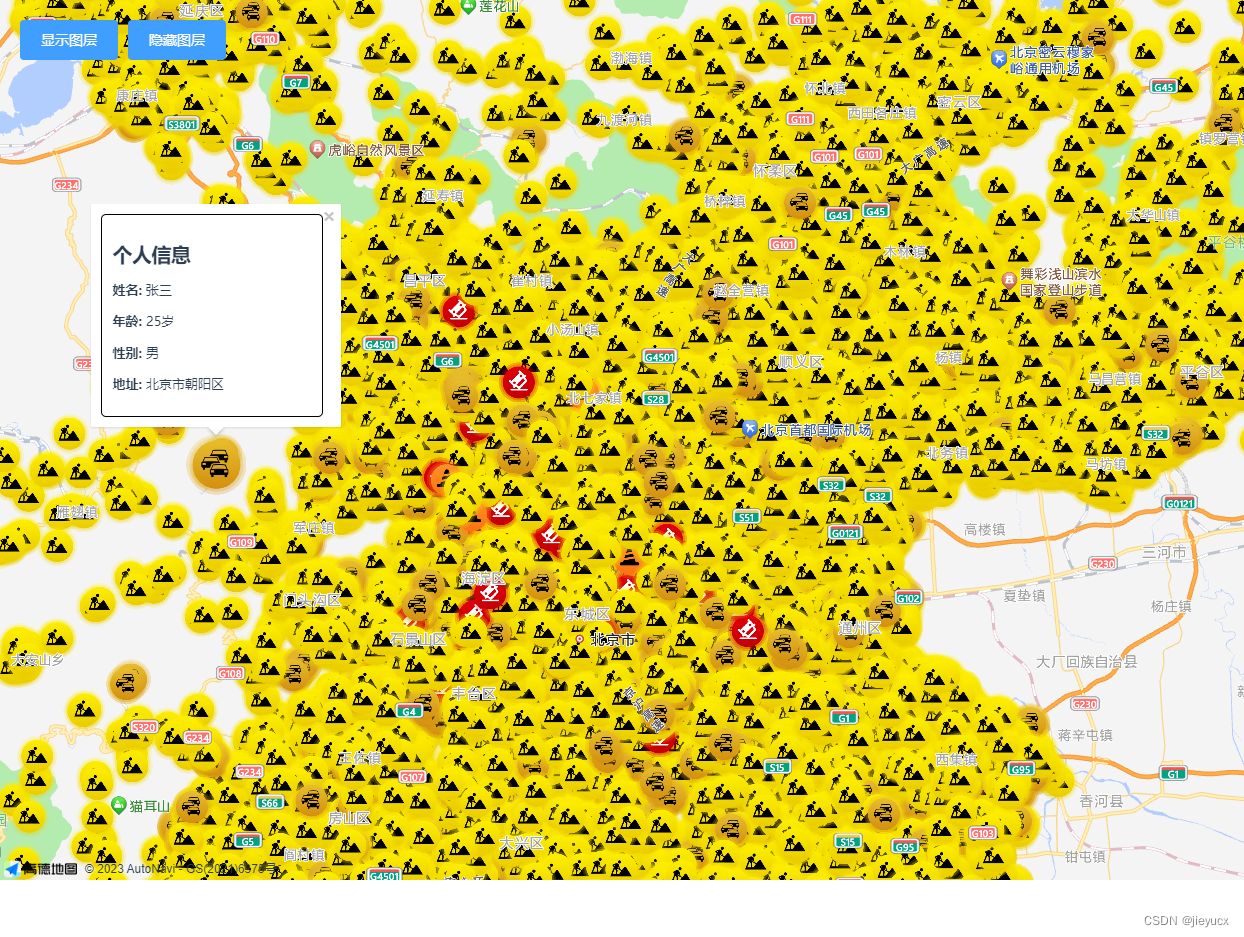
我这里采用的是第二种方式,这是我根据官方示例自己在vue项目中实现的demo效果
官网示例:https://lbs.amap.com/demo/loca-v2/demos/cat-icon/icon_traffic
- 可以显示和影藏点
- 鼠标移动到点上时样式改为手的样式
-
点击点覆盖物时弹出信息窗体
好了 先不说别的直接上代码吧,整体代码给了之后,再分析一下一些细节注意点。
1. 地图初始化mixin抽取
import AMapLoader from "@amap/amap-jsapi-loader";
window._AMapSecurityConfig = {
  securityJsCode: "xxxxxxxxxxx", // '「申请的安全密钥」',
};

const mapInit = {
  data() {
    return {
      map: null,
      AMap: null,
      Loca: null,
      msg: "hello",
    };
  },
  methods: {
    async initAMap() {
      this.AMap = await AMapLoader.load({
        key: "xxxxxxxxxxxxxxxxxxxxx", // 申请好的Web端开发者Key,首次调用 load 时必填
        version: "2.0", // 指定要加载的 JSAPI 的版本,缺省时默认为 1.4.15
        plugins: [
          "AMap.Scale",
          "AMap.ToolBar",
          "AMap.ControlBar",
          "AMap.Geocoder",
          "AMap.Marker",
          "AMap.CitySearch",
          "AMap.Geolocation",
          "AMap.AutoComplete",
          "AMap.InfoWindow",
        ], // 需要使用的的插件列表,如比例尺'AMap.Scale'等
        Loca: {
          // 是否加载 Loca, 缺省不加载
          version: "2.0.0", // Loca 版本,缺省 1.3.2
        },
      });
      this.map = new AMap.Map("amapcontainer", {
        willReadFrequently: true,
        //设置地图容器id
        resizeEnable: true,
        zoom: this.zoom, // 地图显示的缩放级别
        viewMode: "3D", // 使用3D视图
        zoomEnable: true, // 地图是否可缩放,默认值为true
        dragEnable: true, // 地图是否可通过鼠标拖拽平移,默认为true
        doubleClickZoom: true, // 地图是否可通过双击鼠标放大地图,默认为true
        zoom: 11, //初始化地图级别
        center: [116.397428, 39.90923], // 初始化中心点坐标 北京
        // mapStyle: "amap://styles/darkblue", // 设置颜色底层
      });

    },
    // 修改鼠标样式
    changeCursor(layer) {
      //监听鼠标移动事件,如果移动到图层上的元素,就改变鼠标样式为手的样式
      this.map.on("mousemove", (e) => {
        let features = layer.queryFeature(e.pixel.toArray());
        if (features) {
        this.map.setDefaultCursor("pointer");
        } else {
        this.map.setDefaultCursor("default");
        }
    });
    }
  },
  mounted() {
    //DOM初始化完成进行地图初始化
    // this.initAMap();
  },
  created() {
  }
};

export default mapInit;
2. 地图点的数据准备
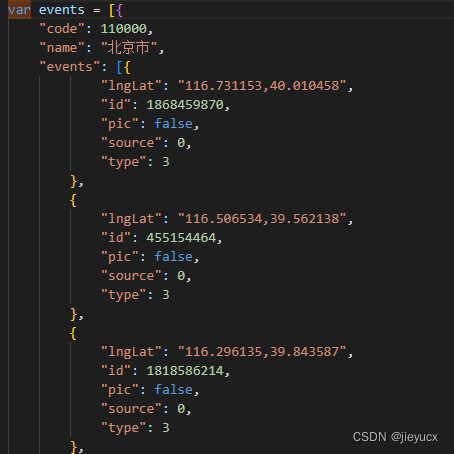
高德官方是的数据:https://a.amap.com/Loca/static/loca-v2/demos/mock_data/events.js
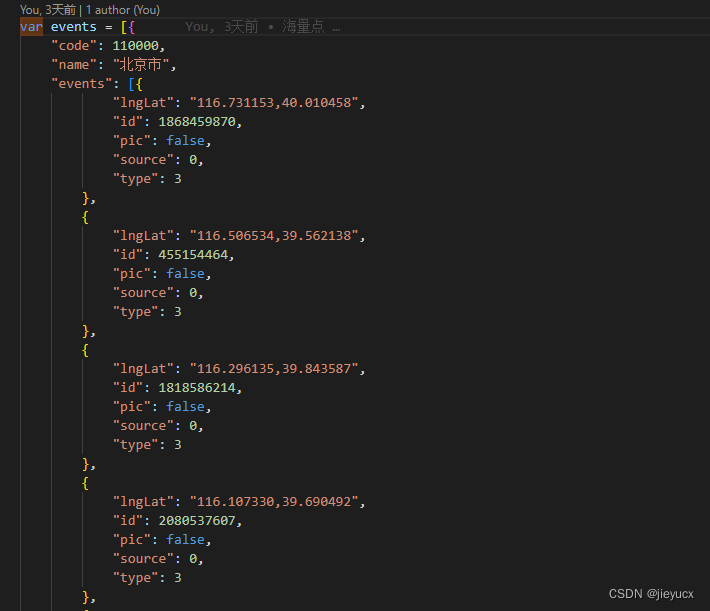
我是把它搞下来,在本地新建了个文件,然后导入使用的
3. demo组件
<template>
<div class="local-container">
<div id="amapcontainer" style="width: 100%; height: 880px"></div>
<div class="button-list">
<el-button type="primary" @click="layer.show()">显示图层</el-button>
<el-button type="primary" @click="layer.hide()">隐藏图层</el-button>
</div>
</div>
</template>
<script>
import mapinit from "@/mixin/mapinit.js";
import events from "@/count/event.js";
console.log('events', events)
export default {
mixins: [mapinit],
data() {
return {
layer: null,
};
},
created() {
//可以直接使用mixin里面定义变量
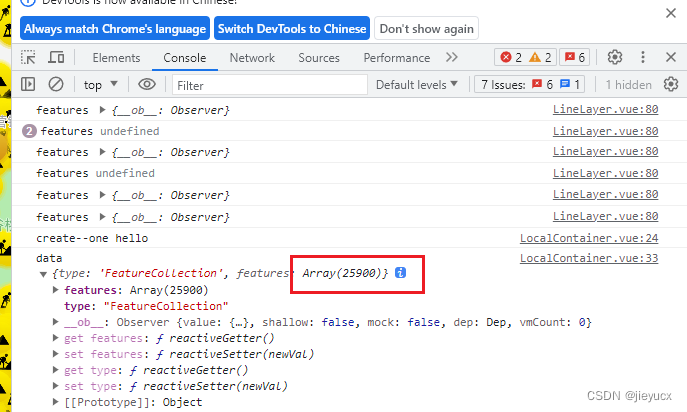
console.log("create--one", this.msg);
},
methods: {
async mapExtend() {
let loca = new Loca.Container({ //创建一个容器
map: this.map,
});
// let data = this.getTestData()
let data = this.getEventsCollection();
console.log('data', data)
let geo = new Loca.GeoJSONSource({ //数据源
data: data,
});
let layer = new Loca.IconLayer({ //图层
zIndex: 10, //图层层级
opacity: 1, //透明度
visible: false, //是否显示
});
let trafficIcons = {
1: 'https://a.amap.com/Loca/static/loca-v2/demos/images/traffic-control.png',
2: 'https://a.amap.com/Loca/static/loca-v2/demos/images/jam.png',
3: 'https://a.amap.com/Loca/static/loca-v2/demos/images/construction.png',
4: 'https://a.amap.com/Loca/static/loca-v2/demos/images/close.png',
5: 'https://a.amap.com/Loca/static/loca-v2/demos/images/fog.png',
0: 'https://a.amap.com/Loca/static/loca-v2/demos/images/accident.png',
};
layer.setSource(geo); //设置数据源
layer.setStyle({
unit: 'px',
icon: (index, feature) => {
let data = feature.properties.rawData;
let url = trafficIcons[data.type % Object.keys(trafficIcons).length];
return url;
},
// icon: 'https://a.amap.com/Loca/static/loca-v2/demos/images/traffic-control.png',
iconSize: [40, 40],
offset: [0, -40],
rotation: 0,
})
loca.add(layer);
this.map.on('complete', function () {
setTimeout(function () {
layer.show();
layer.addAnimate({
key: 'offset',
value: [0, 1],
easing: 'Linear',
transform: 500,
random: true,
delay: 9000,
});
layer.addAnimate({
key: 'iconSize',
value: [0, 1],
easing: 'Linear',
transform: 500,
random: true,
delay: 9000,
});
}, 800);
});
loca.animate.start();
layer.show(); //显示图层
// 拾取测试
this.map.on('click', (e) => {
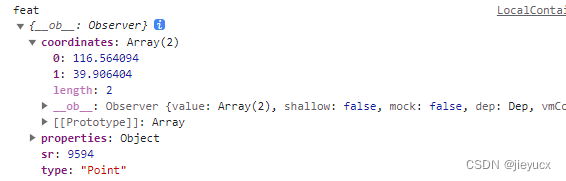
const feat = layer.queryFeature(e.pixel.toArray());
console.log('feat', feat);
if (feat) {
layer.setStyle({
unit: 'px',
icon: (index, feature) => {
let data = feature.properties.rawData;
let url = trafficIcons[data.type % Object.keys(trafficIcons).length];
return url;
},
iconSize: (i, feature) => {
if (feature === feat) {
return [60, 60];
}
return [40, 40];
},
});
// 为当前的feat信息,添加一个弹窗
const infoWindow = new this.AMap.InfoWindow({
content: `<div style="border: 1px solid black; padding: 10px; width: 200px; border-radius: 5px;">
<h2 style="margin-bottom: 10px;">个人信息</h2>
<p><strong>姓名:</strong> 张三</p>
<p><strong>年龄:</strong> 25岁</p>
<p><strong>性别:</strong> 男</p>
<p><strong>地址:</strong> 北京市朝阳区</p>
</div>`,
offset: new this.AMap.Pixel(0, -30),
});
infoWindow.open(this.map, feat.coordinates);
}
});
this.changeCursor(layer);
this.layer = layer;
},
getEventsCollection() {
let _events = events[0].events;
let list = _events.map(e => {
let ll = e.lngLat.split(',');
let arr = [parseFloat(ll[0]), parseFloat(ll[1])] //lng,lat
return {
"type": "Feature",
"properties": {
rawData: e
},
"geometry": {
"type": "Point",
"coordinates": arr
}
}
})
// console.log('list', list)
let data = {
"type": "FeatureCollection",
"features": list,
};
return data;
},
getTestData() {
let list = [];
for (let i = 0; i < 200; i++) {
let fList = [];
for (let j = 0; j < 200; j++) {
fList.push([
Number((115.601 + i * 0.002).toFixed(5)), Number((40.32 + j * 0.002).toFixed(5))
]);
}
list.push({
"type": "Feature",
"properties": {
"name": i,
},
"geometry": {
"type": "MultiPoint",
"coordinates": fList
}
});
}
list.push({
"type": "Feature",
"properties": {
"name": 'HIIII',
},
"geometry": {
"type": "Point",
"coordinates": [115.201, 40.302]
}
})
let data = {
"type": "FeatureCollection",
"features": list,
};
return data;
}
},
async mounted() {
await this.initAMap();
await this.mapExtend();
// console.log('this.map', this.map)
// console.log('this.AMap', this.AMap)
// console.log('this.Loca', this.Loca)
// this.map.setMapStyle('amap://styles/darkblue')
// 设置地图中心点为北京
this.map.setCenter([116.397428, 39.90923]);
},
};
</script>
<style lang="less" scoped>
.local-container {
position: relative;
width: 100%;
.button-list {
position: absolute;
top: 20px;
left: 20px;
z-index: 100;
}
}
</style>
4. 在页面中使用
<template>
  <div>
    <!-- 海量点 -->
    <local-container></local-container>
  </div>
</template>
<script>

import LocalContainer from "@/components/LocalContainer";

export default {
  name: "homeView",
  components: { LocalContainer },
}
</script>

<style lang="less" scoped>
</style>
三、核心功能分析
1. 海量点的数据处理和图层的添加。
            let loca = new Loca.Container({ //创建一个容器
                map: this.map,
            });
            // let data = this.getTestData()
            let data = this.getEventsCollection();
            console.log('data', data)
            let geo = new Loca.GeoJSONSource({ //数据源
                data: data,
            });

            let layer = new Loca.IconLayer({ //图层
                zIndex: 10, //图层层级
                opacity: 1, //透明度
                visible: false, //是否显示
            });
			layer.setSource(geo); //设置数据源
			loca.add(layer); //将图层添加到容器
			layer.show(); //显示图层

		// 处理数据的方法
        getEventsCollection() {
            let _events = events[0].events;
            let list = _events.map(e => {
                let ll = e.lngLat.split(',');
                let arr = [parseFloat(ll[0]), parseFloat(ll[1])] //lng,lat
                return {
                    "type": "Feature",
                    "properties": {
                        rawData: e
                    },
                    "geometry": {
                        "type": "Point",
                        "coordinates": arr
                    }
                }
            })
            // console.log('list', list)
            let data = {
                "type": "FeatureCollection",
                "features": list,
            };
            return data;
        },
我们从上面的地址拿到的数据是这样的结构
我们需要处理成这样的结构
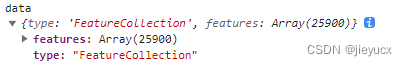
这是因为Loca.GeoJSONSource类需要这种的数据结构。
这里介绍一下Loca.GeoJSONSource
高德地图中的Loca.GeoJSONSource是一个数据源类型对象,用于处理和处理GeoJSON数据。
GeoJSON是一种面向地理数据的开放标准格式,基于JSON(JavaScript对象表示法)。其编码各种地理数据结构,如:点(Point),线(LineString),面(Polygon)等地理数据结构。
Loca.GeoJSONSource的主要用途是处理地图上的数据信息,可以用它来展示各种地理信息数据,如道路、建筑物、行政区域等。
使用Loca.GeoJSONSource首先需要初始化一个Loca.Visual的对象,然后调用其source函数,指定数据源类型为 GeoJSON数据源。如果需要获取远程的GeoJSON数据则需要在参数中指定URL,如果需要处理本地的GeoJSON数据则需传入本地GeoJSON对象。
举例说明:
var layer = new Loca.LineLayer({
    map: map,
    zIndex: 120,
});

layer.source({
    type: 'GeoJSON',
    data: 'https://example.com/data.geojson'
});
这里首先创建了一个Loca.LineLayer对象,并指定了地图展示对象和图层层级。然后调用source方法设置了数据源,数据源类型为GeoJSON,数据路径为指定的网址。
如果你要处理本地对象的数据,代码如下:
var geojson = {
    "type":"FeatureCollection",
    "features":[{
        "type":"Feature",
        "geometry":{
            "type":"Point",
            "coordinates":[123,45]
        },
        "properties":{}
    }]
};
layer.source({
    type: 'GeoJSON',
    data: geojson
});
这里首先定义了一个符合GeoJSON标准的本地对象geojson ,然后调用source方法设置了数据源,数据源类型为GeoJSON,数据则直接传入初始化的geojson对象。
2. 改变鼠标样式
// 修改鼠标样式
    changeCursor(layer) {
      //监听鼠标移动事件,如果移动到图层上的元素,就改变鼠标样式为手的样式
      this.map.on("mousemove", (e) => {
        let features = layer.queryFeature(e.pixel.toArray());
        if (features) {
          this.map.setDefaultCursor("pointer");
        } else {
          this.map.setDefaultCursor("default");
        }
      });
    },
3. 点击图标放大并展示信息
            this.map.on('click', (e) => {
                const feat = layer.queryFeature(e.pixel.toArray());
                console.log('feat', feat);
                if (feat) {
                    layer.setStyle({
                        unit: 'px',
                        icon: (index, feature) => {
                            let data = feature.properties.rawData;
                            let url = trafficIcons[data.type % Object.keys(trafficIcons).length];
                            return url;
                        },
                        iconSize: (i, feature) => {
                            if (feature === feat) {
                                return [60, 60];
                            }
                            return [40, 40];
                        },
                    });
                    // 为当前的feat信息,添加一个弹窗
                    const infoWindow = new this.AMap.InfoWindow({
                        content: `<div style="border: 1px solid black; padding: 10px; width: 200px; border-radius: 5px;">
                                    <h2 style="margin-bottom: 10px;">个人信息</h2>
                                    <p><strong>姓名:</strong> 张三</p>
                                    <p><strong>年龄:</strong> 25岁</p>
                                    <p><strong>性别:</strong> 男</p>
                                    <p><strong>地址:</strong> 北京市朝阳区</p>
                                </div>`,
                        offset: new this.AMap.Pixel(0, -30),
                    });
                    infoWindow.open(this.map, feat.coordinates);

                }
            });
通过
 const feat = layer.queryFeature(e.pixel.toArray());
                console.log('feat', feat);
可以获取到当前点击的图层中的点的位置信息