图例 plt.legend()
import matplotlib.pyplot as plt
import random
import matplotlib
from matplotlib import cycler
from matplotlib.font_manager import FontProperties
# 支持的中文字体
font1 = FontProperties(fname=r"c:\windows\fonts\simsun.ttc")
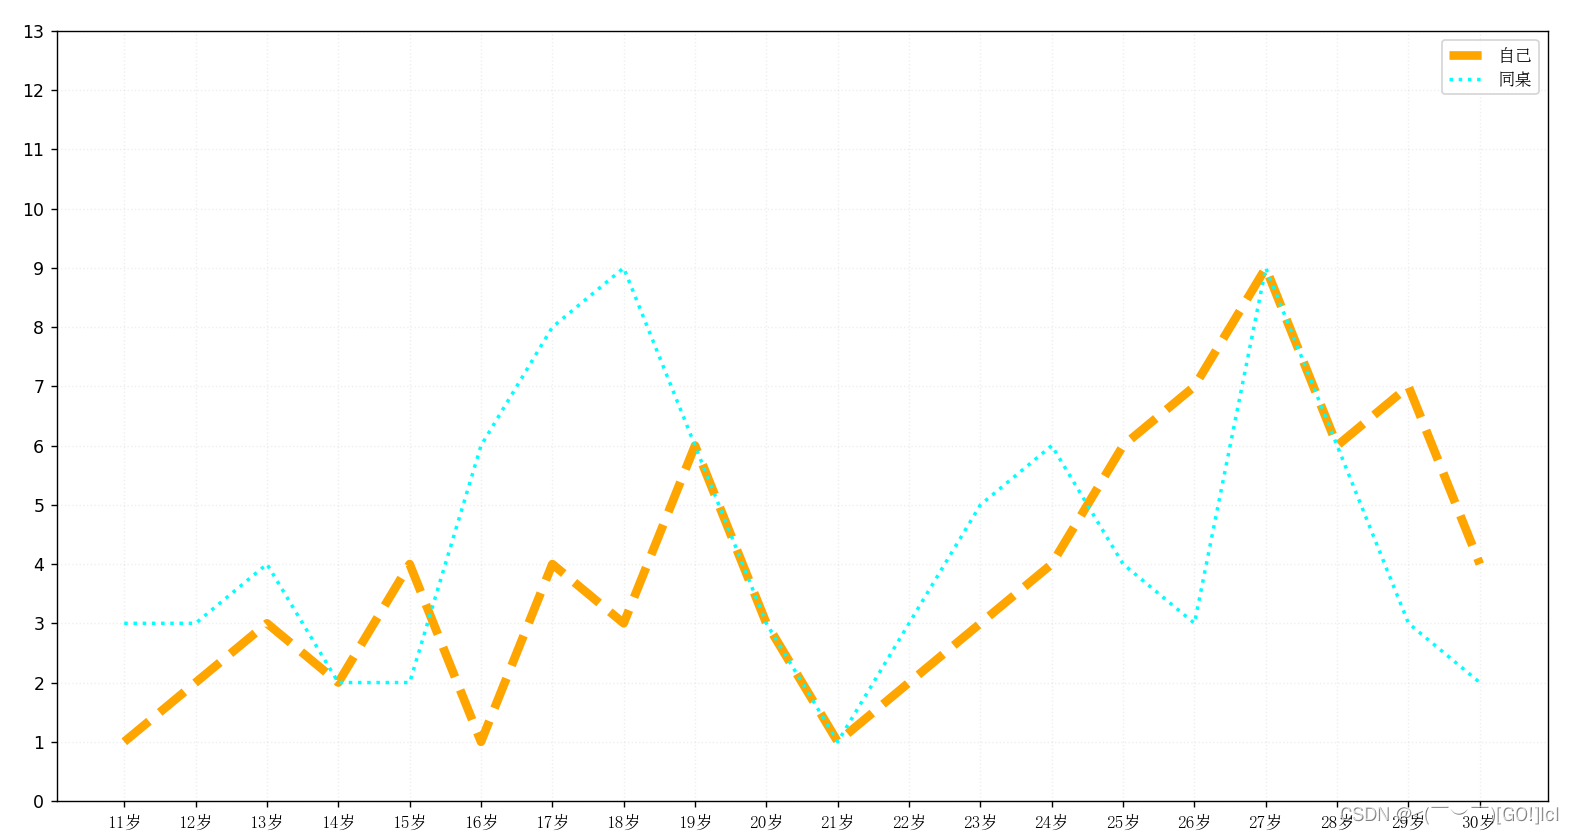
y_1 = [1, 2, 3, 2, 4, 1, 4, 3, 6, 3, 1, 2, 3, 4, 6, 7, 9, 6, 7, 4]
y_2 = [3, 3, 4, 2, 2, 6, 8, 9, 6, 3, 1, 3, 5, 6, 4, 3, 9, 6, 3, 2]
x = range(11, 31)
plt.figure(figsize=(20, 8))
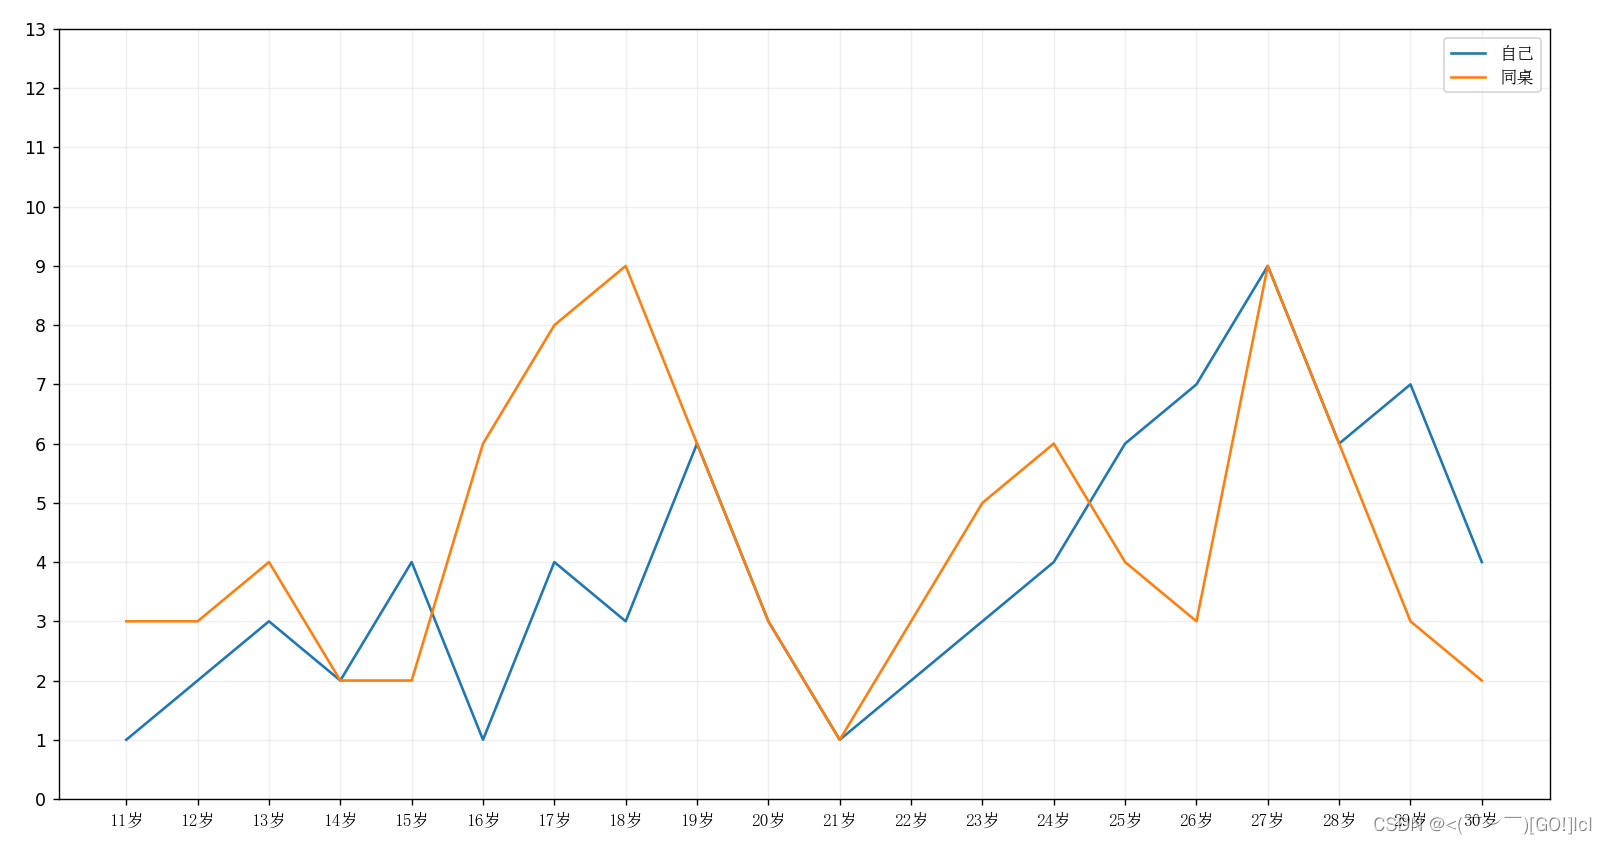
plt.plot(x, y_1, label="自己")
plt.plot(x, y_2, label="同桌")
# 调整x轴上的字符串刻度
_x_ticks = ["{}岁".format(i) for i in x]
plt.xticks(x, _x_ticks, fontproperties=font1)
plt.yticks(range(0, 14))
# 绘制网格
plt.grid(alpha=0.2)
# 添加图例
# plt.legend(prop=font1,loc="upper left") #左上方
plt.legend(prop=font1, loc="upper right") # 右上方
plt.show()
线条颜色 和形状
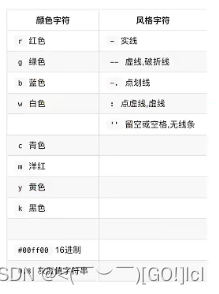
颜色
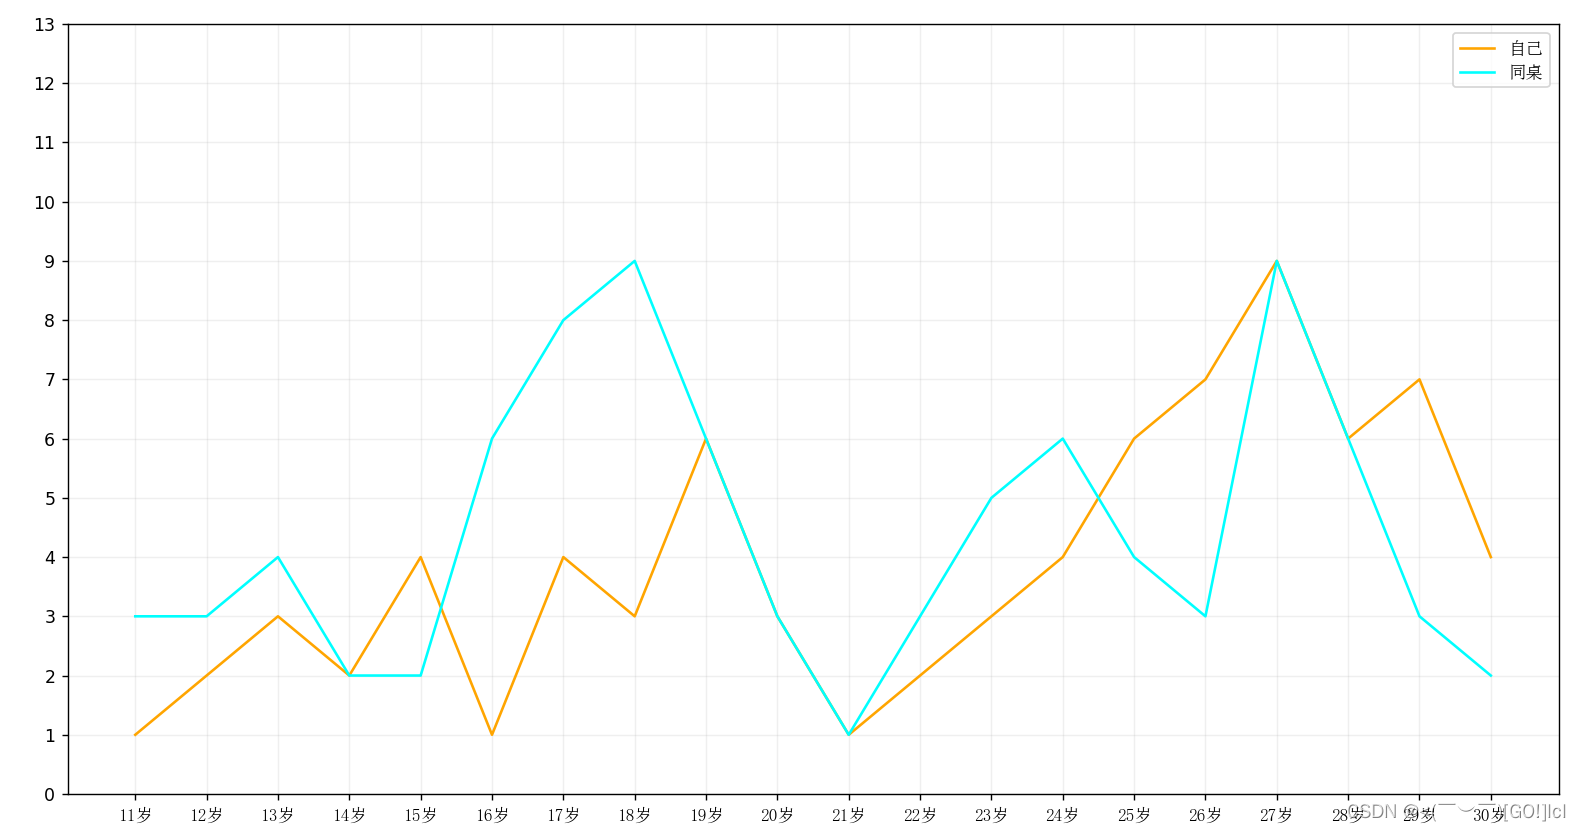
plt.plot(x, y_1, label="自己",color="orange")
plt.plot(x, y_2, label="同桌",color="cyan")
形状
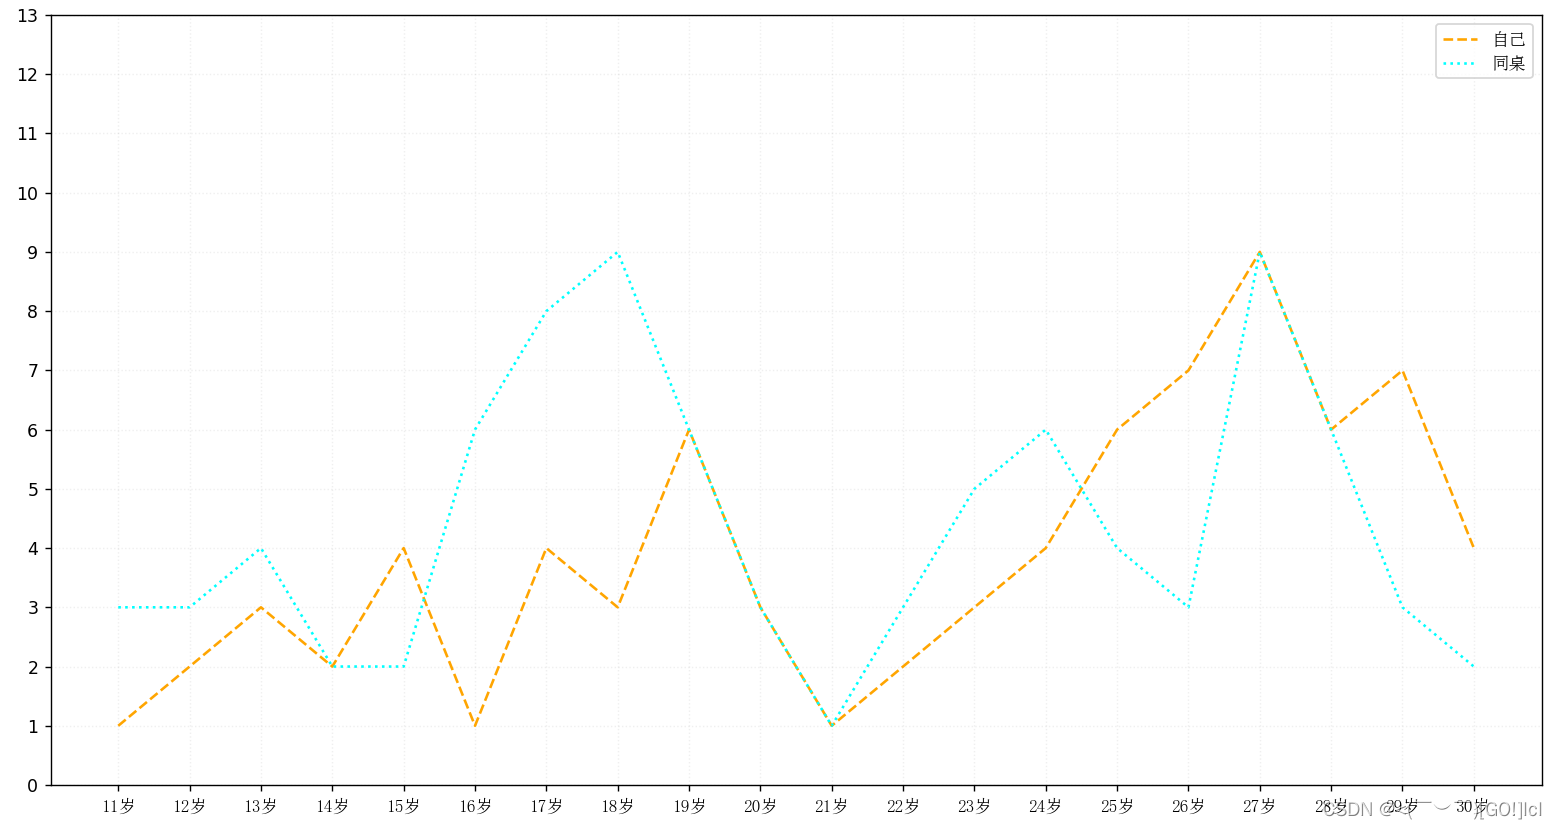
plt.plot(x, y_1, label="自己", color="orange", linestyle="--")
plt.plot(x, y_2, label="同桌", color="cyan", linestyle=":")

粗细
plt.plot(x, y_1, label="自己", color="orange", linestyle="--",linewidth="5")
plt.plot(x, y_2, label="同桌", color="cyan", linestyle=":",linewidth="2")
网格形状
plt.grid(alpha=0.2, linestyle=":")