1. 引子
import numpy as np
import matplotlib.pyplot as plt
from scipy.signal import savgol_filter
np.set_printoptions(precision=0, suppress=True)
hist_equal = np.array([ 0, 0, 0, 0, 2, 7, 13, 23, 35, 46, 56, 64, 72, 78, 82, 86, 89, 92, 95, 99, 102, 105, 108, 111, 113, 115, 117, 119, 121, 122, 124, 126,
128, 129, 131, 133, 134, 136, 137, 139, 140, 142, 143, 145, 146, 148, 149, 151, 153, 155, 157, 159, 161, 163, 166, 168, 170, 172, 174, 175, 177, 178, 179, 180,
181, 182, 182, 183, 184, 185, 185, 186, 187, 188, 189, 189, 190, 191, 192, 193, 193, 194, 195, 196, 197, 197, 198, 199, 200, 200, 201, 202, 202, 203, 204, 204,
205, 205, 206, 207, 207, 208, 208, 209, 209, 210, 210, 211, 211, 212, 213, 213, 214, 214, 215, 215, 216, 216, 217, 217, 218, 218, 219, 219, 220, 221, 221, 222,
222, 223, 224, 225, 225, 226, 227, 227, 228, 229, 230, 230, 231, 232, 233, 234, 235, 236, 236, 237, 238, 239, 239, 240, 241, 241, 242, 242, 243, 243, 244, 244,
245, 245, 246, 246, 247, 247, 248, 248, 249, 249, 250, 250, 250, 251, 251, 251, 251, 251, 251, 251, 251, 251, 251, 251, 251, 251, 252, 252, 252, 252, 252, 252,
252, 252, 252, 252, 252, 252, 252, 252, 252, 252, 252, 252, 252, 252, 252, 252, 252, 252, 252, 252, 252, 252, 252, 252, 252, 252, 252, 252, 252, 252, 252, 253,
253, 253, 253, 253, 253, 253, 253, 253, 253, 253, 253, 253, 253, 253, 254, 254, 254, 254, 254, 254, 254, 254, 254, 254, 254, 254, 254, 254, 254, 254, 254, 255])
# window_length即窗口长度:取值为奇数且不能超过len(x)。它越大,则平滑效果越明显;越小,则更贴近原始曲线。
# polyorder为多项式拟合的阶数:它越小,则平滑效果越明显;越大,则更贴近原始曲线
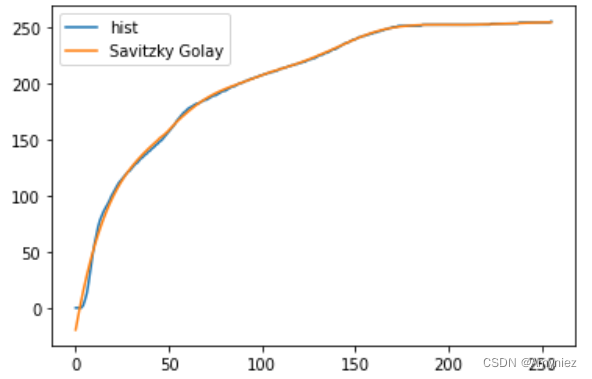
hist_equal_savg = savgol_filter(hist_equal, 90, 4)
x = np.arange(256)
fig, axes = plt.subplots(1, 1)
plt.plot(x, hist_equal, label = "hist")
plt.plot(x, hist_equal_savg, label = "Savitzky Golay")
plt.legend()
plt.show()
plt.show()
结果显示:
2. Savitzky-Golay滤波提取物候信息

import os
import math
import numpy as np
import pandas as pd
from osgeo import gdal
from datetime import datetime
from scipy.signal import savgol_filter
def jd_to_time(time):
dt = datetime.strptime(time,'%Y%j').date()
fmt = '%Y%m%d'
return dt.strftime(fmt)
def readTif(filename):
dataset = gdal.Open(filename)
if dataset == None:
print(filename + "文件无法打开")
return dataset
def writeTiff(img, img_geotrans, img_proj, path):
if 'int8' in img.dtype.name:
datatype = gdal.GDT_Byte
elif 'int16' in img.dtype.name:
datatype = gdal.GDT_UInt16
else:
datatype = gdal.GDT_Float32
if len(img.shape) == 3:
img_bands, img_height, img_width = img.shape
elif len(img.shape) == 2:
img = np.array([img])
img_bands, img_height, img_width = img.shape
# 创建文件
driver = gdal.GetDriverByName("GTiff")
dataset = driver.Create(path, int(img_width), int(img_height), int(img_bands))
if(dataset != None):
dataset.SetGeoTransform(img_geotrans)# 写入仿射变换参数
dataset.SetProjection(img_proj)#写入投影
for i in range(img_bands):
dataset.GetRasterBand(i+1).WriteArray(img[i])
del dataset
def SG_filter(tifFolder, suffix, efolder):
'''
tifFolder:tif所在文件夹
suffix:生成结果文件后缀
'''
# 获取文件夹内的文件名
tifNameList = os.listdir(tifFolder)
phe = []
for p in tifNameList:
pt = os.path.splitext(p)[0] # 获取tiff图像的文件名
pt = int(pt[10:])
phe.append(pt)
# 获取第一张TIFF图像的信息:宽度、高度、投影、坐标系
tifPath = tifFolder + "/" + tifNameList[0]
dataset = readTif(tifPath) # 获取第一个tiff图像文件信息
width = dataset.RasterXSize # 栅格矩阵的列数
height = dataset.RasterYSize # 栅格矩阵的行数
Tif_geotrans = dataset.GetGeoTransform()
Tif_proj = dataset.GetProjection()
Tif_data = dataset.ReadAsArray(0, 0, width, height)
Tif_datas = np.zeros((len(tifNameList),Tif_data.shape[0], Tif_data.shape[1])) # 多张TIFF数据保存到 Tif_datas中
for i in range(len(tifNameList)):
tifPath = tifFolder + "/" +tifNameList[i]
dataset = readTif(tifPath)
Tif_data = dataset.ReadAsArray(0, 0, width, height)
Tif_datas[i] = Tif_data
# 切换维度:宽、高、图像个数
# [0,1,2]->[1,0,2]->[1,2,0]类似于汉诺塔[宽,高,46]
Tif_datas = Tif_datas.swapaxes(1, 0)
Tif_datas = Tif_datas.swapaxes(1, 2)
#定义空集合
SGfilter = np.zeros(Tif_datas.shape)
sos = np.zeros(Tif_data.shape)
eos = np.zeros(Tif_data.shape)
# 读取每张图像的信息,所有图像相同位置的计算
for i in range(Tif_datas.shape[0]): # 行
for j in range(Tif_datas.shape[1]): # 列
value = Tif_datas[i][j]
m = 0
for k in value:
if math.isnan(k) == True: # 空值判断,若有空值,则不计算该像素(全部图像的该像素)
m = m+1
if m == 0:
sif = Tif_datas[i][j]
sif = pd.DataFrame(sif)
sif[sif<0] = 0
sif[sif>32766] = 0
sif = sif * 0.0001
sif = sif.values.flatten()
SGfilter[i][j] = savgol_filter(sif, window_length = 9, polyorder = 3) # 拟合阶数为3
ysg = SGfilter[i][j]
_y2 = list(ysg)
maxy = max(_y2)
miny = min(_y2)
th = 0.2 # 设置阈值
amplitude = maxy - miny # 振幅
thresh = amplitude * th + miny
newnums = list(filter(lambda x: x >= thresh, _y2))
r = newnums[0]
r2 = newnums[-1]
index1 = _y2.index(r)
index2 = _y2.index(r2)
sos[i][j] = phe[index1]
eos[i][j] = phe[index2]
sos[np.where(sos == 1)] = np.NAN
sos[np.where(eos == 1)] = np.NAN
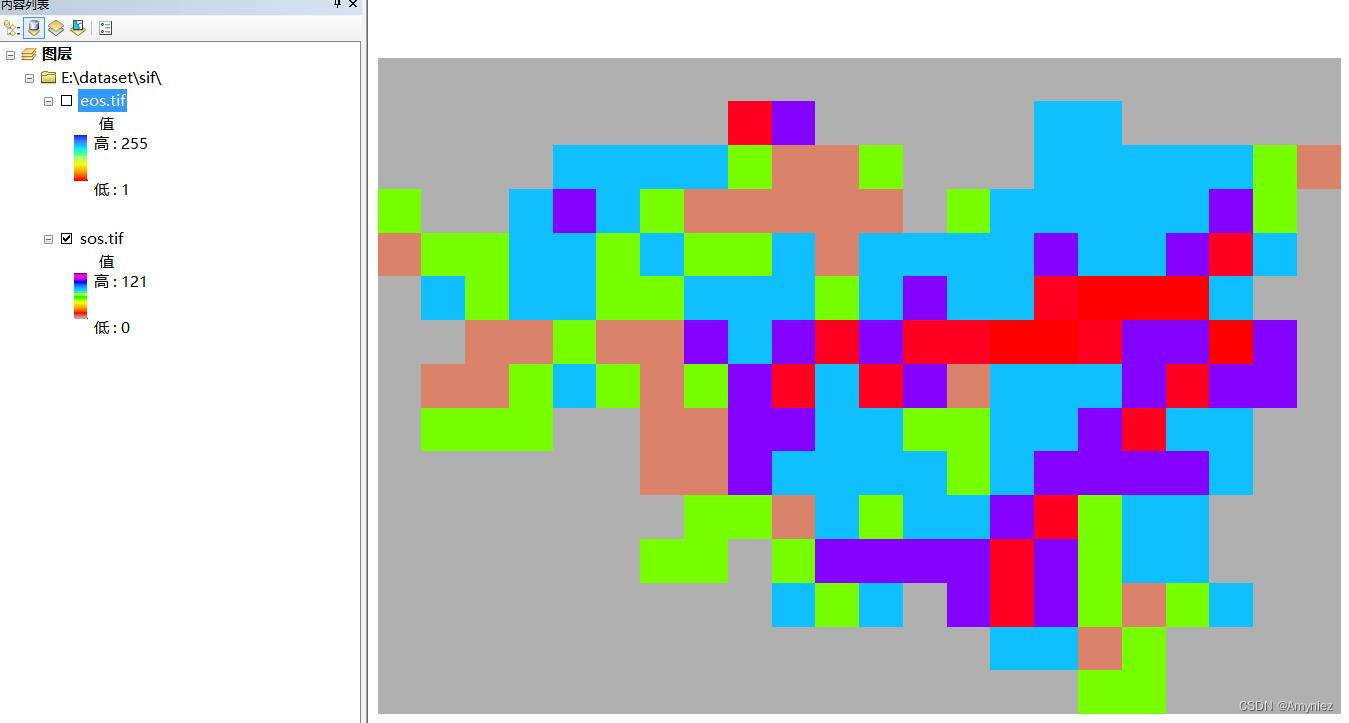
savePaths = efolder + "sos.tif"
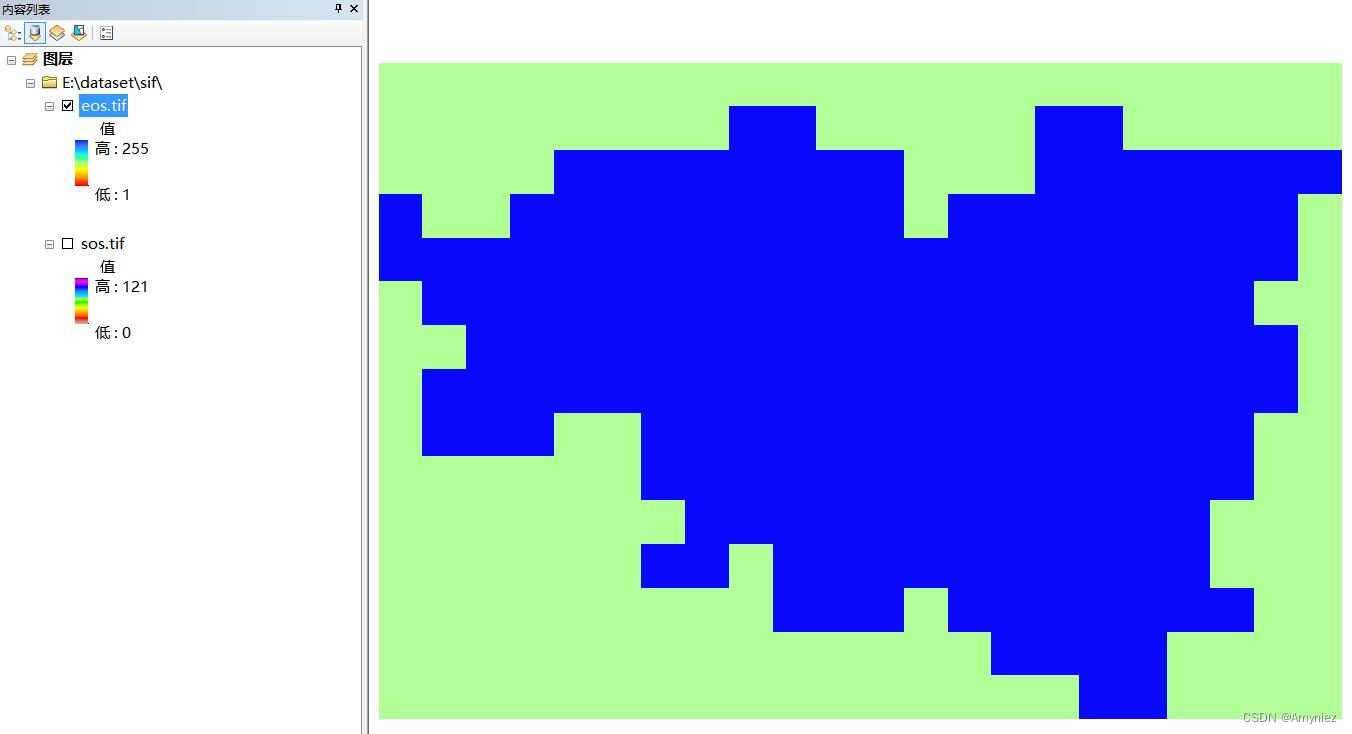
savePathe = efolder + "eos.tif"
writeTiff(sos, Tif_geotrans, Tif_proj, savePaths)
writeTiff(eos, Tif_geotrans, Tif_proj, savePathe)
# 维度还原为原来的维度
SGfilter = SGfilter.swapaxes(1,0)
SGfilter = SGfilter.swapaxes(0,2)
for i in range(SGfilter.shape[0]):
savePath = os.path.splitext(tifNameList[i])[0] + suffix + ".tif"
savePath = efolder + savePath
writeTiff(SGfilter[i], Tif_geotrans, Tif_proj, savePath)
数据导入:
np.random.seed(10)
import time
start = time.time()

SG_filter(r"E:/dataset/sif/2008sif_SG", "_SGFilter", "E:/dataset/sif/2008sifphe/")

end = time.time()
print(end - start)
结果显示: