vue3做echarts做一个简单的折线渐变图
效果
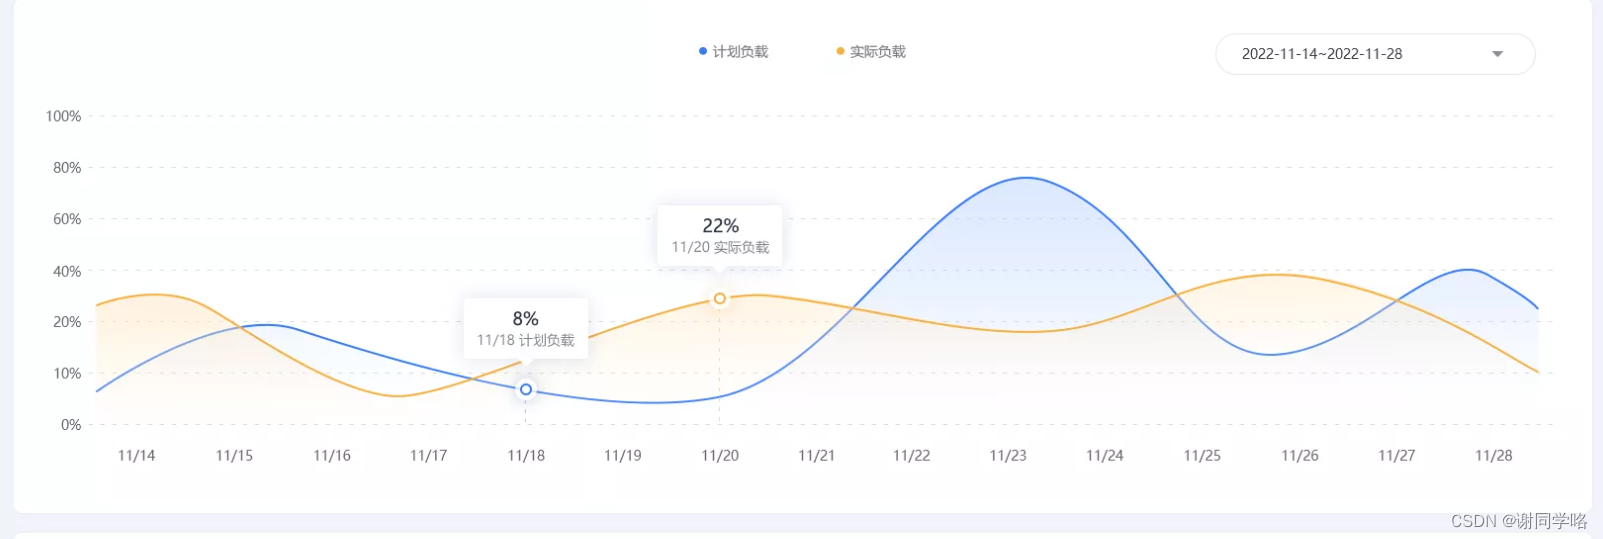
代码:
</template>
<div>
<div class="date-change">
<el-date-picker size="small" v-model="dateValue" value-format="YYYY-MM-DD" type="daterange" range-separator="至" start-placeholder="开始日期" end-placeholder="截至日期" format="YYYY-MM-DD" @change="changeDate($event)" />
</div>
<v-chart :option="lineData" :theme="theme" :autoresize="autoResize" />
</div>
<template>
<script lang="ts">
import { defineComponent, reactive, toRefs } from "vue";
import { CanvasRenderer } from "echarts/renderers";
import { BarChart, LineChart, PieChart, MapChart, RadarChart, ScatterChart, EffectScatterChart, LinesChart } from "echarts/charts";
import { GridComponent, PolarComponent, GeoComponent, TooltipComponent, LegendComponent, TitleComponent, VisualMapComponent, DatasetComponent, ToolboxComponent, DataZoomComponent } from "echarts/components";
import VChart, { THEME_KEY } from "vue-echarts";
use([BarChart, LineChart, PieChart, MapChart, RadarChart, ScatterChart, EffectScatterChart, LinesChart, GridComponent, PolarComponent, GeoComponent, TooltipComponent, LegendComponent, TitleComponent, VisualMapComponent, DatasetComponent, CanvasRenderer, ToolboxComponent, DataZoomComponent]);
export default defineComponent({
components: {
VChart
},
provide: {
[THEME_KEY]: "westeros"
},
setup() {
const data = reactive({
lineData: {
tooltip: {
formatter: "{a} <br/>{b} : {c}% <br/> {a1} <br/> {b1} : {c1}%",
trigger: "axis"
},
color: ["#377AF4", "#F5AE3D"],
legend: {
textStyle: {
color: "#000000",
fontSize: "12"
},
icon: "circle",
left: "center",
data: ["计划负载", "实际负载"]
},
xAxis: {
name: "日期",
boundaryGap: false,
type: "category",
data: []
},
yAxis: {
type: "value",
max: 100,
axisLabel: {
formatter: function (val: number) {
return val + "%";
}
}
},
series: [
{
name: "计划负载",
type: "line",
smooth: true,
label: {
normal: {
position: "top",
textStyle: {
color: "#377AF4",
width: 2
}
}
},
areaStyle: {
color: {
type: "linear",
x: 0,
y: 0,
x2: 0,
y2: 1,
colorStops: [
{
offset: 0,
color: "rgba(185, 210, 255, 0.43)"
},
{
offset: 1,
color: "rgba(237, 243, 255, 0)"
}
],
global: false
}
},
data: []
},
{
type: "line",
name: "实际负载",
smooth: true,
label: {
normal: {
position: "top",
textStyle: {
color: "#377AF4",
width: 2
}
}
},
areaStyle: {
color: {
x: 0,
y: 0,
x2: 0,
y2: 1,
type: "linear",
colorStops: [
{
offset: 0,
color: "rgba(255, 231, 193, 1)"
},
{
offset: 1,
color: "rgba(255, 246, 236, 0)"
}
],
global: false
}
},
data: []
}
] as any
} as any,
theme: "" as any,
autoResize: true as boolean
});
return {
...toRefs(data)
};
}
});
</script>
<style lang="less" scoped>
.echarts {
position: absolute;
width: 100%;
height: 100%;
}
.date-change {
position: absolute;
right: 10px;
z-index: 1;
}
</style>
本文内容由网友自发贡献,版权归原作者所有,本站不承担相应法律责任。如您发现有涉嫌抄袭侵权的内容,请联系:hwhale#tublm.com(使用前将#替换为@)