matplotlib 是一个 Python 的 2D绘图库,用于数据可视化。它可以函数的方式操作各个绘图命令(类似Matlab软件,Matplotlib名字的含义就是Matlab风格的绘图库),也可以以面向对象的方式。
它有以下优点:
绘图质量高,可绘制出版物质量级别的图形。
代码够简单,易于理解和扩展,使绘图变得轻松。
兼容Tex 文本,可编写复杂的数学公式(如带上标下标,希腊字母)。
可嵌入图形用户界面,用于应用程序开发。 免费和开源
导包
import matplotlib.pyplot as plt
一、快速绘图
import numpy as np
x=np.arange(0,1,0.05)
print(x)
[0. 0.05 0.1 0.15 0.2 0.25 0.3 0.35 0.4 0.45 0.5 0.55 0.6 0.65
0.7 0.75 0.8 0.85 0.9 0.95]
y=np.sin(2*np.pi*x)
print(y)
[ 0.00000000e+00 3.09016994e-01 5.87785252e-01 8.09016994e-01
9.51056516e-01 1.00000000e+00 9.51056516e-01 8.09016994e-01
5.87785252e-01 3.09016994e-01 1.22464680e-16 -3.09016994e-01
-5.87785252e-01 -8.09016994e-01 -9.51056516e-01 -1.00000000e+00
-9.51056516e-01 -8.09016994e-01 -5.87785252e-01 -3.09016994e-01]
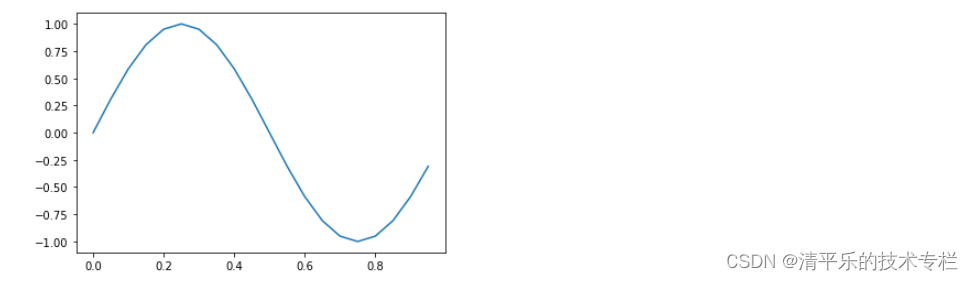
plt.plot(x,y)
plt.show()
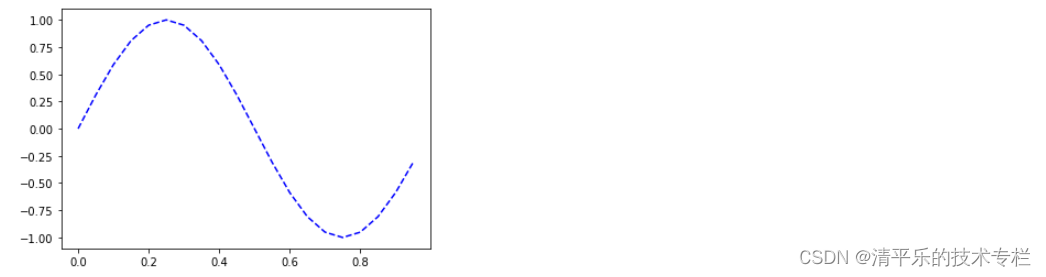
plt.plot(x,y,'b--')
plt.show()
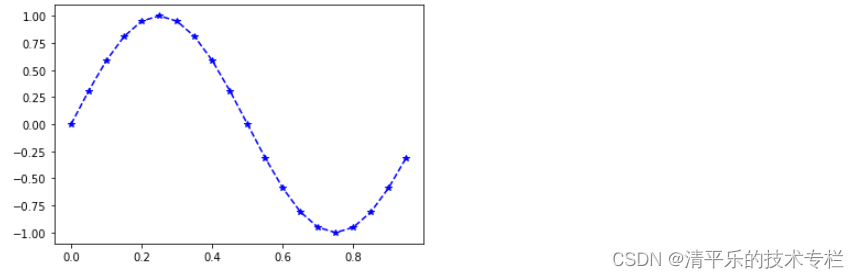
plt.plot(x,y,'b--*')
plt.show()
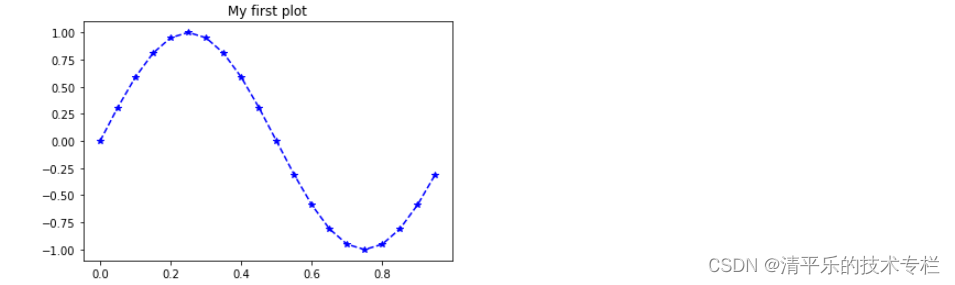
plt.plot(x,y,'b--*')
plt.title('My first plot')
plt.show()
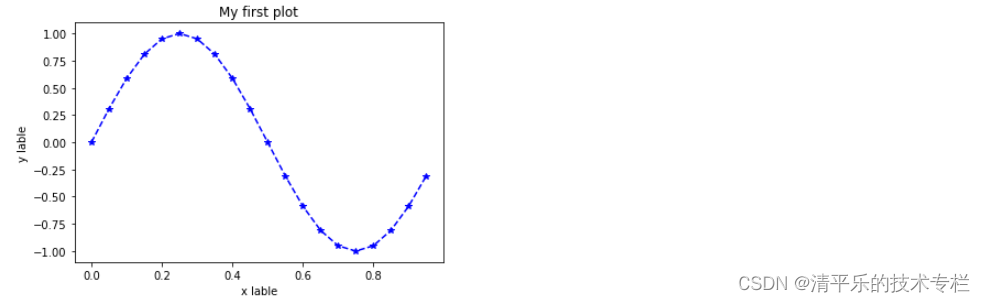
plt.plot(x,y,'b--*')
plt.title('My first plot')
plt.xlabel('x lable')
plt.ylabel('y lable')
plt.show()
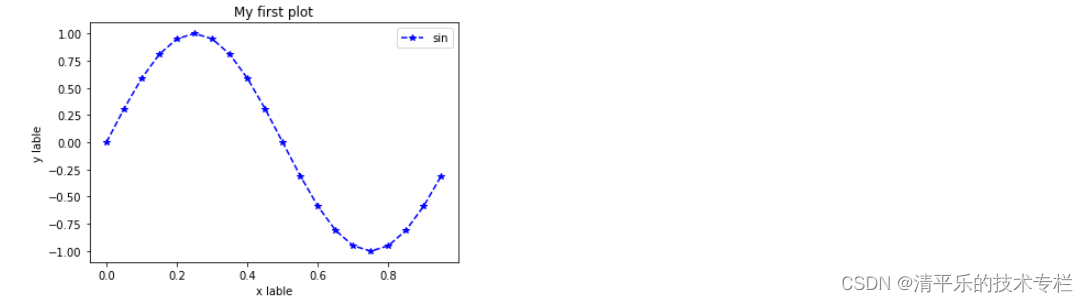
plt.plot(x,y,'b--*',label='sin')
plt.title('My first plot')
plt.xlabel('x lable')
plt.ylabel('y lable')
plt.legend(loc='best')
plt.show()
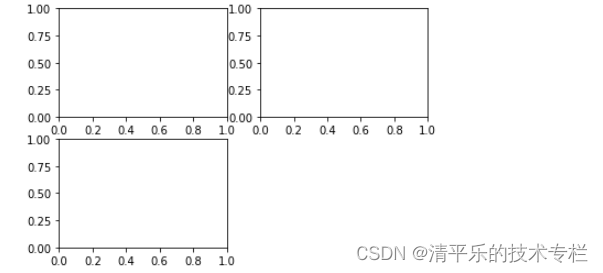
二、添加多个图表 figure和subplot
fig=plt.figure()
ax1=fig.add_subplot(221)
ax2=fig.add_subplot(222)
ax3=fig.add_subplot(223)
plt.show()
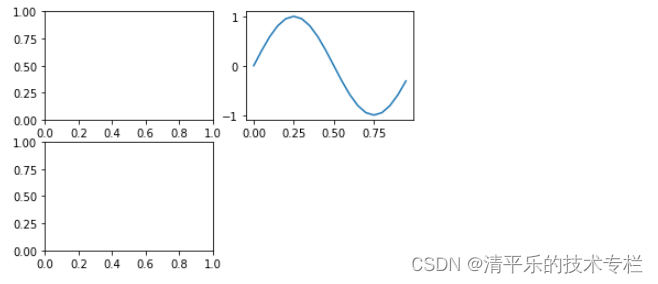
fig=plt.figure()
ax1=fig.add_subplot(221)
ax2=fig.add_subplot(222)
ax3=fig.add_subplot(223)
ax2.plot(x,y)
plt.show()
三、颜色、线条、标记
fig=plt.figure()
ax=fig.add_subplot(111)
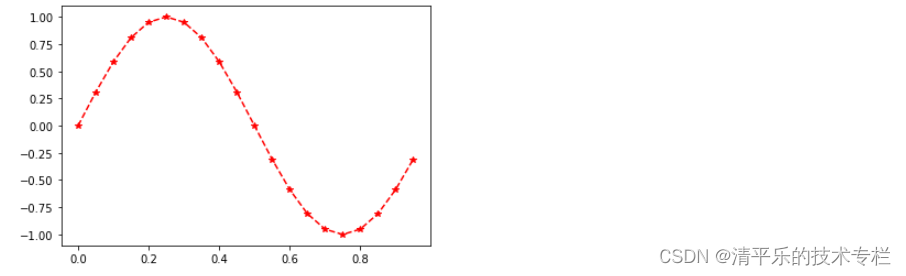
ax.plot(x,y,'r--*')
plt.show()
fig=plt.figure()
ax=fig.add_subplot(111)
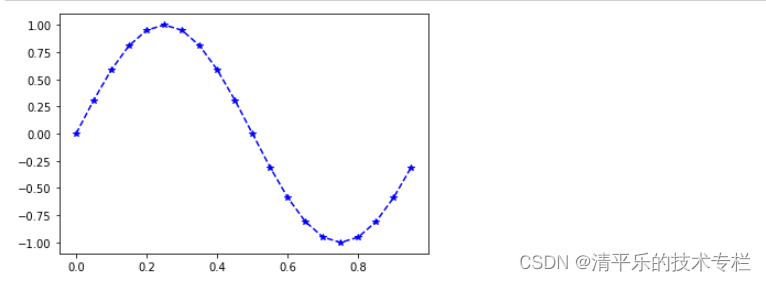
ax.plot(x,y,color='b',linestyle='--',marker='*')
plt.show()
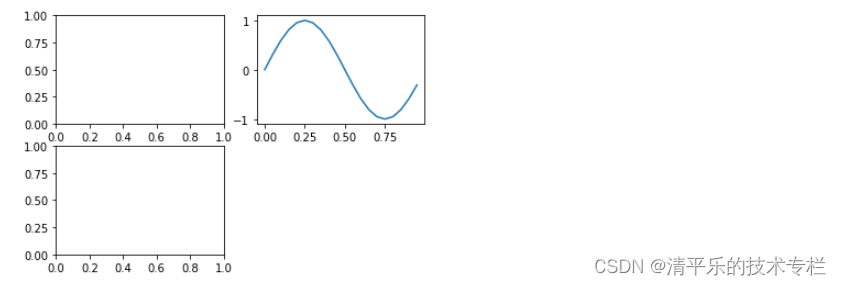
fig=plt.figure()
ax1=fig.add_subplot(221)
ax2=fig.add_subplot(222)
ax3=fig.add_subplot(223)
ax2.plot(x,y)
plt.show()
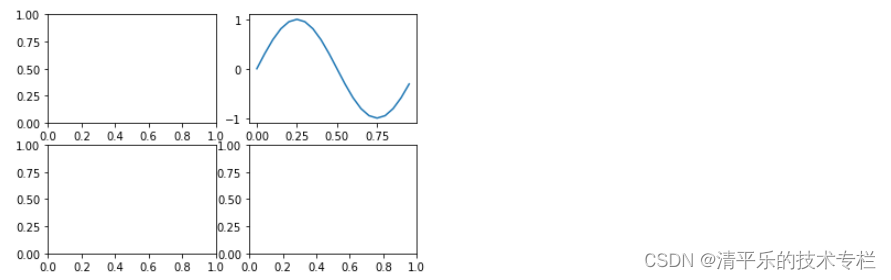
fig,ax=plt.subplots(2,2)
ax[0,1].plot(x,y)
plt.show()
fig,ax=plt.subplots()
ax.plot(x,y,'g--o')
ax.set(title='my first plot',xlabel='x',ylabel='y')
ax.legend(loc='best')
ax.grid()
plt.show()

y2=np.cos(2*np.pi*x)
print(y2)
[ 1.00000000e+00 9.51056516e-01 8.09016994e-01 5.87785252e-01
3.09016994e-01 6.12323400e-17 -3.09016994e-01 -5.87785252e-01
-8.09016994e-01 -9.51056516e-01 -1.00000000e+00 -9.51056516e-01
-8.09016994e-01 -5.87785252e-01 -3.09016994e-01 -1.83697020e-16
3.09016994e-01 5.87785252e-01 8.09016994e-01 9.51056516e-01]
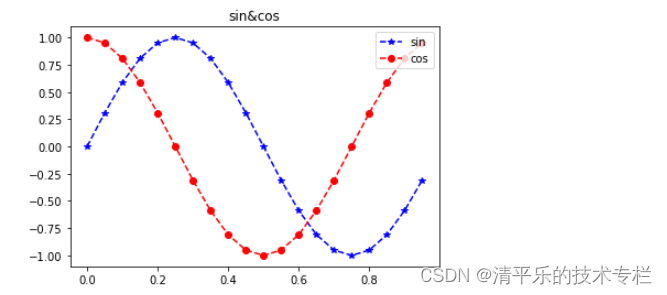
fig,ax=plt.subplots()
ax.plot(x,y,'b--*',label='sin')
ax.plot(x,y2,'r--o',label='cos')
ax.legend(loc='best')
ax.set(title='sin&cos')
plt.show()
四、将图表保存到本地
fig.savefig('myfig.png')
本文内容由网友自发贡献,版权归原作者所有,本站不承担相应法律责任。如您发现有涉嫌抄袭侵权的内容,请联系:hwhale#tublm.com(使用前将#替换为@)