经过相当长的一段时间搜索后,我没有找到解决我的问题的例子:
如何使用 geom_text() 标记 geom_bar(position = 'fill')?
mydf = data.frame(
  'sample' = sample(x = LETTERS[1:3], size = 111,replace = T),
  'category' = sample(x = 1:11, size = 111,replace = T)
)


mydf %>%
  group_by(sample) %>%
  ggplot( aes(fill=sample, x=category)) +
  geom_bar( position="fill" )
 # Does not work: +  geom_text(position='fill', aes(label = ..y..))
Intended outcome: label the % in the middle of the bars, as in the example (except that it shows the count, unlike needed in my case):
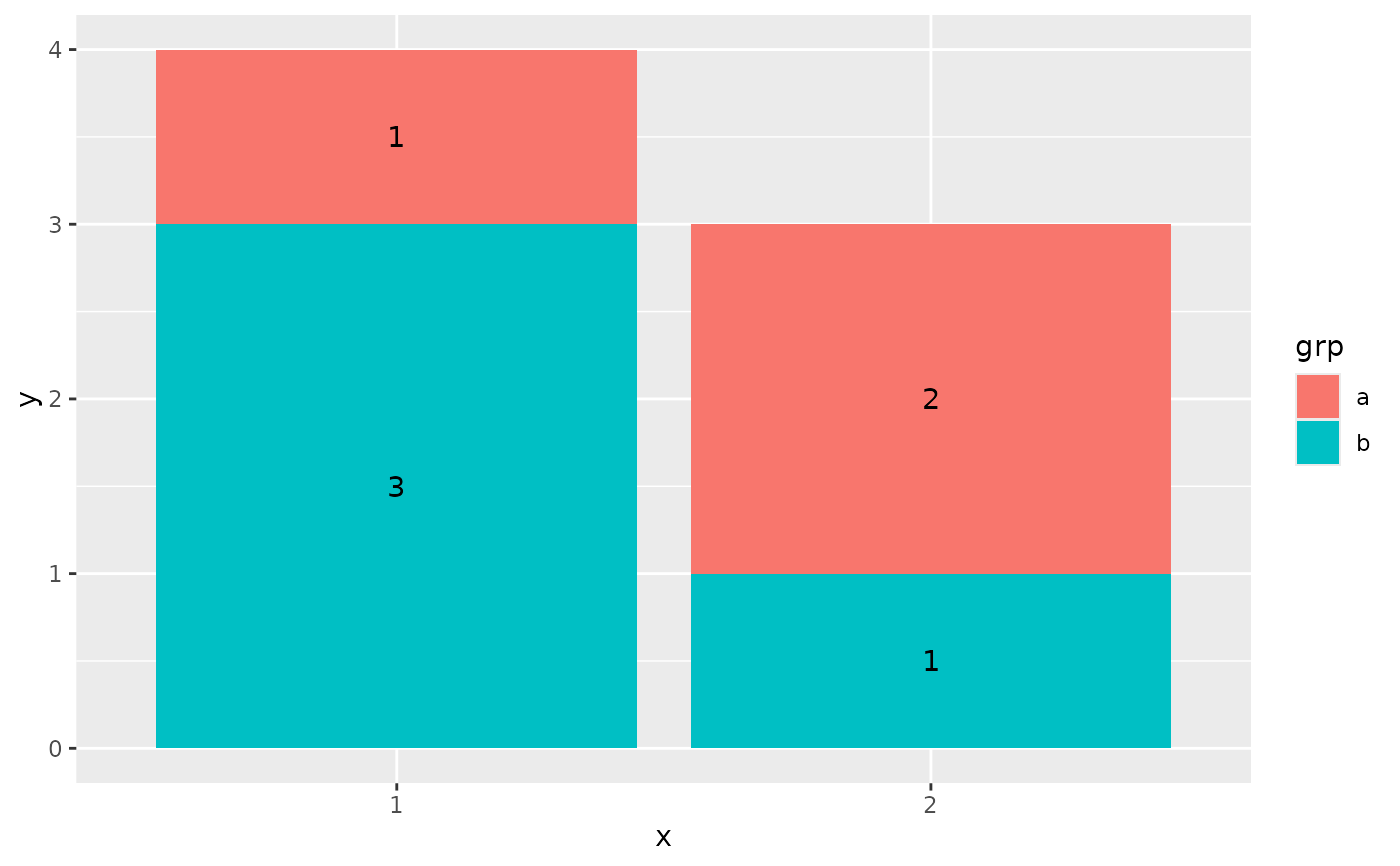 from https://ggplot2.tidyverse.org/reference/geom_text.html https://ggplot2.tidyverse.org/reference/geom_text.html
我想真正的问题是如果我使用 geom_bar(position = 'fill'),“y”和“label”是什么,
我对 ggplot 混合计算(每个类别的比例)与可视化感到困惑。
Thanks!