Document

UNITED STATES SECURITIES AND EXCHANGE COMMISSION
Washington, D.C. 20549
FORM 10-K
(Mark One)
[X] ANNUAL REPORT PURSUANT TO SECTION 13 OR 15(d) OF THE SECURITIES EXCHANGE ACT OF 1934
For the fiscal year endedDecember 31, 2018
OR
[ ] TRANSITION REPORT PURSUANT TO SECTION 13 OR 15(d) OF THE SECURITIES EXCHANGE ACT OF 1934
For the transition period from _______ to _______
Commission File Number 1-3671
GENERAL DYNAMICS CORPORATION
(Exact name of registrant as specified in its charter)
Delaware13-1673581
State or other jurisdiction of incorporation or organizationIRS Employer Identification No.
2941 Fairview Park Drive, Suite 100
Falls Church, Virginia22042-4513
Address of principal executive officesZip code
Registrant’s telephone number, including area code:
(703) 876-3000
Securities registered pursuant to Section 12(b) of the Act:
Title of each className of exchange on which registered
Common stock, par value $1 per shareNew York Stock Exchange
Securities registered pursuant to Section 12(g) of the Act:
None
Indicate by check mark if the registrant is a well-known seasoned issuer, as defined in Rule 405 of the Securities Act. YesüNo ___
Indicate by check mark if the registrant is not required to file reports pursuant to Section 13 or Section 15(d) of the Act. Yes ___ Noü
Indicate by check mark whether the registrant (1) has filed all reports required to be filed by Section 13 or 15(d) of the Securities Exchange Act of 1934 during the preceding 12 months (or for such shorter period that the registrant was required to file such reports), and (2) has been subject to such filing requirements for the past 90 days. YesüNo ___
Indicate by check mark whether the registrant has submitted electronically every Interactive Data File required to be submitted pursuant to Rule 405 of Regulation S-T (§232.405 of this chapter) during the preceding 12 months (or for such shorter period that the registrant was required to submit such files). YesüNo ___
Indicate by check mark if disclosure of delinquent filers pursuant to Item 405 of Regulation S-K (§229.405 of this chapter) is not contained herein, and will not be contained, to the best of registrant’s knowledge, in definitive proxy or information statements incorporated by reference in Part III of this Form 10-K or any amendment to this Form 10-K. _ü_
Indicate by check mark whether the registrant is a large accelerated filer, an accelerated filer, a non-accelerated filer, a smaller reporting company, or an emerging growth company. See the definitions of “large accelerated filer,” “accelerated filer,” “smaller reporting company,” and “emerging growth company” in Rule 12b-2 of the Exchange Act.
Large accelerated filerüAccelerated filer __ Non-accelerated filer __ Smaller reporting company __ Emerging growth company __
If an emerging growth company, indicate by check mark if the registrant has elected not to use the extended transition period for complying with any new or revised financial accounting standards provided pursuant to Section 13(a) of the Exchange Act. __
Indicate by check mark whether the registrant is a shell company (as defined in Rule 12b-2 of the Exchange Act). YesNoü
The aggregate market value of the voting common equity held by non-affiliates of the registrant was$48,890,306,362as ofJuly 1, 2018(based on the closing price of the shares on the New York Stock Exchange).
288,235,928shares of the registrant’s common stock, $1 par value per share, were outstanding onJanuary 27, 2019.
DOCUMENTS INCORPORATED BY REFERENCE:
Part III incorporates by reference information from certain portions of the registrant’s definitive proxy statement for the2019annual meeting of shareholders to be filed with the Securities and Exchange Commission within 120 days after the close of the fiscal year.
1
INDEX
2
PARTI
ITEM 1.BUSINESS
(Dollars in millions, except per-share amounts or unless otherwise noted)
BUSINESS OVERVIEW
General Dynamics is a global aerospace and defense company that offers a broad portfolio of products and services in business aviation; combat vehicles, weapons systems and munitions; information technology (IT) services; C4ISR (command, control, communications, computers, intelligence, surveillance and reconnaissance) solutions; and shipbuilding and ship repair.
General Dynamics was incorporated in Delaware in 1952. Long periods of growth, organic and inorganic, defined our early history leading up to the early 1990s, when we shed most elements of our portfolio with the exception of military vehicles and submarines. We took subsequent actions beginning in the mid-1990s that laid the foundation for modern-day General Dynamics, including acquiring Gulfstream Aerospace Corporation, combat-vehicle businesses, IT services and C4ISR solutions companies, and additional shipyards.
During 2018, we continued to position our company for future growth and superior profitability. On April 3, 2018, we completed the acquisition of CSRA Inc. (CSRA), our largest acquisition to date. Combining CSRA with our General Dynamics Information Technology (GDIT) business unit created a premier provider of IT solutions to the defense, intelligence and federal civilian markets.
Concurrent with the acquisition, for segment reporting purposes, we reorganized our Information Systems and Technology operating segment into two separate segments: Information Technology and Mission Systems. Our company now has five operating segments: Aerospace, Combat Systems, Information Technology, Mission Systems and Marine Systems. The latter four segments we collectively refer to as our defense segments. Prior-period segment information has been restated for this change.
Some of our segments consist of multiple business units. Each business unit is responsible for its strategy and operational performance, emphasizing the importance of flexibility and agility for those closest to the customer. Our corporate headquarters sets the overall strategy and governance for the company and is responsible for allocating and deploying capital. Our Ethos—based upon honesty, transparency, trust and alignment—undergirds our culture, our business model and our decision-making.
We are focused on delivering superior shareholder returns by exceeding our customers’ expectations and committing to operational excellence. Our priorities are executing on backlog; managing costs; implementing continuous improvement; and maximizing earnings, cash and return on invested capital.
Following is additional information on each of our operating segments.
AEROSPACE
Our Aerospace segment is at the forefront of the business-jet industry. The segment consists of our Gulfstream and Jet Aviation business units. We offer a family of Gulfstream aircraft and provide a full range of services for business aircraft produced by Gulfstream and other original equipment manufacturers (OEMs). We have earned our reputation through:
3
•superior aircraft design, quality, performance, safety and reliability;•technologically advanced flight deck and cabin systems; and•industry-leading customer support.
Gulfstream designs, manufactures and supports the world’s most technologically advanced business-jet aircraft. Our product line encompasses aircraft across a variety of price and performance options for mid- to ultra-large-cabin business jets. The many combinations of range, speed, size and cabin customization generate aircraft best suited for each customer’s unique requirements.
Our disciplined and proven approach to new product development allows us to repeatedly introduce first-to-market capabilities that set industry standards for performance, quality, speed and comfort. Our continual investment in research and development leads to new aircraft that consistently broaden customer offerings while raising the bar on safety and performance. Product enhancement and development efforts include initiatives in advanced avionics, composites, renewable fuels, flight-control systems, acoustics, cabin technologies and vision systems.
In 2018, our next-generation, clean-sheet aircraft—the G500—received certification from the U.S. Federal Aviation Administration (FAA). The first G500 customer delivery took place in the third quarter of 2018. The G600 is making progress towards its certification, and the first G600 is slated for delivery in 2019. These aircraft are the latest examples of our commitment to performance, safety, efficiency and innovation. Both aircraft exceeded original performance projections during their rigorous flight test programs, demonstrating their industry-leading capabilities. At Mach 0.85, the G500 can fly 5,200 nautical miles, and the G600 can fly 6,500 nautical miles.
The ultra-long-range, ultra-large-cabin G650 created a new market when it entered service in 2012. The fastest non-supersonic aircraft to circumnavigate the globe, the G650 has flown around the world in record-setting time. Together, the G650 and G650ER have claimed more than 85 world speed records. The G650 was the distinguished recipient of the National Aeronautic Association’s Robert J. Collier Trophy, an annual award recognizing the greatest achievement in U.S. aeronautics or astronautics for performance, efficiency and safety. In 2018, the G650 demonstrated steep approach capabilities at London City Airport, unlocking even greater customer utility. Today, there are more than 325 G650 and G650ER aircraft operating in more than 40 countries. Interest in the G650 remains strong; its capabilities, reliability and installed base make it the business-jet standard around the globe.
Gulfstream continued its history of innovation in 2018, becoming the first civil aircraft manufacturer to offer electronically linked active control sidesticks that allow pilots to feel each other’s input as well as those from the auto pilot, increasing situational awareness and enhancing safety. Gulfstream also followed up on its history-making certification of the enhanced vision system by becoming the first OEM to certify use of the system to touchdown and rollout.
Gulfstream designs, develops and manufactures aircraft in Savannah, Georgia, including manufacturing all large-cabin models. The mid-cabin G280 is assembled by a non-U.S. partner. All models are outfitted in Gulfstream’s U.S. facilities. In support of Gulfstream’s growing aircraft portfolio and customer base, we continue to invest in our facilities. At our Savannah campus, we have constructed facilities, including purpose-built G500, G600 and G650 manufacturing facilities; increased aircraft service capacity; and opened a new customer support distribution center and dedicated research and development centers.
We offer comprehensive support for our more than 2,700 Gulfstream aircraft in service around the world and operate the largest factory-owned service network in the industry. We operate a 24-hour-per-day/365-day-per-year Customer Support Center and offer on-call Gulfstream aircraft technicians ready to deploy around the world for customer-service requirements. In 2018, we opened a state-of-the-art Sales and Design
4
Center in midtown Manhattan, elevating the customer experience to enhance our position in one of the world’s largest business-aviation markets.
We are always evolving our Customer Support business along with our growing customer base, and 2018 was no exception. We announced the construction of new service centers in Appleton, Wisconsin; West Palm Beach, Florida; Farnborough, United Kingdom; and Savannah. We also announced the creation of a center dedicated to the resolution of customer issues by a co-located team of technical experts and multidisciplinary personnel from across the organization, providing Gulfstream operators with an unprecedented level of integrated support and ensuring faster return to service of customer aircraft. Resources include multiple field and airborne support teams (FAST) aircraft to deliver mission-critical parts, tools and technicians; more than 150 field service representatives and FAST-dedicated technicians, including over 12 mobile repair teams with specially-equipped vehicles; approximately $2 billion in spares at over 20 locations; and a network of more than 30 company-owned and factory-authorized service centers and authorized warranty facilities.
Jet Aviation has been a global leader in business-aviation services for over 50 years, providing comprehensive services and an extensive network of locations for aircraft owners and operators. With approximately 50 airport facilities throughout North America, Europe, the Middle East and Asia Pacific, our service offerings include maintenance, fixed-base operations (FBO), government fleet services, aircraft management, charter and staffing services.
In 2018, we acquired Hawker Pacific, a leading provider of integrated aviation solutions across Asia Pacific and the Middle East. Hawker Pacific added 19 locations, including 7 FBOs and 14 maintenance, repair and overhaul (MRO) facilities to our global footprint. In separate transactions, we expanded our FBO presence in St. Louis, Missouri; and Amsterdam and Rotterdam, the Netherlands.
In addition to these capabilities, Jet Aviation offers custom completions for narrow- and wide-body aircraft. In 2018, Jet Aviation opened a new 94,000 square foot wide-body hangar in Basel, Switzerland, constructed to meet increased demand for wide-body completions and refurbishments. The new state-of-the-art hangar can accommodate several wide- and narrow-body projects simultaneously.
As a market leader in the business-aviation industry, the Aerospace segment is focused on developing innovative first-to-market technologies and products; providing exemplary service to customers globally; and driving efficiencies in aircraft production, completions and services.
Revenue for the Aerospace segment was23%of our consolidated revenue in2018and26%in2017and2016. Revenue by major products and services was as follows:
Year Ended December 31201820172016
Aircraft manufacturing and completions$6,226$6,320$6,074
Aircraft services2,0961,7431,625
Pre-owned aircraft13366116
Total Aerospace$8,455$8,129$7,815
5
COMBAT SYSTEMS
Our Combat Systems segment offers combat vehicles, weapons systems and munitions for the U.S. government and its non-U.S. partners. We are a platform solutions provider, offering market-leading design, development, production, modernization and sustainment services. With extensive and proven product lines, we deliver tailored solutions for diverse customer mission needs. Our Combat Systems segment consists of three business units: European Land Systems, Land Systems, and Ordnance and Tactical Systems. The segment’s product lines include:•wheeled combat and tactical vehicles;•main battle tanks and tracked combat vehicles;•weapons systems, armament and munitions; and•maintenance, logistics support and sustainment services.
Wheeled combat and tactical vehicles:The segment provides a full range of vehicles to our global customer base.
The Stryker is an eight-wheeled, medium-weight combat vehicle that combines mobility and survivability. There are 11 Stryker variants with 85% commonality across the fleet. We continue to innovate and demonstrate ways in which the Stryker can be modified to address the U.S. Army’s urgent operational needs. In 2015, the Army identified a requirement to increase Stryker lethality, and through internal research and development (R&D) and accelerated acquisition, we developed a 30-millimeter, remotely operated cannon option. We delivered the first prototype in 2016, 15 months after the initial contract award. The first production vehicle was sent to the Germany-based 2nd Cavalry Regiment in December 2017; production and delivery is now complete. The Army is expected to make a decision in 2019 to extend this capability to the other Stryker brigades.
In 2018, the Army made the decision to upgrade all nine Stryker brigades to the Stryker A1 configuration. We are currently under contract for two of the brigades, with estimated completion in 2021. The Stryker A1 builds upon the combat-proven double-V-hull (DVH) configuration, providing significantly higher rates of survivability against mines and improvised explosive devices. In addition to the DVH survivability, the Stryker A1 provides a 450-horsepower engine, 60,000-pound suspension, 910-amp alternator and in-vehicle network. It is among the most versatile, mobile and safest personnel carriers in the entire Army inventory.
The Stryker Maneuver Short-Range Air Defense Launcher (M-SHORAD) program integrates an air defense mission package onto a reconfigured Stryker A1 vehicle. The M-SHORAD vehicle is another variation we quickly developed to address the Army’s directed requirement to counter closer-in air and missile defense threats. In 2018, we received an order to integrate five Strykers into the M-SHORAD configuration for delivery in 2019. We continue to work on high-energy laser and mobile command post options. We expect the Stryker platform to continue to demonstrate its versatility well into the future.
The segment also has a market-leading position in light armored vehicles (LAVs) with more than 13,000 vehicles in service around the world. Our LAVs combine advanced technologies and combat-proven survivability. We are upgrading the Canadian Army’s fleet of LAVs to increase mobility, survivability and lethality, as well as enhancing the vehicle’s surveillance suite. We also provide, under a contract with the Canadian government, wheeled armored vehicles for export and associated logistics through 2024.
We deliver high-mobility, versatile Pandur and Piranha armored vehicles to non-U.S. customers. The Pandur family of vehicles serves as a common platform for various armament and equipment configurations. The Piranha is a multi-role vehicle well-suited for a variety of combat operations. We are supplying Pandur 6x6 vehicles to the Austrian Army. In 2018, we received a contract for over $1 billion to deliver up to 227 Piranha vehicles in six variants to the Romanian Armed Forces. We are delivering more than 300 Piranha
6
vehicles, also in six variants, to the Danish Ministry of Defence for its armored personnel carrier program. The Spanish Army selected the Piranha as its 8x8 armored fighting vehicle, and we are now performing extensive technological trials in anticipation of a production contract. We are also producing Piranha vehicles for Ireland and Switzerland. There are over 11,000 Piranhas in service worldwide.
The segment also offers a range of light tactical vehicles to global customers. The Flyer is a lightweight, modular vehicle built for speed and mobility that grants access to previously unreachable terrain in demanding environments. We are delivering this family of vehicles to the U.S. Special Operations Command and the Army. In 2018, we delivered the first Army-Ground Mobility Vehicle (A-GMV) 1.1. Outside the United States, the Duro and Eagle vehicles offer a range of options and weight classes. We are upgrading Duro tactical vehicles for the Swiss Army through 2022 and began delivering Eagle armored patrol vehicles to the Danish Army in 2018.
In 2018, we acquired FWW Fahrzeugwerk GmbH, a maintenance and service provider for the German army and other non-U.S. customers, and formed General Dynamics European Land Systems – Deutschland, enhancing our presence in the country.
Main battle tanks and tracked combat vehicles:The segment’s powerful tracked vehicles provide key combat capabilities to customers around the world. The Abrams main battle tank offers a proven, decisive edge in combat. We are maximizing the effectiveness and lethality of the U.S. Army’s M1A2 Abrams tank fleet with the System Enhancement Package Version 3 (SEPv3), which provides technological advancements in communications, power generation, fuel efficiency and armor. In 2018, we received orders to upgrade 274 Abrams tanks to the SEPv3 configuration. Additionally, the segment is upgrading Abrams tanks for several non-U.S. partners. We are currently under contract to develop further upgrades for the SEPv4 configuration.
In 2018, we were selected to deliver 12 medium-weight, large caliber prototype vehicles for the U.S. Army’s Mobile Protected Firepower program, providing a new opportunity to field vehicles in Infantry Brigade Combat Team (IBCT) formations. The vehicles are required to be highly lethal, survivable and mobile.
We are producing the British Army’s AJAX armoured fighting vehicle, a next-generation medium-weight tracked combat vehicle. The segment will also provide in-service support for the AJAX vehicle fleet. With six variants, the AJAX family of vehicles offers advanced electronic architecture and proven technology for an unparalleled balance of survivability, lethality and mobility, along with high reliability for a vehicle in its weight class. In 2017 and 2018, the AJAX vehicles underwent extensive testing trials in preparation for delivery to the British Army, including successful manned live firing trials. The vehicle is scheduled to enter service in 2020.
With our large installed base of wheeled and tracked vehicles around the world and expertise gained from innovative research, engineering and production programs, we are well-positioned for modernization programs, support and sustainment services, and future development programs.
Weapons systems, armament and munitions:Complementing these military-vehicle offerings, the segment designs, develops and produces a comprehensive array of sophisticated weapons systems. For ground forces, we manufacture M2/M2-A1 heavy machine guns and MK19/MK47 grenade launchers. The segment also produces legacy and next-generation weapons systems for shipboard applications. For airborne platforms, we produce weapons for fighter aircraft, including high-speed Gatling guns for all U.S. fixed-wing military aircraft.
Our munitions portfolio covers the full breadth of naval, air and ground forces applications across all calibers and weapons platforms for the U.S. government and its allies. In North America, the segment
7
maintains a market-leading position in the supply of Hydra-70 rockets, large-caliber tank ammunition, medium-caliber ammunition, mortar and artillery projectiles, tactical missile aerostructures, and high-performance warheads; military propellants; and conventional bombs and bomb cases.
The Combat Systems segment emphasizes operational excellence and continuous improvement in a dynamic threat environment with ever-evolving customer needs. One of the U.S. Army’s top priorities is readiness of its platform products through critical modernization efforts, including upgrades for both the Abrams main battle tank and Stryker wheeled combat-vehicle programs. We are focused on innovation, affordability and speed-to-market to deliver increased performance, survivability and mission-effective products.
Revenue for the Combat Systems segment was17%of our consolidated revenue in2018,19%in2017and18%in2016. Revenue by major products and services was as follows:
Year Ended December 31201820172016
Military vehicles$4,027$3,731$3,378
Weapons systems, armament and munitions1,7981,6331,517
Engineering and other services416585635
Total Combat Systems$6,241$5,949$5,530
INFORMATION TECHNOLOGY
Our Information Technology segment was formed in 2018 concurrent with our acquisition of CSRA and the reorganization of our legacy Information Systems and Technology segment into two separate segments: Information Technology and Mission Systems. The combination of GDIT and CSRA created a premier provider of technology solutions and mission services to help customers across defense, intelligence and federal civilian markets advance mission performance and transform operations. Integrating these two businesses has enhanced our ability to develop cost-effective, next-generation technology solutions, leverage our expanded and deep experience across multiple agencies and pursue large-scale enterprise solutions for our customers.
We partner with our customers to provide critical services and solutions that draw upon multiple technological capabilities, deliver value and solve our customers’ complex challenges, including cloud, cyber, software development, systems engineering, IT modernization and data analytics. Additionally, we advance our customers’ missions through innovative delivery models, including outcome-based contracts and a relentless focus on execution. Our portfolio includes thousands of individual contracts that predominantly align to three broad capability categories:•IT services;•IT infrastructure modernization; and•professional services.
IT services:IT services include technology consulting, solution design, system integration, operations and maintenance, cloud services, applications development, and cyber defense of enterprise systems.
The Information Technology segment manages global IT enterprise operations for its customers, including in the classified domain, providing IT support, operations and maintenance, applications development, and cloud and cyber services. For the Centers for Medicare & Medicaid Services, we provide IT hosting and operations and maintenance services in support of claims processing for more than 49 million Medicare beneficiaries. At the Pentagon, we provide cybersecurity services that include end-point security, network security and incident handling.
8
In 2018, we were awarded a multi-year, large-scale contract with the FAA to develop a Data Visualization, Analysis, and Reporting System. This system enables the FAA to modernize and provide updated flight reporting, visualization, modeling and analysis capabilities for FAA air traffic management analysts and engineers. Our IT services work in the intelligence and national security domain also expanded in 2018 following a large multi-year contract award from a classified customer. Under the new program, we will provide IT service operations, maintenance support and critical mission services for the customer.
IT infrastructure modernization:IT infrastructure modernization includes system development and engineering; data center consolidation; and cloud strategy, migration and operations.
The Information Technology segment provides managed data center services to the Department of Homeland Security, migrating and consolidating data center operations while introducing new technologies to improve security and mission performance. We also provide IT modernization services for our defense and national security customers, including designing, building and operating global enterprise IT infrastructures.
In 2018, we were awarded a multi-year contract by the U.S. Environmental Protection Agency (EPA) to develop, implement and operate an enterprise approach to the agency’s local area networks at the EPA’s headquarters and more than 100 offices nationwide.
Professional services:Our professional services portfolio includes logistics and supply chain management; training and simulation; and life sciences, medical research and specialized mission support services.
The Information Technology segment provides comprehensive supply chain management for the Department of State’s Bureau of Diplomatic Security. We procure, warehouse, package, transport and deliver a variety of security-related products, including more than six million items to support the customer’s worldwide missions. In our defense portfolio, we provide turnkey training and simulation services for the U.S. Army’s Aviation Center of Excellence in Fort Rucker, Alabama, the largest helicopter flight training program in the world.
In 2018, we were also awarded a large-scale, multi-year contract to provide communication specialists and personnel for mission support, planning, logistics and security services for a classified customer.
We continue to assess and refine our key capabilities in the Information Technology segment’s portfolio. Subsequent to the CSRA acquisition, we completed additional portfolio shaping, divesting non-core work operating public-facing contact centers.
As a segment that focuses exclusively on providing services, our highly skilled workforce is central to our success. Their technical expertise, deep knowledge of our customers’ missions and needs, and constant drive to improve performance differentiate our services.
Revenue for the Information Technology segment was$8.3 billionin2018and$4.4 billionin2017and2016, which represented23%,14%and15%of our consolidated revenue in each of the respective years.
MISSION SYSTEMS
Our Mission Systems segment was formed in 2018 upon the reorganization of our legacy Information Systems and Technology segment into two separate segments: Information Technology and Mission Systems.
Our Mission Systems segment is a global provider of mission-critical C4ISR products and systems. We offer solutions across all domains, and we embrace agility to improve the speed of capability to mission. In
9
2018, we introduced increasingly sophisticated offerings in areas including high-end encryption, and we acquired a provider of specialized transmitters and receivers.
The Mission Systems segment has more than 100 locations worldwide and employs more than 13,000 engineering and technical professionals dedicated to solving the toughest security and technology challenges facing the United States and its partners. The segment’s portfolio includes prime contract programs in which we deliver high-end defense-electronics hardware and integrated systems, as well as subcontract efforts in support of large-scale land, air, sea and space platforms. The segment is organized into three core capabilities:•Space, intelligence and cyber systems;•Ground systems and products; and•Naval, air and electronic systems.
Space, intelligence and cyber systems:Our Mission Systems segment engineers space payloads for advanced missions, builds and manages spaceborne and ground-based communications systems, and provides mission-data tracking equipment and processing capabilities for our customers. Additionally, we design and develop high-performance sensors to gather intelligence data from across the land, air, sea, space and cyber domains, and provide geospatial intelligence products and services to meet the needs of our customers in the global defense, civilian and commercial markets.
We also offer a variety of cyber products and software, including our family of encryption products, to protect and defend our customers’ critical information. We continually evolve our TACLANE family of network encryptors, the most widely deployed NSA-certified Type 1 in-line network encryptors, and our NSA-certified ProtecD@R family of data-at-rest encryptors. In 2018, we introduced the TACLANE-Nano compact Type 1 encryptor for mobile users, designed to protect information classified up to top secret/sensitive compartmented information (TS/SCI), pending NSA certification.
Ground systems and products:Our Mission Systems segment is a leading manufacturer and integrator of tactical, secure communications systems for a diverse customer base, both U.S. and non-U.S. We design, build, deploy and support satellite communications (SATCOM) equipment; mission command applications; assured position, navigation and timing components; and other communications equipment and networking solutions for the U.S. defense community and U.S. partners. We also provide communications equipment, sensors and software for public safety applications and to the federal government. Additionally, we provide data collection and processing products, command and control applications, and computing and communications equipment.
In 2018, we were awarded the contract for the U.S. Army’s Common Hardware Systems-5 (CHS-5) program. CHS is a “one-stop shop” for tactical IT hardware solutions supporting more than 120 Army and other Department of Defense programs for the rapid acquisition and delivery of commercial off-the-shelf IT hardware and services.
We support the Army’s readiness priorities through our contract for the Army Life Cycle Product Line Management (LCPM) program, awarded jointly in 2018 to our Mission Systems and Information Technology segments. The LCPM program provides soldiers a realistic live training experience and adds hardware product line management to our existing software product line management for the Army. We focus primarily on the extensive Live Training Transformation (LT2) family of training systems, including force-on-force and force-on-target systems, and training and instrumentation.
We are also the prime contractor for the Army’s mobile communications backbone, which provides a secure and resilient network, on-the-move capabilities, and the ability to rapidly insert new technologies into the system. We continue to work closely with our Army customer to evolve its next-generation combat network to meet the threats of the future.
10
With a 50-year legacy in radio frequency communications and networks, the Mission Systems segment offers a range of radio products and systems for military, government and commercial customers, as well as long-term evolution broadband communications networks for first responders. We provide CM-300/350 V2 digital radios to the FAA, used by air traffic control centers, commercial airports, military air stations and range installations for reliable ground-to-air communications.
We also provide many capabilities to non-U.S. agencies and commercial customers. We have developed, deployed, and continue to modernize and support fully integrated, secure combat voice and data networks for Canada and the U.K. These efforts, which we have supported for over 27 years, are ongoing on the Morpheus program, which aims to modernize the U.K.’s communications and command-and-control systems across three armed services by evolving the Bowman network into a more open, agile architecture.
In Canada, our public-safety-focused communication system, the SHIELD Ecosystem, allows first responders to gather and exchange information quickly using digital applications on secure systems, providing the availability and location of in-field personnel at all times.
Naval, air and electronic systems:We provide platform integration services for maritime and aviation platforms, as well as strategic weapons systems and advanced electronic systems, including computing systems, displays and data management, for both U.S. and non-U.S. customers.
We have a 50-year legacy of providing advanced fire-control systems for all of the Navy’s submarine programs, both attack and ballistic missile. We are developing and integrating commercial off-the-shelf software and hardware upgrades to improve the tactical control capabilities for several submarine classes. The segment’s combat and seaframe control systems serve as the technology backbone for the Navy’s Independence-variant Littoral Combat Ship (LCS) and the Expeditionary Fast Transport (EPF) ships.
We also manufacture unmanned undersea vehicles for the U.S. military and commercial customers. We offer a range of systems and configurations, including more than 70 different sensors on 80 vehicles that can operate in the open ocean and constrained waterways.
Our Digital Modular Radio (DMR) is the first software-defined radio to become a communications system standard for the U.S. Navy. The DMR is a four-channel radio that serves as the Navy’s communications hub for surface ships, submarines and shore-site communications. As a multi-channel radio, it simultaneously communicates with a wide spectrum of tactical radios and can communicate information at different security levels. In 2018, we released an updated Mobile User Objective System (MUOS) WFv3.1.5 waveform for the Navy’s DMR, improving secure voice, video and data communications across the MUOS SATCOM network. The network was approved by the U.S. Strategic Command in 2018 for expanded operational use.
For airborne platforms, we offer high-assurance mission and display systems, signal and sensor processing, and command-and-control solutions. Our mission computers provide pilots with advanced situational awareness and combat systems control. Our avionics, radomes, or encrypted communication systems are present on nearly every U.S. military aircraft in service today, including the F-35, F-16, F/A-18, F-22, P-3, P-8 and AV-8B.
Revenue for the Mission Systems segment was$4.7 billionin2018,$4.5 billionin2017and$4.7 billionin2016, which represented13%of our consolidated revenue in2018and15%in2017and2016.
11
MARINE SYSTEMS
Our Marine Systems segment is a market-leading designer and builder of nuclear-powered submarines, surface combatants, and auxiliary and combat-logistics ships for the U.S. Navy, and Jones Act ships for commercial customers. We provide repair services for nearly all classes of Navy ships. With shipyards on both U.S. coasts, our Marine Systems segment consists of three business units: Bath Iron Works, Electric Boat and NASSCO. The segment’s platforms and capabilities include:•nuclear-powered submarines;•surface combatants;•auxiliary and combat-logistics ships;•commercial product carriers and containerships;•design and engineering support services; and•maintenance, modernization and lifecycle support services.
We have a long history as one of the Navy’s primary shipbuilders, constructing the ships of today’s fleet and designing and developing next-generation platforms. More than 90% of our segment’s revenue is for Navy engineering, construction and lifecycle support awarded under large, multi-year contracts. We maintain the most sophisticated marine engineering center in the world, designing and testing concepts to support future capabilities. Our ability to design, build, and maintain our nation’s most technologically sophisticated warships are a critical element of the U.S. defense industrial base.
The largest business unit in our Marine Systems segment is Electric Boat, the lead shipyard on all Navy nuclear-powered submarine programs, including both the Virginia-class attack submarine and the future Columbia-class ballistic missile submarine.
We are the lead contractor on the Virginia-class submarine program. Designed to meet diverse global mission requirements, these submarines operate with highly advanced capabilities and stealth in both littoral and open-ocean environments. Since delivering the lead Virginia-class submarine, we have reduced the cost and time to deliver follow-on ships from 84 months to 66 months, while also improving mission capability and ship quality. The Navy procures Virginia-class submarines in multi-boat blocks at a two submarines-per-year construction rate. We have delivered 17 Virginia-class submarines from the first three blocks in conjunction with an industry partner that shares in the construction, and the remaining 11 submarines from the third and fourth blocks are under contract and scheduled for delivery through 2023.
We are developing the Virginia Payload Module (VPM) for the fifth block of Virginia-class submarines, which is scheduled to begin construction in 2019 in support of the Navy’s fleet plans. This block of submarines will provide significant upgrades in size and performance. The VPM is an 84-foot hull section that adds four additional payload tubes, more than tripling the strike capacity of these submarines and providing unique capabilities to support special missions.
We are the lead contractor for the design and construction of the Navy’s Columbia-class ballistic missile submarine, a 12-boat program the Navy considers its top priority. These submarines will provide strategic deterrent capabilities for decades and are scheduled to come online when the current Ohio-class fleet reaches its end of service life beginning in 2027. We are slated to begin construction on the lead boat in 2021 and deliver it to the Navy in support of the Ohio-class retirements. In 2018, the Navy awarded us a contract modification for advance procurement, advance construction and long-lead materials. We have developed a comprehensive resource master plan to ensure that we will have a fully trained workforce in place to support the increased demand for skilled trades for the Columbia program. We continue to invest in our facilities, optimizing the timing between investments and returns, while coordinating closely with the Navy on a $1.7 billion investment in our submarine yard to support construction.
12
Bath Iron Works builds the Arleigh Burke-class (DDG-51) guided-missile destroyers and manages modernization and lifecycle support. These high-utility, multi-mission ships are capable of fighting simultaneous air, surface and subsurface battles. The Navy restarted the program in 2010 after a four-year break in construction. Bath Iron Works delivered the first ship in the restart program to the Navy in 2017. In 2018, we were awarded contracts for the construction of five additional DDG-51s, for a total of 11 ships in backlog, scheduled for delivery through 2027.
Bath Iron Works is one of the Navy’s contractors involved in the development and construction of the Zumwalt-class (DDG-1000) platform, the Navy’s next-generation guided-missile destroyer. These ships are equipped with numerous technological enhancements, including a low radar profile, an integrated power system and a software environment tying together nearly every system on the ship. The DDG-1000 provides independent forward presence and deterrence, supports special operations forces, and operates as an integral part of joint expeditionary forces. We delivered the first ship in 2016 and the second ship in 2018. We continue to build the final ship, scheduled for delivery in 2020.
NASSCO is building Expeditionary Sea Base (ESB) auxiliary support ships, a second variant of the Expeditionary Support Dock (ESD) ships. ESBs serve as floating forward staging bases, improving the Navy and Marine Corps’ ability to deliver large-scale equipment and expeditionary forces to areas without adequate port access. Equipped with a 52,000-square-foot flight deck and accommodations for up to 250 personnel, they are capable of supporting diverse missions, including airborne mine countermeasure, maritime security operations and disaster relief missions. In 2018, we delivered the fourth ESB and secured long-lead materials funding for a sixth ship. We expect to deliver the fifth ESB in 2019.
NASSCO was competitively awarded an exclusive design and construction contract in 2016 for the lead ship in the Navy’s new class of fleet replenishment oilers, the John Lewis class (T-AO-205), along with options for five additional ships. Designed to transfer fuel to Navy surface ships operating at sea, the oilers can carry 157,000 barrels of fuel and also offer significant dry cargo capacity and aviation capabilities. In 2018, we began construction on the first ship, the future USNS John Lewis.
Our Marine Systems segment provides comprehensive ship and submarine maintenance, modernization and lifecycle support services to extend the service life of these ships. NASSCO conducts full-service maintenance and surface-ship repair operations in Navy fleet concentration areas in San Diego, Norfolk, Mayport, and Puget Sound. Electric Boat provides submarine maintenance and modernization services in a variety of U.S. locations, and Bath Iron Works provides lifecycle support services for Navy surface ships. In support of allied navies, we offer program management, planning, engineering and design support for submarine and surface-ship construction programs.
In addition to our work for the Navy, the Marine Systems segment has extensive experience in all phases of commercial ship construction. We have designed and built oil and product tankers and container and cargo ships for commercial customers since the 1970s. These ships satisfy our commercial customers’ Jones Act requirement that ships carrying cargo between U.S. ports be built in U.S. shipyards.
We offer advanced commercial shipbuilding technology as demonstrated by NASSCO’s design and delivery of the world’s first liquefied natural gas (LNG)-powered containerships. Using green ship technology, we have decreased emissions dramatically while increasing fuel efficiency. From 2014 to 2017, NASSCO constructed and delivered eight LNG-conversion-ready product tankers for commercial customers. In 2018, we began construction on the second ship in a two-ship series of Kanaloa-class containerships. The two new LNG-capable containerships with roll-on, roll-off capability are scheduled for delivery in 2019 and 2020.
13
To promote operating efficiency, innovation and affordability for our customers, we make strategic investments in our business, often in cooperation with the Navy. We leverage our design and engineering expertise across shipyards to improve program execution and generate cost savings. This knowledge sharing enables us to use resources more efficiently and drive process improvements. Through robust and disciplined planning, we are positioned to support our customers well into the future.
Revenue for the Marine Systems segment was24%of our consolidated revenue in2018and26%in2017and2016. Revenue by major products and services was as follows:
Year Ended December 31201820172016
Nuclear-powered submarines$5,712$5,175$5,264
Surface ships1,8721,6071,648
Repair and other services9181,2221,160
Total Marine Systems$8,502$8,004$8,072
CUSTOMERS
In2018,65%of our consolidated revenue was from the U.S. government,14%was from U.S. commercial customers,10%was from non-U.S. commercial customers and the remaining11%was from non-U.S. government customers.
U.S. GOVERNMENT
Our primary customer is the U.S. Department of Defense (DoD). We also contract with other U.S. government customers, including the intelligence community, the Departments of Homeland Security and Health and Human Services, and first-responder agencies. Our revenue from the U.S. government was as follows:
Year Ended December 31201820172016
DoD$17,752$15,441$15,080
Non-DoD5,2282,9042,883
Foreign Military Sales (FMS)*626676713
Total U.S. government$23,606$19,021$18,676
% of total revenue65%61%61%
* In addition to our direct non-U.S. sales, we sell to non-U.S. governments through the FMS program. Under the FMS program, we contract with and are paid by the U.S. government, and the U.S. government assumes the risk of collection from the non-U.S. government customer.
Our U.S. government revenue is derived from fixed-price, cost-reimbursement and time-and-materials contracts.Our production contracts are primarily fixed-price. Under these contracts, we agree to perform a specific scope of work for a fixed amount. Contracts for research, engineering, repair and maintenance, and other services are typically cost-reimbursement or time-and-materials. Under cost-reimbursement contracts, the customer reimburses contract costs incurred and pays a fixed, incentive or award-based fee. These fees are determined by our ability to achieve targets set in the contract, such as cost, quality, schedule and performance. Under time-and-materials contracts, the customer pays a fixed hourly rate for direct labor and generally reimburses us for the cost of materials.
Of our U.S. government revenue, fixed-price contracts accounted for56%in2018,54%in2017and53%in2016; cost-reimbursement contracts accounted for38%in2018,42%in2017and43%in2016; and time-and-materials contracts accounted for6%in 2018 and 4% in 2017 and 2016.
For information on the advantages and disadvantages of each of these contract types, see Note C to the Consolidated Financial Statements in Item 8.
14
U.S. COMMERCIAL
Our U.S. commercial revenue was$5 billionin2018and$4.5 billionin2017and2016. This represented14%of our consolidated revenue in2018and15%in2017and2016. The majority of this revenue is for business-jet aircraft and related services where our customer base consists of individuals and public and privately held companies across a wide range of industries.
NON-U.S.
Our revenue from non-U.S. government and commercial customers was$7.6 billionin2018,$7.5 billionin2017and$7.4 billionin2016. This represented21%of our consolidated revenue in2018and24%in2017and2016.
We conduct business with customers around the world. Our non-U.S. defense subsidiaries maintain long-term relationships with their customers and have established themselves as principal regional suppliers and employers, providing a broad portfolio of products and services.
Our non-U.S. commercial revenue consists primarily of business-jet aircraft exports and worldwide aircraft services. The market for business-jet aircraft and related services outside North America has expanded significantly in recent years. While the installed base of aircraft is concentrated in North America, orders from customers outside North America represent a significant portion of our aircraft business with approximately45%of the Aerospace segment’s total backlog onDecember 31, 2018.
COMPETITION
Several factors determine our ability to compete successfully in the defense and business-aviation markets. While customers’ evaluation criteria vary, the principal competitive elements include:•the technical excellence, reliability, safety and cost competitiveness of our products and services;•our ability to innovate and develop new products and technologies that improve mission performance and adapt to dynamic threats;•successful program execution and on-time delivery of complex, integrated systems;•our global footprint and accessibility to customers;•the reputation and customer confidence derived from past performance; and•the successful management of customer relationships.
DEFENSE MARKET COMPETITION
The U.S. government contracts with numerous domestic and non-U.S. companies for products and services. We compete against other large platform and system-integration contractors as well as smaller companies that specialize in a particular technology or capability. Outside the United States, we compete with global defense contractors’ exports and the offerings of private and state-owned defense manufacturers. Our Combat Systems segment competes with a large number of U.S. and non-U.S. businesses. Our Information Technology and Mission Systems segments compete with many companies, from large defense companies to small niche competitors with specialized technologies or expertise. Our Marine Systems segment has one primary competitor with which it also partners on the Virginia-class submarine program. The operating cycle of many of our major platform programs can result in sustained periods of program continuity when we perform successfully.
We are involved in teaming and subcontracting relationships with some of our competitors. Competitions for major defense programs often require companies to form teams to bring together a spectrum of capabilities to meet the customer’s requirements. Opportunities associated with these programs include roles as the
15
program’s integrator, overseeing and coordinating the efforts of all participants on a team, or as a provider of a specific component or subsystem.
BUSINESS-JET AIRCRAFT MARKET COMPETITION
The Aerospace segment has several competitors for each of its Gulfstream products. Key competitive factors include aircraft safety, reliability and performance; comfort and in-flight productivity; service quality, global footprint and responsiveness; technological and new-product innovation; and price. We believe that Gulfstream competes effectively in all of these areas.
The Aerospace segment competes worldwide in the business-jet aircraft services market primarily on the basis of price, quality and timeliness. In our maintenance, repair and FBO businesses, the segment competes with several other large companies as well as a number of smaller companies, particularly in the maintenance business. In our completions business, the segment competes with several service providers.
BACKLOG
Our total backlog represents the estimated remaining value of work to be performed under firm contracts and includes funded and unfunded portions. For additional discussion of backlog, see Management’s Discussion and Analysis of Financial Condition and Results of Operations in Item 7.
Summary backlog information for each of our segments follows:
2018 Total
Backlog Not
Expected to Be
Completed in 2019
December 3120182017
FundedUnfundedTotalFundedUnfundedTotal
Aerospace$11,208$167$11,375$12,319$147$12,466$5,079
Combat Systems16,17442416,59817,15845817,61610,822
Information
Technology4,7173,2487,9652,1401,4713,6111,770
Mission Systems4,8904455,3354,5427215,2632,126
Marine Systems18,8377,76126,59815,8728,34724,21918,844
Total backlog$55,826$12,045$67,871$52,031$11,144$63,175$38,641
RESEARCH AND DEVELOPMENT
To foster innovative product development and evolution, we conduct sustained R&D activities as part of our normal business operations. Most of our Aerospace segment’s R&D activities support Gulfstream’s product enhancement and development programs. In our U.S. defense operations, we conduct customer-sponsored R&D activities under government contracts and company-sponsored R&D activities, investing in technologies and capabilities that provide innovative solutions for our customers. In accordance with government regulations, we recover a portion of company-sponsored R&D expenditures through overhead charges to U.S. government contracts. For more information on our company-sponsored R&D activities, including our expenditures for the past three years, see Note A to the Consolidated Financial Statements in Item 8.
16
INTELLECTUAL PROPERTY
We develop technology, manufacturing processes and systems-integration practices. In addition to owning a large portfolio of proprietary intellectual property, we license some intellectual property rights to and from others. The U.S. government holds licenses to many of our patents developed in the performance of U.S. government contracts, and it may use or authorize others to use the inventions covered by these patents. Although these intellectual property rights are important to the operation of our business, no existing patent, license or other intellectual property right is of such importance that its loss or termination would have a material impact on our business.
EMPLOYEES
OnDecember 31, 2018, our subsidiaries had105,600employees, approximatelyone-fifthof whom work under collective agreements with various labor unions and worker representatives. Agreements covering approximately5%of total employees are due to expire in2019. Historically, we have renegotiated these labor agreements without any significant disruption to operating activities.
RAW MATERIALS, SUPPLIERS AND SEASONALITY
We depend on suppliers and subcontractors for raw materials, components and subsystems. Our U.S. government customer is a supplier on some of our programs. These supply networks can experience price fluctuations and capacity constraints, which can put pressure on our costs. Effective management and oversight of suppliers and subcontractors is an important element of our successful performance. We sometimes rely on only one or two sources of supply that, if disrupted, could impact our ability to meet our customer commitments. We attempt to mitigate risks with our suppliers by entering into long-term agreements and leveraging company-wide agreements to achieve economies of scale, and by negotiating flexible pricing terms in our customer contracts. We have not experienced, and do not foresee, significant difficulties in obtaining the materials, components or supplies necessary for our business operations.
Our business is not seasonal in nature. The receipt of contract awards, the availability of funding from the customer, the incurrence of contract costs and unit deliveries are all factors that influence the timing of our revenue. In the United States, these factors are influenced by the federal government’s budget cycle based on its October-to-September fiscal year.
REGULATORY MATTERS
U.S. GOVERNMENT CONTRACTS
U.S. government contracts are subject to procurement laws and regulations. The Federal Acquisition Regulation (FAR) and the Cost Accounting Standards (CAS) govern the majority of our contracts. The FAR mandates uniform policies and procedures for U.S. government acquisitions and purchased services. Also, individual agencies can have acquisition regulations that provide implementing language for the FAR or that supplement the FAR. For example, the DoD implements the FAR through the Defense Federal Acquisition Regulation Supplement (DFARS). For all federal government entities, the FAR regulates the phases of any product or service acquisition, including:•acquisition planning;•competition requirements;•contractor qualifications;
17
•protection of source selection and vendor information; and•acquisition procedures.
In addition, the FAR addresses the allowability of our costs, while the CAS addresses the allocation of those costs to contracts. The FAR and CAS subject us to audits and other government reviews covering issues such as cost, performance, internal controls and accounting practices relating to our contracts.
NON-U.S. REGULATORY
Our non-U.S. operations are subject to the applicable government regulations and procurement policies and practices, as well as U.S. policies and regulations. We are also subject to regulations governing investments, exchange controls, repatriation of earnings and import-export control.
BUSINESS-JET AIRCRAFT
The Aerospace segment is subject to FAA regulation in the United States and other similar aviation regulatory authorities internationally, including the Civil Aviation Administration of Israel (CAAI), the European Aviation Safety Agency (EASA) and the Civil Aviation Administration of China (CAAC). For an aircraft to be manufactured and sold, the model must receive a type certificate from the appropriate aviation authority, and each aircraft must receive a certificate of airworthiness. Aircraft outfitting and completions also require approval by the appropriate aviation authority, which often is accomplished through a supplemental type certificate. Aviation authorities can require changes to a specific aircraft or model type before granting approval. Maintenance facilities and charter operations must be licensed by aviation authorities as well.
ENVIRONMENTAL
We are subject to a variety of federal, state, local and foreign environmental laws and regulations. These laws and regulations cover the discharge, treatment, storage, disposal, investigation and remediation of materials, substances and wastes identified in the laws and regulations. We are directly or indirectly involved in environmental investigations or remediation at some of our current and former facilities and at third-party sites that we do not own but where we have been designated a potentially responsible party (PRP) by the U.S. Environmental Protection Agency or a state environmental agency. As a PRP, we are potentially liable to the government or third parties for the cost of remediating contamination. In cases where we have been designated a PRP, generally we seek to mitigate these environmental liabilities through available insurance coverage and by pursuing appropriate cost-recovery actions. In the unlikely event that we are required to fully fund the remediation of a site, the current statutory framework would allow us to pursue contributions from other PRPs. We regularly assess our compliance status and management of environmental matters.
Operating and maintenance costs associated with environmental compliance and management of contaminated sites are a normal, recurring part of our operations. Historically, these costs have not been material. Environmental costs often are recoverable under our contracts with the U.S. government. Based on information currently available and current U.S. government policies relating to cost recovery, we do not expect continued compliance with environmental regulations to have a material impact on our results of operations, financial condition or cash flows. For additional information relating to the impact of environmental matters, see Note O to the Consolidated Financial Statements in Item 8.
AVAILABLE INFORMATION
We file reports and other information with the Securities and Exchange Commission (SEC) pursuant to Section 13(a) or 15(d) of the Securities Exchange Act of 1934, as amended. These reports and information include an annual report on Form 10-K, quarterly reports on Form 10-Q, current reports on Form 8-K and
18
proxy statements. Free copies of these items are made available on our website (www.generaldynamics.com) as soon as practicable. The SEC maintains a website (www.sec.gov) that contains reports, proxy and information statements, and other information.
In addition to the information contained in this Form 10-K, information about the company can be found on our website and our Investor Relations website (investorrelations.gd.com). Our Investor Relations website contains a significant amount of information about the company, including financial information, our corporate governance principles and practices, and other information for investors. We encourage investors to visit our website, as we frequently update and post new information about our company on our website, and it is possible that this information could be deemed to be material information.
References to our website and the SEC’s website in this Form 10-K do not constitute, and should not be viewed as, incorporation by reference of the information contained on, or available through, the websites. The information should not be considered a part of this Form 10-K, unless otherwise expressly incorporated by reference.
ITEM 1A.RISK FACTORS
An investment in our common stock or debt securities is subject to risks and uncertainties. Investors should consider the following factors, in addition to the other information contained in this Annual Report on Form 10-K, before deciding whether to purchase our securities.
Investment risks can be market-wide as well as unique to a specific industry or company. The market risks faced by an investor in our stock are similar to the uncertainties faced by investors in a broad range of industries. There are some risks that apply more specifically to our business.
Our revenue is concentrated with the U.S. government. This customer relationship involves some specific risks. In addition, our sales to non-U.S. customers expose us to different financial and legal risks. Despite the varying nature of our U.S. and non-U.S. defense and business-aviation operations and the markets they serve, each segment shares some common risks, such as the ongoing development of high-technology products and the price, availability and quality of commodities and subsystems.
The U.S. government provides a significant portion of our revenue.In 2018, approximately 65% of our consolidated revenue was from the U.S. government. Levels of U.S. defense spending are driven by threats to national security. Competing demands for federal funds can pressure various areas of spending. Decreases in U.S. government defense spending or changes in spending allocation or priorities could result in one or more of our programs being reduced, delayed or terminated, which could impact our financial performance.
The Budget Control Act of 2011 (BCA) establishes caps for defense spending over a 10-year period through 2021, including a sequester mechanism that would impose additional defense cuts. In February 2018, the Congress approved increases to the BCA spending caps through fiscal year (FY) 2019. However, the BCA’s spending limits for FY 2020 and FY 2021 have not been increased or otherwise modified. The President’s defense budget estimates for FY 2020 and beyond exceed the spending limits established by the BCA. As a result, continued budget uncertainty and the risk of future sequestration cuts remain unless the BCA is repealed or significantly modified.
While it is impossible to predict the exact impact on our programs or financial outlook in light of the inherent uncertainty attendant to the sequestration process, the magnitude of potential funding reductions
19
imposed by the sequester mechanism as written, could in the aggregate have material adverse operational and financial consequences, depending on how the cuts are allocated across the budget.
For additional information relating to the U.S. defense budget, see the Business Environment section of Management’s Discussion and Analysis of Financial Condition and Results of Operations in Item 7.
U.S. government contracts are not always fully funded at inception, and any funding is subject to disruption or delay.Our U.S. government revenue is funded by agency budgets that operate on an October-to-September fiscal year. Early each calendar year, the President of the United States presents to the Congress the budget for the upcoming fiscal year. This budget proposes funding levels for every federal agency and is the result of months of policy and program reviews throughout the Executive branch. For the remainder of the year, the appropriations and authorization committees of the Congress review the President’s budget proposals and establish the funding levels for the upcoming fiscal year. Once these levels are enacted into law, the Executive Office of the President administers the funds to the agencies.
There are two primary risks associated with the U.S. government budget cycle. First, the annual process may be delayed or disrupted. If the annual budget is not approved by the beginning of the government fiscal year, portions of the U.S. government can shut down or operate under a continuing resolution that maintains spending at prior-year levels, which can impact funding for our programs and timing of new awards. Second, the Congress typically appropriates funds on a fiscal-year basis, even though contract performance may extend over many years. Future revenue under existing multi-year contracts is conditioned on the continuing availability of congressional appropriations. Changes in appropriations in subsequent years may impact the funding available for these programs. Delays or changes in funding can impact the timing of available funds or lead to changes in program content.
Our U.S. government contracts are subject to termination rights by the customer.U.S. government contracts generally permit the government to terminate a contract, in whole or in part, for convenience. If a contract is terminated for convenience, a contractor usually is entitled to receive payments for its allowable costs incurred and the proportionate share of fees or earnings for the work performed. The government may also terminate a contract for default in the event of a breach by the contractor. If a contract is terminated for default, the government in most cases pays only for the work it has accepted. The termination of multiple or large programs could have a material adverse effect on our future revenue and earnings.
Government contractors operate in a highly regulated environment and are subject to audit by the U.S. government.Numerous U.S. government agencies routinely audit and review government contractors. These agencies review a contractor’s performance under its contracts and compliance with applicable laws, regulations and standards. The U.S. government also reviews the adequacy of, and compliance with, internal control systems and policies, including the contractor’s purchasing, property, estimating, material, earned value management and accounting systems. In some cases, audits may result in delayed payments or contractor costs not being reimbursed or subject to repayment. If an audit or investigation were to result in allegations against a contractor of improper or illegal activities, civil or criminal penalties and administrative sanctions could result, including termination of contracts, forfeiture of profits, suspension of payments, fines and suspension or prohibition from doing business with the U.S. government. In addition, reputational harm could result if allegations of impropriety were made. In some cases, audits may result in disputes with the respective government agency that can result in negotiated settlements, arbitration or litigation. Moreover, new laws, regulations or standards, or changes to existing ones, can increase our performance and compliance costs and reduce our profitability.
Our Aerospace segment is subject to changing customer demand for business aircraft.Thebusiness-jet market is driven by the demand for business-aviation products and services by corporate,
20
individual and government customers in the United States and around the world. The Aerospace segment’s results also depend on other factors, including general economic conditions, the availability of credit, pricing pressures and trends in capital goods markets. In addition, if customers default on existing contracts and the contracts are not replaced, the segment’s anticipated revenue and profitability could be reduced materially.
Earnings and margin depend on our ability to perform on our contracts.When agreeing to contractual terms, our management team makes assumptions and projections about future conditions and events. The accounting for our contracts and programs requires assumptions and estimates about these conditions and events. These projections and estimates assess:•the productivity and availability of labor;•the complexity of the work to be performed;•the cost and availability of materials and components; and•schedule requirements.
If there is a significant change in one or more of these circumstances, estimates or assumptions, or if the risks under our contracts are not managed adequately, the profitability of contracts could be adversely affected. This could affect earnings and margin materially.
Earnings and margin depend in part on subcontractor and vendor performance.We rely on other companies to provide materials, components and subsystems for our products. Subcontractors also perform some of the services that we provide to our customers. We depend on these subcontractors and vendors to meet our contractual obligations in full compliance with customer requirements and applicable law. Misconduct by subcontractors, such as a failure to comply with procurement regulations or engaging in unauthorized activities, may harm our future revenue and earnings. We manage our supplier base carefully to avoid customer issues. We sometimes rely on only one or two sources of supply that, if disrupted, could have an adverse effect on our ability to meet our customer commitments. Our ability to perform our obligations may be materially adversely affected if one or more of these suppliers is unable to provide the agreed-upon materials, perform the agreed-upon services in a timely and cost-effective manner, or engages in misconduct or other improper activities.
Sales and operations outside the United States are subject to different risks that may be associated with doing business in foreign countries.In some countries there is increased chance for economic, legal or political changes, and procurement procedures may be less robust or mature, which may complicate the contracting process. Our non-U.S. operations may be sensitive to and impacted by changes in a foreign government’s national policies and priorities, political leadership, and budgets, which may be influenced by changes in threat environments, geopolitical uncertainties, volatility in economic conditions and other economic and political factors. Changes and developments in any of these matters or factors may occur suddenly and could impact funding for programs or delay purchasing decisions or customer payments. Non-U.S. transactions can involve increased financial and legal risks arising from foreign exchange-rate variability and differing legal systems. Our non-U.S. operations are subject to U.S. and foreign laws and regulations, including laws and regulations relating to import-export controls, technology transfers, the Foreign Corrupt Practices Act and other anti-corruption laws, and the International Traffic in Arms Regulations (ITAR). An unfavorable event or trend in any one or more of these factors or a failure to comply with U.S. or foreign laws could result in administrative, civil or criminal liabilities, including suspension or debarment from government contracts or suspension of our export privileges, and could materially adversely affect revenue and earnings associated with our non-U.S. operations.
21
In addition, some non-U.S. government customers require contractors to enter into letters of credit, performance or surety bonds, bank guarantees and other similar financial arrangements. We may also be required to agree to specific in-country purchases, manufacturing agreements or financial support arrangements, known as offsets, that require us to satisfy investment or other requirements or face penalties. Offset requirements may extend over several years and could require us to team with local companies to fulfill these requirements. If we do not satisfy these financial or offset requirements, our future revenue and earnings may be materially adversely affected.
Our future success depends in part on our ability to develop new products and technologies and maintain a qualified workforce to meet the needs of our customers.Many of the products and services we provide involve sophisticated technologies and engineering, with related complex manufacturing and system-integration processes. Our customers’ requirements change and evolve regularly. Accordingly, our future performance depends in part on our ability to continue to develop, manufacture and provide innovative products and services and bring those offerings to market quickly at cost-effective prices. Some new products, particularly in our Aerospace segment, must meet extensive and time-consuming regulatory requirements that are often outside our control. Additionally, due to the highly specialized nature of our business, we must hire and retain the skilled and qualified personnel necessary to perform the services required by our customers. To the extent that the demand for skilled personnel exceeds supply, we could experience higher labor, recruiting or training costs in order to attract and retain such employees. If we were unable to develop new products that meet customers’ changing needs and satisfy regulatory requirements in a timely manner or successfully attract and retain qualified personnel, our future revenue and earnings may be materially adversely affected.
We have made and expect to continue to make investments, including acquisitions and joint ventures, that involve risks and uncertainties.When evaluating potential acquisitions and joint ventures, we make judgments regarding the value of business opportunities, technologies, and other assets and the risks and costs of potential liabilities based on information available to us at the time of the transaction. Whether we realize the anticipated benefits from these transactions depends on multiple factors, including our integration of the businesses involved; the performance of the underlying products, capabilities or technologies; market conditions following the acquisition; and acquired liabilities, including some that may not have been identified prior to the acquisition. These factors could materially adversely affect our financial results.
Changes in business conditions may cause goodwill and other intangible assets to become impaired.Goodwill represents the purchase price paid in excess of the fair value of net tangible and intangible assets acquired in a business combination.Goodwill is not amortized and remains on our balance sheet indefinitely unless there is an impairment or a sale of a portion of the business. Goodwill is subject to an impairment test on an annual basis or when circumstances indicate that the likelihood of an impairment is greater than 50%.Such circumstances include a significant adverse change in the business climate for one of our reporting units or a decision to dispose of a reporting unit or a significant portion of a reporting unit.We face some uncertainty in our business environment due to a variety of challenges, including changes in defense spending. We may experience unforeseen circumstances that adversely affect the value of our goodwill or intangible assets and trigger an evaluation of the amount of the recorded goodwill and intangible assets. Future write-offs of goodwill or other intangible assets as a result of an impairment in the business could materially adversely affect our results of operations and financial condition.
Our business could be negatively impacted by cyber security events and other disruptions.We face various cyber security threats, including threats to our information technology (IT) infrastructure and attempts to gain access to our proprietary or classified information, denial-of-service attacks, as well as
22
threats to the physical security of our facilities and employees, and threats from terrorist acts. We also design and manage IT systems and products that contain IT systems for various customers. We generally face the same security threats for these systems as for our own internal systems. In addition, we face cyber threats from entities that may seek to target us through our customers, vendors, subcontractors and other third parties with whom we do business. Accordingly, we maintain information security staff, policies and procedures for managing risk to our information systems, and conduct employee training on cyber security to mitigate persistent and continuously evolving cyber security threats. However, there can be no assurance that any such actions will be sufficient to prevent cybersecurity breaches, disruptions, unauthorized release of sensitive information or corruption of data.
We have experienced cyber security threats such as viruses and attacks targeting our IT systems. Such prior events have not had a material impact on our financial condition, results of operations or liquidity. However, future threats could, among other things, cause harm to our business and our reputation; disrupt our operations; expose us to potential liability, regulatory actions and loss of business; challenge our eligibility for future work on sensitive or classified systems for government customers; and impact our results of operations materially. Due to the evolving nature of these security threats, the potential impact of any future incident cannot be predicted. Our insurance coverage may not be adequate to cover all the costs related to cyber security attacks or disruptions resulting from such events.
FORWARD-LOOKING STATEMENTS
This Annual Report on Form 10-K contains forward-looking statements that are based on management’s expectations, estimates, projections and assumptions. Words such as “expects,” “anticipates,” “plans,” “believes,” “scheduled,” “outlook,” “estimates,” “should” and variations of these words and similar expressions are intended to identify forward-looking statements. Examples include projections of revenue, earnings, operating margin, segment performance, cash flows, contract awards, aircraft production, deliveries and backlog. In making these statements we rely on assumptions and analyses based on our experience and perception of historical trends, current conditions and expected future developments as well as other factors we consider appropriate under the circumstances. We believe our estimates and judgments are reasonable based on information available to us at the time. Forward-looking statements are made pursuant to the safe harbor provisions of the Private Securities Litigation Reform Act of 1995, as amended. These statements are not guarantees of future performance and involve risks and uncertainties that are difficult to predict. Therefore, actual future results and trends may differ materially from what is forecast in forward-looking statements due to a variety of factors, including, without limitation, the risk factors discussed in this Form 10-K.
All forward-looking statements speak only as of the date of this report or, in the case of any document incorporated by reference, the date of that document. All subsequent written and oral forward-looking statements attributable to General Dynamics or any person acting on our behalf are qualified by the cautionary statements in this section. We do not undertake any obligation to update or publicly release any revisions to forward-looking statements to reflect events, circumstances or changes in expectations after the date of this report. These factors may be revised or supplemented in subsequent reports on SEC Forms 10-Q and 8-K.
ITEM 1B.UNRESOLVED STAFF COMMENTS
23
None.
ITEM 2.PROPERTIES
We operate in a number of offices, manufacturing plants, laboratories, warehouses and other facilities in the United States and abroad. We believe our facilities are adequate for our present needs and, given planned improvements and construction, expect them to remain adequate for the foreseeable future.
OnDecember 31, 2018, our segments had primary operations at the following locations:•Aerospace– Burbank, Lincoln, Long Beach and Van Nuys, California; West Palm Beach, Florida; Brunswick, Pooler and Savannah, Georgia; Cahokia, Illinois; Bedford and Westfield, Massachusetts; Las Vegas, Nevada; Teterboro, New Jersey; New York, New York; Tulsa, Oklahoma; San Juan, Puerto Rico; Dallas and Houston, Texas; Dulles, Virginia; Appleton, Wisconsin; Brisbane, Cairns, Darwin, Perth and Sydney, Australia; Vienna, Austria; Sorocaba, Brazil; Beijing, Hong Kong and Shanghai, China; Berlin, Dusseldorf and Munich, Germany; Jakarta, Indonesia; Kuala Lumpur, Malaysia; Valetta, Malta; Mexicali, Mexico; Amsterdam and Rotterdam, the Netherlands; Manila, Philippines; Moscow, Russia; Singapore; Basel, Geneva and Zurich, Switzerland; Bangkok, Thailand; Dubai and Fujairah, United Arab Emirates; Luton and Stansted, United Kingdom.•Combat Systems– Anniston, Alabama; East Camden and Hampton, Arkansas; Crawfordsville, St. Petersburg and Tallahassee, Florida; Marion, Illinois; Saco, Maine; Sterling Heights, Michigan; Joplin, Missouri; Lincoln, Nebraska; Lima, Ohio; Eynon, Red Lion and Scranton, Pennsylvania; Ladson, South Carolina; Garland, Texas; Williston, Vermont; Auburn and Sumner, Washington; Vienna, Austria; La Gardeur, London, St. Augustin and Valleyfield, Canada; Kaiserslautern, Neubrandenburg and Woldegk, Germany; Granada, Madrid, Sevilla and Trubia, Spain; Kreuzlingen, Switzerland; Merthyr Tydfil and Oakdale, United Kingdom.•Information Technology– Daleville, Alabama; Pawcatuck, Connecticut; Bossier City, Louisiana; Annapolis Junction, Columbia and Towson, Maryland; Westwood, Massachusetts; Rensselaer, New York; Fayetteville, North Carolina; Arlington, Chesapeake, Sterling and several locations in Fairfax County, Virginia.•Mission Systems– Cullman, Alabama; Scottsdale, Arizona; San Jose, California; Annapolis Junction, Maryland; Dedham, Pittsfield and Taunton, Massachusetts; Bloomington, Minnesota; Florham Park, New Jersey; Catawba, Conover and Greensboro, North Carolina; Kilgore, Plano and Wortham, Texas; Fairfax and Marion, Virginia; Calgary and Ottawa, Canada; Tallinn, Estonia; Merthyr Tydfil, Oakdale and St. Leonards, United Kingdom.•Marine Systems– San Diego, California; Groton, New London and Stonington, Connecticut; Jacksonville, Florida; Bath and Brunswick, Maine; North Kingstown, Rhode Island; Norfolk and Portsmouth, Virginia; Bremerton, Washington; Mexicali, Mexico.
24
A summary of floor space by segment onDecember 31, 2018, follows:
(Square feet in millions)Company-owned
FacilitiesLeased
FacilitiesGovernment-owned
FacilitiesTotal
Aerospace6.28.1—14.3
Combat Systems6.34.45.516.2
Information Technology0.25.2—5.4
Mission Systems3.83.60.98.3
Marine Systems8.33.4—11.7
Total square feet24.824.76.455.9
ITEM 3.LEGAL PROCEEDINGS
For information relating to legal proceedings, see Note O to the Consolidated Financial Statements in Item 8.
ITEM 4.MINE SAFETY DISCLOSURES
Not applicable.
EXECUTIVE OFFICERS OF THE COMPANY
All of our executive officers are appointed annually. None of our executive officers were selected pursuant to any arrangement or understanding between the officer and any other person. The name, age, offices and positions of our executives held for at least the past five years as ofFebruary 13, 2019, were as follows (references are to positions with General Dynamics Corporation, unless otherwise noted):
Name, Position and OfficeAge
Jason W. Aiken - Senior Vice President and Chief Financial Officer since January 2014; Vice President of the company and Chief Financial Officer of Gulfstream Aerospace Corporation, September 2011 - December 2013; Vice President and Controller, April 2010 - August 2011; Staff Vice President, Accounting, July 2006 - March 201046
Christopher J. Brady - Vice President of the company and President of General Dynamics Mission Systems since January 2019; Vice President, Engineering of General Dynamics Mission Systems, January 2015 - December 2018; Vice President, Engineering of General Dynamics C4 Systems, May 2013 - December 2014; Vice President, Assured Communications Systems of General Dynamics C4 Systems, August 2004 - May 201356
Mark L. Burns - Vice President of the company and President of Gulfstream Aerospace Corporation since July 2015; Vice President of the company since February 2014; President, Product Support of Gulfstream Aerospace Corporation, June 2008 - June 201559
John P. Casey - Executive Vice President, Marine Systems, since May 2012; Vice President of the company and President of Electric Boat Corporation, October 2003 - May 2012; Vice President of Electric Boat Corporation, October 1996 - October 200364
Gregory S. Gallopoulos - Senior Vice President, General Counsel and Secretary since January 2010; Vice President and Deputy General Counsel, July 2008 - January 2010; Managing Partner of Jenner & Block LLP, January 2005 - June 200859
25
Jeffrey S. Geiger - Vice President of the company and President of Electric Boat Corporation since November 2013; Vice President of the company and President of Bath Iron Works Corporation, April 2009 - November 2013; Senior Vice President, Operations and Engineering of Bath Iron Works Corporation, March 2008 - March 200957
M. Amy Gilliland - Senior Vice President of the company since April 2015; President of General Dynamics Information Technology since September 2017; Deputy for Operations of General Dynamics Information Technology, April 2017 - September 2017; Senior Vice President, Human Resources and Administration, April 2015 - March 2017; Vice President, Human Resources, February 2014 - March 2015; Staff Vice President, Strategic Planning, January 2013 - February 2014; Staff Vice President, Investor Relations, June 2008 - January 201344
Robert W. Helm - Senior Vice President, Planning and Development since May 2010; Vice President, Government Relations, of Northrop Grumman Corporation, August 1989 - April 201067
Kimberly A. Kuryea - Senior Vice President, Human Resources and Administration since April 2017; Vice President and Controller, September 2011 - March 2017; Chief Financial Officer of General Dynamics Advanced Information Systems, November 2007 - August 2011; Staff Vice President, Internal Audit, March 2004 - October 200751
Christopher Marzilli - Executive Vice President, IT & Mission Systems Segments since January 2019; Vice President of the company and President of General Dynamics Mission Systems, January 2015 - December 2018; Vice President of the company and President of General Dynamics C4 Systems, January 2006 - December 2014; Senior Vice President and Deputy General Manager of General Dynamics C4 Systems, November 2003 - January 200659
William A. Moss - Vice President and Controller since April 2017; Staff Vice President, Internal Audit, May 2015 - March 2017; Staff Vice President, Accounting, August 2010 - May 201555
Phebe N. Novakovic - Chairman and Chief Executive Officer since January 2013; President and Chief Operating Officer, May 2012 - December 2012; Executive Vice President, Marine Systems, May 2010 - May 2012; Senior Vice President, Planning and Development, July 2005 - May 2010; Vice President, Strategic Planning, October 2002 - July 200561
Mark C. Roualet - Executive Vice President, Combat Systems, since March 2013; Vice President of the company and President of General Dynamics Land Systems, October 2008 - March 2013; Senior Vice President and Chief Operating Officer of General Dynamics Land Systems, July 2007 - October 200860
Gary L. Whited - Vice President of the company and President of General Dynamics Land Systems since March 2013; Senior Vice President of General Dynamics Land Systems, September 2011 - March 2013; Vice President and Chief Financial Officer of General Dynamics Land Systems, June 2006 - September 201158
PART II
ITEM 5.MARKET FOR THE COMPANY’S COMMON EQUITY, RELATED STOCKHOLDER MATTERS AND ISSUER PURCHASES OF EQUITY SECURITIES
Our common stock is listed on the New York Stock Exchange under the trading symbol “GD.”
On January 27,2019, there were approximately11,000holders of record of our common stock.
For information regarding securities authorized for issuance under our equity compensation plans, see Note P to the Consolidated Financial Statements contained in Item 8.
We did not make any unregistered sales of equity securities in2018.
The following table provides information about our fourth-quarter purchases of equity securities that are registered pursuant to Section 12 of the Securities Exchange Act of 1934, as amended:
PeriodTotal Number of Shares PurchasedAverage Price Paid per ShareTotal Number of Shares Purchased as Part of Publicly Announced Program (a)Maximum Number of Shares That May Yet Be Purchased Under the Program (a)
Pursuant to Share Buyback Program
10/1/18-10/28/18300,000$169.65300,0004,760,168
10/29/18-11/25/182,630,000178.282,630,0002,130,168
11/26/18-12/31/184,650,000164.274,650,0007,480,168
Shares Delivered or Withheld Pursuant to Restricted Stock Vesting (b)
10/1/18-10/28/18250194.28
10/29/18-11/25/18——
11/26/18-12/31/18521193.41
7,580,771$169.35(a) On December 5, 2018, the board of directors authorized management to repurchase 10 million additional shares of common stock.
(b) Represents shares withheld by, or delivered to, us pursuant to provisions in agreements with recipients of restricted stock granted under our equity compensation plans that allow us to withhold, or the recipient to deliver to us, the number of shares with a fair value equal to the statutory tax withholding due upon vesting of the restricted shares.
For additional information relating to our purchases of common stock during the past three years, see Financial Condition, Liquidity and Capital Resources - Financing Activities - Share Repurchases contained in Item 7.
26
The following performance graph compares the cumulative total return to shareholders on our common stock, assuming reinvestment of dividends, with similar returns for the Standard & Poor’s®500 Index and the Standard & Poor’s®Aerospace & Defense Index, both of which include General Dynamics.
Cumulative Total Return
Based on Investments of $100 Beginning December 31, 2013
(Assumes Reinvestment of Dividends)
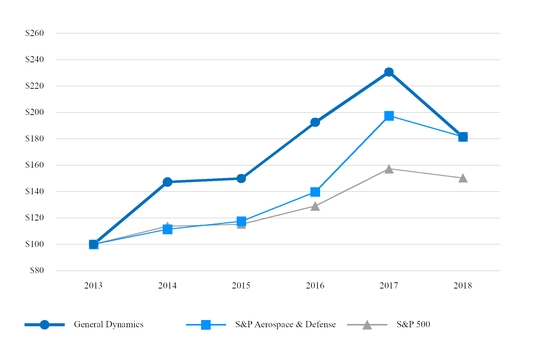
27
ITEM 6.SELECTED FINANCIAL DATA
The following table presents selected historical financial data derived from the Consolidated Financial Statements and other company information for each of the five years presented. This information should be read in conjunction with Management’s Discussion and Analysis of Financial Condition and Results of Operations in Item 7 and the Consolidated Financial Statements and the Notes thereto in Item 8.
(Dollars and shares in millions, except per-share and employee amounts)
20182017201620152014
Summary of Operations
Revenue$36,193$30,973$30,561$31,781$30,852
Operating earnings4,4574,2363,7444,4944,047
Operating margin12.3%13.7%12.3%14.1%13.1%
Interest, net(356)(103)(91)(83)(86)
Provision for income tax, net(727)(1,165)(977)(1,183)(1,129)
Earnings from continuing operations3,3582,9122,6793,0362,673
Return on sales (a)9.3%9.4%8.8%9.6%8.7%
Discontinued operations, net of tax(13)—(107)—(140)
Net earnings3,3452,9122,5723,0362,533
Diluted earnings per share:
Continuing operations11.229.568.649.297.83
Net earnings11.189.568.299.297.42
Cash Flows
Net cash provided by operating activities$3,148$3,876$2,163$2,607$3,830
Net cash (used) provided by investing activities(10,234)(788)(391)200(1,103)
Net cash provided (used) by financing activities5,086(2,399)(2,169)(4,367)(3,676)
Net cash (used) provided by discontinued operations(20)(40)(54)(43)36
Cash dividends declared per common share3.723.363.042.762.48
Financial Position
Cash and equivalents$963$2,983$2,334$2,785$4,388
Total assets45,40835,04633,17232,53834,648
Short- and long-term debt12,4173,9823,8883,3993,893
Shareholders’ equity11,73211,43510,30110,44011,829
Debt-to-equity (b)105.8%34.8%37.7%32.6%32.9%
Book value per share (c)40.6438.5234.0633.3635.61
Other Information
Free cash flow from operations (d)$2,458$3,448$1,771$2,038$3,309
Return on invested capital (d)15.2%16.8%16.3%18.1%15.1%
Funded backlog55,82652,03151,78353,44952,929
Total backlog67,87163,17562,20667,78672,410
Shares outstanding288.7296.9302.4313.0332.2
Weighted average shares outstanding:
Basic295.3299.2304.7321.3335.2
Diluted299.2304.6310.4326.7341.3
Employees105,60098,60098,80099,90099,500
Note: All prior-period information has been restated for the adoption of Accounting Standards Update (ASU) 2016-15, Statement of Cash Flows (Topic 230): Classification of Certain Cash Receipts and Cash Payments, and ASU 2017-07, Compensation - Retirement Benefits (Topic 715): Improving the Presentation of Net Periodic Pension Cost and Net Periodic Postretirement Benefit Cost. For further discussion of these two standards, see Note A to the Consolidated Financial Statements in Item 8. 2014 information has not been restated for the adoption of Accounting Standards Codification (ASC) Topic 606, Revenue from Contracts with Customers, and is, therefore, not comparable to the 2018, 2017, 2016 and 2015 information.(a)Return on sales is calculated as earnings from continuing operations divided by revenue.(b)Debt-to-equity ratio is calculated as total debt divided by total equity as of year end.(c)Book value per share is calculated as total equity divided by total outstanding shares as of year end.(d)See Item 7, Management’s Discussion and Analysis of Financial Condition and Results of Operations, for a reconciliation of net cash provided by operating activities to free cash flow from operations and the calculation of return on invested capital (ROIC), both of which are non-GAAP management metrics.
28
ITEM 7.MANAGEMENT’S DISCUSSION AND ANALYSIS OF FINANCIAL CONDITION AND RESULTS OF OPERATIONS
(Dollars in millions, except per-share amounts or unless otherwise noted)
For an overview of our operating segments, including a discussion of our major products and services, see the Business discussion contained in Item 1. The following discussion should be read in conjunction with our Consolidated Financial Statements included in Item 8.
BUSINESS ENVIRONMENT
With approximately 65% of our revenue from the U.S. government, government spending levels, particularly defense spending, influence our financial performance. Over the past several years, U.S. defense spending has been mandated by the Budget Control Act of 2011 (BCA). The BCA establishes spending caps over a 10-year period through 2021, including a sequester mechanism that would impose additional defense cuts if an annual defense appropriations bill is enacted above the spending cap.
On February 9, 2018, the Congress approved increases to the BCA spending caps and a budget for fiscal year (FY) 2019. On September 28, 2018, the FY 2019 defense appropriations bill was signed into law. It totaled $671 billion and included $602 billion in the base budget in compliance with the modified BCA spending caps and $69 billion for overseas contingency operations. However, as of the filing of this Form 10-K on February 13, 2019, seven other appropriations bills funding multiple federal civilian agencies have not been enacted. These federal agencies had been operating since the beginning of the government’s fiscal year under a series of continuing resolutions (CRs), which funded the agencies at FY 2018 spending levels. The last in this series of CRs expired on December 21, 2018, resulting in a partial government shutdown for these agencies. On January 25, 2019, a new CR was approved, providing funding for these federal agencies through February 15, 2019.
Our greatest concentration of work for the impacted agencies is in our Information Technology segment, where this work represents less than 5% of the segment’s revenue. Additionally, our Aerospace segment was affected by the shutdown of the U.S. Federal Aviation Administration (FAA), which impacted the type certification process for the new G600 aircraft. The partial government shutdown did not have a material impact on our results of operations, financial condition or cash flows, and we do not anticipate that the current CR, or subsequent extensions, will have a material impact. However, if another partial government shutdown occurred, the longer the shutdown continued, the risk of a material impact would increase.
The long-term outlook for our U.S. defense business is influenced by the U.S. military’s funding priorities, the diversity of our programs and customers, our insight into customer requirements stemming from our incumbency on core programs, our ability to evolve our products to address a fast-changing threat environment and our proven track record of successful contract execution.
International demand for military equipment and information technologies presents opportunities for our non-U.S. operations and exports from our North American businesses. While the revenue potential can be significant, there are risks to doing business in foreign countries, including changing budget priorities and overall spending pressures unique to each country.
In our Aerospace segment, we continue to experience strong demand across our product portfolio. We expect our continued investment in the development of new aircraft products and technologies to support the Aerospace segment’s long-term growth. Similarly, we believe the aircraft services business will be a strong source of revenue as the global business-jet fleet continues to grow.
29
RESULTS OF OPERATIONS
INTRODUCTION
An understanding of our accounting practices is necessary in the evaluation of our financial statements and operating results. The following paragraphs explain how we recognize revenue and operating costs in our operating segments. We account for revenue in accordance with Accounting Standards Codification (ASC) Topic 606, Revenue from Contracts with Customers.
In the Aerospace segment, we record revenue on contracts for new aircraftwhen the customer obtains control of the asset, which is generally upon delivery and acceptance by the customer of the fully outfitted aircraft.Revenue associated with the segment’s custom completions of narrow-body and wide-body aircraft and the segment’s services businesses is recognized as work progresses or upon delivery of services. Fluctuations in revenue from period to period result from the number and mix of new aircraft deliveries, progress on aircraft completions, and the level and type of aircraft services performed during the period.
The majority of the Aerospace segment’s operating costs relates to new aircraft production on firm orders and consists of labor, material, subcontractor and overhead costs. The costs are accumulated in production lots, recorded in inventory and recognized as operating costs at aircraft delivery based on the estimated average unit cost in a production lot. While changes in the estimated average unit cost for a production lot impact the level of operating costs, the amount of operating costs reported in a given period is based largely on the number and type of aircraft delivered. Operating costs in the Aerospace segment’s completions and services businesses are recognized generally as incurred.
For new aircraft, operating earnings and margin are a function of the prices of our aircraft, our operational efficiency in manufacturing and outfitting the aircraft, and the mix of ultra-large-cabin, large-cabin and mid-cabin aircraft deliveries. Additional factors affecting the segment’s earnings and margin include the volume, mix and profitability of completions and services work performed, the volume of and market for pre-owned aircraft, and the level of general and administrative (G&A) and net research and development (R&D) costs incurred by the segment.
In the defense segments, revenue on long-term government contracts is recognized generally over time as the work progresses, either as products are produced or as services are rendered.Typically, revenue is recognized over time using costs incurred to date relative to total estimated costs at completion to measure progress toward satisfying our performance obligations. Incurred cost represents work performed, which corresponds with, and thereby best depicts, the transfer of control to the customer. Contract costs include labor, material, overhead and, when appropriate, G&A expenses.Variances in costs recognized from period to period reflect primarily increases and decreases in production or activity levels on individual contracts. Because costs are used as a measure of progress, year-over-year variances in cost result in corresponding variances in revenue, which we generally refer to as volume.
Operating earnings and margin in the defense segments are driven by changes in volume, performance or contract mix. Performance refers to changes in profitability based on adjustments to estimates at completion on individual contracts. These adjustments result from increases or decreases to the estimated value of the contract, the estimated costs to complete the contract or both. Therefore, changes in costs incurred in the period compared with prior periods do not necessarily impact profitability. It is only when total estimated costs at completion on a given contract change without a corresponding change in the contract value that the profitability of that contract may be impacted. Contract mix refers to changes in the volume of higher- versus lower-margin work. Higher or lower margins can result from a number of factors,
30
including contract type (e.g., fixed-price/cost-reimbursable) and type of work (e.g., development/production).
CONSOLIDATED OVERVIEW
2018IN REVIEW•Outstanding operating performance:◦Record-high revenue of$36.2 billionwith growth in all of our segments.◦Operating earnings of$4.5 billionincreased 5.2% from2017.◦Record-high earnings from continuing operations per diluted share of$11.22, an increase of 17.4% from2017.•10.1 million outstanding shares repurchased for $1.8 billion and $1.1 billion paid in cash dividends, returning over 115% of our free cash flow from operations to shareholders.•Robust backlog of$67.9 billionincreased $4.7 billion, or 7.4%, from2017, supporting our long-term growth expectations.◦Several significant contract awards received in2018in our defense segments.
REVIEW OF2018VS.2017
Year Ended December 3120182017Variance
Revenue$36,193$30,973$5,22016.9%
Operating costs and expenses(31,736)(26,737)(4,999)18.7%
Operating earnings4,4574,2362215.2%
Operating margin12.3%13.7%
Our consolidated revenue increased 16.9% in2018. The largest driver of the increase was the acquisition of CSRA in our Information Technology segment. Excluding CSRA, revenue increased by 5% driven by growth in all of our segments.
Operating costs and expenses increased in 2018 due primarily to the CSRA acquisition, including the impact of intangible asset amortization expense and one-time transaction-related charges associated with costs to complete the acquisition, resulting in a lower margin compared with 2017. The 2018 operating margin was also impacted by a less favorable aircraft delivery mix in our Aerospace segment consistent with our expectation as we transition to the new G500 and G600 aircraft.
REVIEW OF2017VS.2016
Year Ended December 3120172016Variance
Revenue$30,973$30,561$4121.3%
Operating costs and expenses(26,737)(26,817)80(0.3)%
Operating earnings4,2363,74449213.1%
Operating margin13.7%12.3%
31
We realized top-line growth in2017driven by higher volume across our Combat Systems segment and increased revenue from aircraft deliveries and aircraft services in our Aerospace segment. These increases were offset partially by lower revenue in our Mission Systems segment driven by funding delays caused by the extended FY 2017 CR. While revenue increased, operating costs and expenses decreased, resulting in a 13.1% increase in operating earnings and margin growth of 140 basis points. Operating earnings and margin grew at each of our segments in2017.
REVIEW OF OPERATING SEGMENTS
Year Ended December 31201820172016
RevenueOperating
EarningsRevenueOperating
EarningsRevenueOperating
Earnings
Aerospace$8,455$1,490$8,129$1,577$7,815$1,394
Combat Systems6,2419625,9499375,530831
Information Technology8,2696084,4103734,428340
Mission Systems4,7266594,4816384,716601
Marine Systems8,5027618,0046858,072595
Corporate—(23)—26—(17)
Total$36,193$4,457$30,973$4,236$30,561$3,744
Following is a discussion of operating results and outlook for each of our operating segments. For the Aerospace segment, results are analyzed by specific types of products and services, consistent with how the segment is managed. For the defense segments, the discussion is based on the lines of products and services offered with a supplemental discussion of specific contracts and programs when significant to the results. Additional information regarding our segments can be found in Note R to the Consolidated Financial Statements in Item 8.
AEROSPACE
Review of2018vs.2017
Year Ended December 3120182017Variance
Revenue$8,455$8,129$3264.0%
Operating earnings1,4901,577(87)(5.5)%
Operating margin17.6%19.4%
Gulfstream aircraft deliveries (in units)12112010.8%
The increase in the Aerospace segment’s revenue in2018consisted of the following:
Aircraft services$353
Aircraft manufacturing and completions(94)
Pre-owned aircraft67
Total increase$326
Aircraft services revenue increased due to higher demand for maintenance work and the acquisition in the second quarter of 2018 of Hawker Pacific, a leading provider of integrated aviation solutions across Asia Pacific and the Middle East. Additionally, we had seven pre-owned aircraft sales in2018compared
32
with five in2017. These increases were offset partially by a lower volume of custom completions of narrow-body and wide-body aircraft.
The change in the segment’s operating earnings in2018consisted of the following:
Aircraft manufacturing and completions$(206)
Aircraft services64
Pre-owned aircraft2
G&A/other expenses53
Total decrease$(87)
Aircraft manufacturing and completions operating earnings were down due to a shift in the mix of Gulfstream aircraft deliveries and the typical lower margin associated with the initial units of a new aircraft model, as well as a performance challenge in the wide-body aircraft custom completions business. Aircraft services operating earnings were particularly strong due to favorable cost performance and the mix of services provided. In addition, operating earnings were impacted favorably by lower G&A/other expenses, including reduced R&D expenses as we completed the G500 development and certification program. Overall, the Aerospace segment’s operating margin decreased180basis points to 17.6%.
Review of2017vs.2016
Year Ended December 3120172016Variance
Revenue$8,129$7,815$3144.0%
Operating earnings1,5771,39418313.1%
Operating margin19.4%17.8%
Gulfstream aircraft deliveries (in units)120121(1)(0.8)%
The Aerospace segment’s revenue increased in2017due primarily to additional deliveries of the ultra-large-cabin G650 and mid-cabin G280 aircraft, offset partially by a decrease in the number of G450 and G550 large-cabin aircraft deliveries. Aircraft services revenue increased, driven by higher demand for maintenance work and the acquisition of a fixed base operation (FBO) in 2017.
Operating earnings increased in2017due to favorable cost performance and the mix of ultra-large- and large-cabin aircraft deliveries. G&A/other expenses were higher in2017due primarily to increased R&D expenses associated with product-development efforts as the segment progressed with the certification of the G500 and G600 aircraft. Overall, the Aerospace segment’s operating margin increased 160 basis points to 19.4%.
2019Outlook
We expect the Aerospace segment’s2019revenue to be around $9.7 billion. Operating margin is expected to be approximately 15.5%, down from2018as a result of mix shift as the segment continues its transition to the new G500 and G600 aircraft as well as higher anticipated pre-owned aircraft sales, which typically carry no margin.
33
COMBAT SYSTEMS
Review of2018vs.2017
Year Ended December 3120182017Variance
Revenue$6,241$5,949$2924.9%
Operating earnings962937252.7%
Operating margin15.4%15.8%
The increase in the Combat Systems segment’s revenue in2018consisted of the following:
U.S. military vehicles$130
International military vehicles99
Weapons systems and munitions63
Total increase$292
Revenue was up across all areas of the Combat Systems segment in2018. Revenue from U.S. military vehicles increased due to higher volume on the Army’s Abrams tank programs, including work to produce Abrams M1A2 System Enhancement Package Version 3 (SEPv3) tanks, offset partially by lower volume on Stryker wheeled combat-vehicle programs as we completed delivery of the Stryker 30-millimeter cannon upgrade vehicles. Revenue from international military vehicles increased due to the production ramp up of Piranha wheeled armored vehicles, offset partially by lower revenue on a large contract to produce wheeled armored vehicles for an international customer. Weapons systems and munitions revenue was up due primarily to increased production of several products, including medium-caliber and tank ammunition programs.
The Combat Systems segment’s operating margin decreased 40 basis points compared with2017driven by contract mix in our combat vehicles business.
Review of2017vs.2016
Year Ended December 3120172016Variance
Revenue$5,949$5,530$4197.6%
Operating earnings93783110612.8%
Operating margin15.8%15.0%
The Combat Systems segment’s revenue increased in2017due primarily to higher volume on the U.S. Army’s Abrams and Stryker programs. Additionally, revenue was up due to increased production of several products, including bombs and Hydra-70 rockets for the U.S. government. Revenue from international military vehicles increased due to the ramp up in production on the British AJAX armoured fighting vehicle program and several international light armored vehicle (LAV) programs, offset largely by lower revenue on a large contract to produce wheeled armored vehicles for an international customer as the segment transitioned from engineering to production.
The Combat Systems segment’s operating margin increased 80 basis points in2017driven by improved operating performance across the segment’s portfolio. Operating earnings in 2016 included the impact of a loss on the design and development phase of the British AJAX armoured fighting vehicle program.
34
2019Outlook
We expect the Combat Systems segment’s 2019 revenue to be between $6.5 and $6.6 billion with operating earnings of $965 to $975.
INFORMATION TECHNOLOGY
Review of2018vs.2017
Year Ended December 3120182017Variance
Revenue$8,269$4,410$3,85987.5%
Operating earnings60837323563.0%
Operating margin7.4%8.5%
The Information Technology segment’s revenue increased due primarily to the CSRA acquisition in the second quarter of 2018. Operating margin decreased 110 basis points compared with 2017 due to intangible asset amortization expense from the CSRA acquisition. Excluding the impact of this amortization, the segment’s margin would have been 9.6%, reflecting the favorable impact of CSRA’s mix of higher-margin, fixed-price work. In the fourth quarter of 2018, we sold the Information Technology segment’s contact-center business, which had a small unfavorable impact on revenue.
Review of2017vs.2016
Year Ended December 3120172016Variance
Revenue$4,410$4,428$(18)(0.4)%
Operating earnings373340339.7%
Operating margin8.5%7.7%
Revenue in the Information Technology segment was essentially flat in2017as delays in procurement activities across a number of programs, particularly in our federal civilian business, offset growth in the segment’s intelligence business and the acquisition in late 2017 of a provider of mission-critical support services.
Despite the lower revenue, operating earnings increased, and operating margin expanded 80 basis points. The margin growth was driven primarily by strong program performance and favorable contract mix across the portfolio.
2019Outlook
We expect the Information Technology segment’s2019revenue to be approximately $8.3 billion, a slight increase from2018, reflecting a full year of CSRA’s results, offset partially by divestiture activities. We expect the segment’s operating margin to be around 7.5%.
35
MISSION SYSTEMS
Review of2018vs.2017
Year Ended December 3120182017Variance
Revenue$4,726$4,481$2455.5%
Operating earnings659638213.3%
Operating margin13.9%14.2%
The increase in the Mission Systems segment’s revenue in2018consisted of the following:
Space, intelligence and cyber systems$118
Ground systems and products69
Naval, air and electronic systems58
Total increase$245
Revenue was up across the Mission Systems segment in 2018. Revenue from space, intelligence and cyber systems increased due primarily to demand for our portfolio of encryption products. The growth in ground systems and products revenue was driven by increased activity on U.S. Army mobile communications networking programs and the ramp up of a program to design and develop the next-generation tactical communication and information system for the United Kingdom. Revenue from naval, air and electronic systems increased due primarily to higher volume on our U.S. Navy program for combat and seaframe control systems on Independence-variant Littoral Combat Ships.
The Mission Systems segment’s operating margin decreased 30 basis points in 2018 due to variations in program performance and mix.
Review of2017vs.2016
Year Ended December 3120172016Variance
Revenue$4,481$4,716$(235)(5.0)%
Operating earnings638601376.2%
Operating margin14.2%12.7%
The Mission Systems segment’s revenue decreased in 2017 as a result of funding delays across a number of programs, including the U.S. Army’s mobile communications network and computing and communications equipment programs, caused by the seven-month FY 2017 CR.
Despite the lower revenue, operating earnings increased, and operating margin expanded 150 basis points. The margin growth was driven primarily by strong program performance and favorable contract mix.
2019Outlook
We expect the Mission Systems segment’s2019revenue to be between $4.8 and $4.9 billion, an increase of between 2 and 3% over2018, with operating margin in the mid- to high-13% range.
36
MARINE SYSTEMS
Review of2018vs.2017
Year Ended December 3120182017Variance
Revenue$8,502$8,004$4986.2%
Operating earnings7616857611.1%
Operating margin9.0%8.6%
The increase in the Marine Systems segment’s revenue in2018consisted of the following:
U.S. Navy ship construction$424
Commercial ship construction171
U.S. Navy ship engineering, repair and other services(97)
Total increase$498
Revenue from U.S. Navy ship construction increased with higher volume on the Virginia-class submarine program, Arleigh Burke-class (DDG-51) destroyer program and John Lewis class (T-AO-205) fleet replenishment oiler contract, offset partially by lower volume on the Navy’s Expeditionary Sea Base (ESB) program. Commercial ship construction revenue increased as work ramped up on a contract for two container ships. Revenue from U.S. Navy ship engineering, repair and other services decreased driven by a lower volume of submarine repair work and the timing of surface ship repair work, offset partially by increased work on the Columbia-class submarine development program and Virginia-class submarine design enhancements.
The Marine Systems segment’s operating margin increased 40 basis points in 2018 reflecting solid operating performance across all of our shipyards.
Review of2017vs.2016
Year Ended December 3120172016Variance
Revenue$8,004$8,072$(68)(0.8)%
Operating earnings6855959015.1%
Operating margin8.6%7.4%
Revenue in 2017 was down from Jones Act commercial construction following the delivery of six ships in 2016 and two ships in 2017. Additionally, revenue decreased due to timing on the Virginia-class submarine program, offset partially by higher volume on the ESB program. These decreases were offset partially by additional work related to the Columbia-class submarine development program and Virginia-class submarine design enhancements, and a higher-volume of submarine repair work.
Operating margin increased 120 basis points due primarily to the 2016 impact of cost growth associated with the restart of the Navy’s DDG-51 program. The segment’s operating margin in 2017 was also affected favorably by a decrease in lower-margin commercial ship work.
2019Outlook
We expect the Marine Systems segment’s 2019 revenue to be approximately $9 billion, an increase of 6% from 2018. Operating margin is expected to be around 8.5%.
37
CORPORATE
Corporate operating results consisted of the following:
Year Ended December 31201820172016
Operating (expense) income$(23)$26$(17)
Corporate operating results in2018included one-time transaction-related charges of approximately$45associated with the costs to complete the CSRA acquisition. Excluding these charges, Corporate operating results have two primary components: pension and other post-retirement benefit income, and stock option expense.
As discussed in Note A to the Consolidated Financial Statements in Item 8, Corporate operating results are impacted by Accounting Standards Update (ASU) 2017-07. ASU 2017-07 requires the non-service cost components of pension and other post-retirement benefit cost (e.g., interest cost) to be reported in other income (expense) in the Consolidated Statement of Earnings. In our defense segments, pension and other post-retirement benefit costs are allocable contract costs. For these segments, we report the offset for the non-service cost components in Corporate operating results. This amount exceeded our stock option expense in 2018 and 2017.
We expect Corporate operating costs of approximately $20 in2019, reflecting projected stock option expense in excess of the projected offset of non-service cost components of pension and other post-retirement benefit cost for our defense segments.
OTHER INFORMATION
PRODUCT AND SERVICE REVENUE AND OPERATING COSTS
Review of2018vs.2017
Year Ended December 3120182017Variance
Revenue:
Products$20,149$19,016$1,1336.0%
Services16,04411,9574,08734.2%
Operating Costs:
Products$(15,894)$(14,773)$(1,121)7.6%
Services(13,584)(9,958)(3,626)36.4%
The increase in product revenue in2018consisted of the following:
Ship construction$598
Military vehicle production307
Other, net228
Total increase$1,133
Ship construction revenue increased due to higher volume on the Virginia-class submarine program, the DDG-51 destroyer program, the T-AO-205 fleet replenishment oiler contract and commercial container ship construction. Military vehicle production revenue increased due to higher volume on the U.S. Army’s
38
Abrams tank programs and the ramp up of production on Piranha vehicles for international customers. The primary drivers of the increase in product operating costs were the changes in volume on the programs described above.
The increase in service revenue in2018consisted of the following:
IT services$3,859
Aircraft services353
Other, net(125)
Total increase$4,087
IT services revenue increased due primarily to the CSRA acquisition in the second quarter of 2018. The aircraft services revenue increase was due to higher demand for maintenance work and the acquisition of Hawker Pacific in the second quarter of 2018. Service operating costs increased at a higher rate than revenue due primarily to intangible asset amortization expense from the CSRA acquisition.
Review of2017vs.2016
Year Ended December 3120172016Variance
Revenue:
Products$19,016$19,010$6—%
Services11,95711,5514063.5%
Operating Costs:
Products$(14,773)$(15,155)$382(2.5)%
Services(9,958)(9,741)(217)2.2%
The increase in product revenue in2017consisted of the following:
Military vehicle production$261
Aircraft manufacturing and completions246
Ship construction(310)
C4ISR products*(173)
Other, net(18)
Total increase$6
* C4ISR (command, control, communications, computers, intelligence, surveillance and reconnaissance) solutions in our Mission Systems segment
Military vehicle production revenue increased due to higher volume on the U.S. Army’s Abrams and Stryker programs and the ramp up in production on the AJAX program and several international LAV contracts. Aircraft manufacturing and completions revenue increased due to additional deliveries of the ultra-large-cabin G650 and mid-cabin G280 aircraft. These increases were offset largely by decreased ship construction revenue driven by timing on the Virginia-class submarine program and reduced Jones Act commercial ship construction volume, and decreased revenue from C4ISR products driven by funding delays caused by the extended FY 2017 CR.
While product revenue was steady in 2017, product operating costs decreased due to strong operating performance in our Aerospace and Mission Systems segments and the impact of DDG-51 program cost growth in 2016 in our Marine Systems segment.
39
The increase in service revenue in2017consisted of the following:
Ship engineering, repair and other services$243
Aircraft services118
Other, net45
Total increase$406
Revenue from ship engineering, repair and other services increased due to additional work related to the Columbia-class submarine development program and Virginia-class submarine design enhancements, and a higher volume of submarine repair work. Aircraft services revenue increased driven by higher demand for maintenance work and the acquisition of an FBO in2017.
Service operating costs increased in 2017 at a lower rate than revenue due primarily to strong operating performance in our Information Technology segment.
G&A EXPENSES
As a percentage of revenue, G&A expenses were6.2%in2018,6.5%in2017and6.3%in2016. We expect G&A expenses as a percentage of revenue in2019to be generally consistent with2018.
INTEREST, NET
Net interest expense was$356in2018,$103in2017and$91in2016. The increase in2018was due primarily to the impact of financing the CSRA acquisition, including the issuance of$7.5 billionof fixed- and floating-rate notes in the second quarter of 2018. The increase in 2017 was due primarily to a $500 net increase in long-term debt beginning in the third quarter of 2016. See Note K to the Consolidated Financial Statements in Item 8 for additional information regarding our debt obligations, including interest rates. We expect 2019 net interest expense to be approximately $430, an increase from 2018, reflecting a full year of financing for the CSRA acquisition.
OTHER, NET
Net other expense was$16in2018and$56in2017, and net other income was$3in2016. Net other expense/income represents primarily the non-service cost components of pension and other post-retirement benefit cost, including amounts from legacy CSRA plans assumed as of the acquisition date. The 2018 expense also includes approximately $30 of transaction costs associated with the CSRA acquisition. In2019, we expect net other income to be approximately $60 due primarily to the investment income from our commercial pension plans.
PROVISION FOR INCOME TAX, NET
Our effective tax rate was17.8%in2018,28.6%in2017and26.7%in2016. The decrease in our effective tax rate in 2018 is due primarily to the reduction of the U.S. corporate statutory tax rate from 35% to 21% beginning on January 1, 2018, resulting from the enactment of the Tax Cuts and Jobs Act (tax reform) on December 22, 2017. The effective tax rate in 2018 also includes the impact of tax benefits associated with equity-based compensation and a discretionary pension plan contribution. The effective tax rate in 2017 included a $119 unfavorable impact, or 290 basis points, resulting from tax reform. For further discussion, including a reconciliation of our effective tax rate from the statutory federal rate, see Note F to the Consolidated Financial Statements in Item 8. For2019, we anticipate a full-year effective tax rate between 18 and 18.5%.
40
DISCONTINUED OPERATIONS, NET OF TAX
Concurrent with the acquisition of CSRA, we were required by a government customer to dispose of certain CSRA operations to address an organizational conflict of interest with respect to services provided to the customer. In 2018, we sold these operations. In accordance with U.S. generally accepted accounting principles (GAAP), the sale did not result in a gain for financial reporting purposes. However, the sale generated a taxable gain, resulting in tax expense of$13.
In 2013, we settled litigation with the U.S. Navy related to the terminated A-12 aircraft contract in the company’s former tactical military aircraft business. In connection with the settlement, we released some rights to reimbursement of costs on ships under contract at our Bath, Maine, shipyard. As we progressed through the shipbuilding process, we determined that the cost associated with this settlement was greater than anticipated. Therefore, in 2016, we recognized an$84loss, net of tax, to adjust the previously recognized settlement value. In addition, we recognized$23of losses, net of tax, in 2016 related to other former operations of the company.
BACKLOG AND ESTIMATED POTENTIAL CONTRACT VALUE
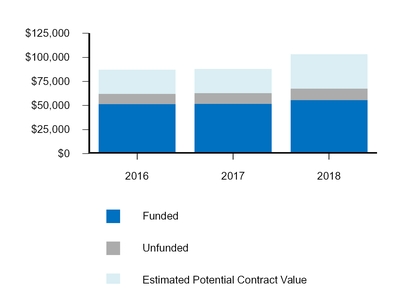
Our total backlog, including funded and unfunded portions, was$67.9 billionon December 31,2018, up 7.4% from$63.2 billionat the end of2017. Our total backlog is equal to our remaining performance obligations under contracts that meet the criteria in ASC Topic 606 as discussed in Note C to the Consolidated Financial Statements in Item 8. Our total estimated contract value, which combines total backlog with estimated potential contract value, was$103.4 billiononDecember 31, 2018, up 17.5% from $88 billion at the end of 2017.
41
AEROSPACE
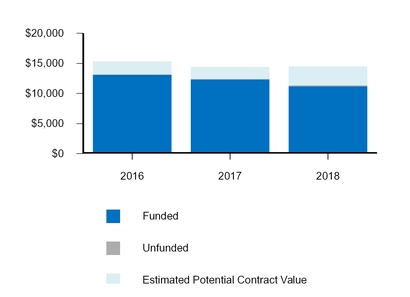
Aerospace funded backlog represents new aircraft and custom completion orders for which we have definitive purchase contracts and deposits from customers. Unfunded backlog consists of agreements to provide future aircraft maintenance and support services. The Aerospace segment ended2018with backlog of$11.4 billioncompared with $12.5 billion at year-end2017.
Orders in2018reflected solid demand across our product and services portfolio. We received orders for all models of in-production Gulfstream aircraft, including additional orders for the G500 and G600 aircraft.
Beyond total backlog, estimated potential contract value represents primarily options and other agreements with existing customers to purchase new aircraft and aircraft services. OnDecember 31, 2018, estimated potential contract value in the Aerospace segment was$3.1 billion, up 60.1% from$2 billionat year-end2017. This increase was due largely to a multi-aircraft, multi-year agreement entered into with an existing corporate customer in the fourth quarter of 2018.
Demand for Gulfstream aircraft remains strong across customer types and geographic regions, generating orders from public and privately held companies, individuals, and governments around the world. Geographically, U.S. customers represented approximately 65% of the segment’s orders in2018and 55% of the segment’s backlog onDecember 31, 2018, demonstrating continued strong domestic demand.
DEFENSE SEGMENTS
The total backlog in our defense segments represents the estimated remaining sales value of work to be performed under firm contracts. The funded portion of this backlog includes items that have been authorized and appropriated by the U.S. Congress and funded by customers, as well as commitments by international customers that are approved and funded similarly by their governments. The unfunded portion includes the amounts that we believe are likely to be funded, but there is no guarantee that future budgets and appropriations will provide the same funding level currently anticipated for a given program.
Estimated potential contract value in our defense segments includes unexercised options associated with existing firm contracts and work awarded on unfunded indefinite delivery, indefinite quantity (IDIQ)
42
contracts. Contract options in our defense business represent agreements to perform additional work under existing contracts at the election of the customer. We recognize options in backlog when the customer exercises the option and establishes a firm order. For IDIQ contracts, we evaluate the amount of funding we expect to receive and include this amount in our estimated potential contract value. This amount is often less than the total IDIQ contract value, particularly when the contract has multiple awardees. The actual amount of funding received in the future may be higher or lower than our estimate of potential contract value.
Total backlog in our defense segments was$56.5 billiononDecember 31, 2018, up 11.4% from$50.7 billionat the end of2017. The most significant drivers of the growth in 2018 were the CSRA acquisition in our Information Technology segment and contracts totaling $4.8 billion awarded by the U.S. Navy for the construction of five Arleigh Burke-class (DDG-51) guided-missile destroyers. Each of our segments achieved an organic book-to-bill ratio equal to or greater than 1-to-1 in 2018.
Estimated potential contract value in our defense segments was$32.4 billiononDecember 31, 2018, up 41.7% from$22.8 billionat year-end2017due in large part to the CSRA acquisition and a multibillion-dollar IDIQ contract awarded by the U.S. Army for computing and communications equipment under the Common Hardware Systems-5 (CHS-5) program.
COMBAT SYSTEMS
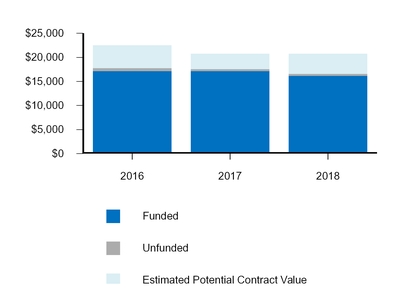
The Combat Systems segment’s total backlog was$16.6 billionat the end of2018, compared with$17.6 billionat year-end2017. The segment’s backlog includes the work remaining on two significant multi-year contracts awarded in 2014:•$4.5 billion to provide wheeled armored vehicles and logistics support to an international customer through 2024.•$3.4 billion from the U.K Ministry of Defence to produce AJAX armoured fighting vehicles scheduled for delivery to the British Army through 2024 and related in-service support.
43
The segment has a variety of additional international military vehicle production programs in backlog, notably:•$940 to produce Piranha armored vehicles for several non-U.S. customers, including $365 to produce more than 300 armored personnel carriers for the Danish Defense Acquisition and Logistics Organization and $255 to deliver up to 227 Piranha vehicles in six variants to the Romanian Armed Forces.•$380 for LAVs for several non-U.S. customers, including $200 for the upgrade and modernization of LAV III combat vehicles for the Canadian Army.•$270 to upgrade Duro tactical vehicles for the Swiss government through 2022.
One of the U.S. Army’s top priorities is readiness of its platform products through critical modernization efforts, including upgrades for both the Abrams main battle tank and Stryker wheeled combat-vehicle programs.
The segment received $1.4 billion of orders for Abrams main battle tank modernization and upgrade programs for the U.S. Army and U.S. partners in2018, ending the year with backlog of $2.7 billion. For the Army, backlog included $1.5 billion to produce M1A2 SEPv3 tanks, deliver M1A2 SEP components, and provide associated program support, and $300 to design and develop SEPv4 prototypes with upgraded sensors. Backlog included $640 to modernize Abrams main battle tanks for U.S. partners. An additional $395 for Abrams tank programs is included in our estimated potential contract value at year end.
The Army’s Stryker wheeled combat-vehicle program represented $820 of the segment’s backlog onDecember 31, 2018, with vehicles scheduled for delivery through 2021. The segment received $1 billion of Stryker orders in2018, including awards to produce double-V-hull vehicles, upgrade vehicles with integrated short-range air defense capabilities, and provide support and engineering services.
The backlog at year end also included $325 to develop and deliver 12 prototype vehicles for the Mobile Protected Firepower (MPF) program, which will increase the firepower for the Army’s Infantry Brigade Combat Teams (IBCTs).
The Combat Systems segment’s backlog onDecember 31, 2018, also included $2.5 billion for multiple weapons systems and munitions programs, including $415 to produce Hydra-70 rockets for the Army.
The segment’s estimated potential contract value was$4.2 billiononDecember 31, 2018, up 32.8% from$3.2 billionat year-end2017. Estimated potential contract value increased in2018driven by unexercised options associated with 2018 awards to develop and deliver prototype vehicles for the MPF program, to produce Piranha vehicles for the Romanian Armed Forces and to deliver various rounds of medium-caliber ammunition to the U.S. Air Force.
44
INFORMATION TECHNOLOGY
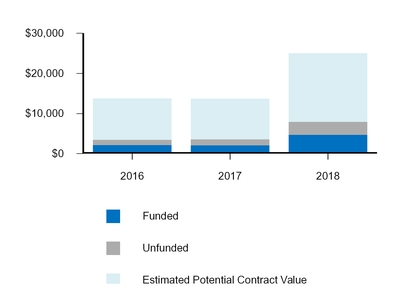
The Information Technology segment’s backlog consists of thousands of contracts and task orders, and approximately 15-20% of its portfolio is recompeted each year. The segment’s total backlog was$8 billionat the end of2018, up 120.6% from$3.6 billionat year-end2017due to the CSRA acquisition in the second quarter of 2018. This amount does not include$17.1 billionof estimated potential contract value associated with its anticipated share of IDIQ contracts and unexercised options onDecember 31, 2018. Funding from IDIQ contracts added $4.2 billion to the segment’s backlog in 2018, over 50% of the segment’s orders.
In 2018, the segment achieved a book-to-bill ratio of 1-to-1 for the fourth consecutive year driven by several significant contract awards during the year, including the following:•$375 from the New York State Department of Health to provide engineering and technical improvements to the state’s health benefits exchange.•$195 from the U.S. Air Force for the Battlefield Information Collection and Exploitation System (BICES) program to provide information sharing support to coalition operations.•$145 to provide operations and maintenance support services for a Department of Homeland Security (DHS) data center.•$110 from the U.S. Naval Air Warfare Center for design, development and support of shipboard and airborne platforms.
The segment’s backlog at year-end 2018 also included the following key programs:•$1.1 billion to provide classified IT infrastructure services to an agency of the DoD with an additional $1.1 billion of estimated potential contract value remaining under the contract.•$210 to provide supply chain management services to the U.S. Department of State (DoS).•$170 from the New York State Department of Health to manage the state’s Medicaid Management Information System. $120 of estimated potential contract value remains under the contract.•$160 to provide turnkey training and simulation services for the U.S. Army’s Aviation Center of Excellence in Fort Rucker, Alabama. An additional $495 of estimated potential contract value remains under the contract.
45
MISSION SYSTEMS
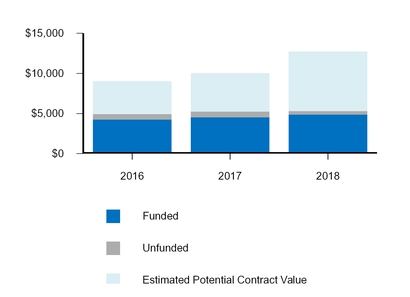
Similar to the Information Technology segment, the Mission Systems segment’s backlog consists of thousands of contracts and task orders. The segment’s total backlog remained steady at $5.3 billion at the end of2018compared with year-end2017. This amount does not include $7.4 billion of estimated potential contract value associated with its anticipated share of IDIQ contracts and unexercised options onDecember 31, 2018. Estimated potential contract value increased 55.6% from year-end 2017 driven by a multibillion-dollar IDIQ contract awarded by the U.S. Army for computing and communications equipment under the CHS-5 program. Funding of IDIQ contracts and options added $2.6 billion to the segment’s backlog in2018, over 50% of the segment’s orders.
In 2018, the segment achieved a book-to-bill ratio of 1-to-1 or higher for the fourth consecutive year driven by several significant contract awards during the year, including the following:•$400 from the Army for computing and communications equipment under the CHS-4 and CHS-5 programs.•$395 from the U.S. Navy for combat and seaframe control systems on Independence-variant Littoral Combat Ships (LCSs).•$210 from the Army for its mobile communications network.•$205 from the National Aeronautics and Space Administration (NASA) for the Space Network Ground Segment Sustainment (SGSS) program to modernize NASA’s ground infrastructure systems for its satellite network.
The segment’s backlog at year-end 2018 also included the following key programs:•$780 for the Canadian Maritime Helicopter Project (MHP) to provide integrated mission systems, training and support for Canadian marine helicopters.•$630 for combat and seaframe control systems for the Navy Independence-variant LCSs.•$260 to design and develop the next-generation tactical communication and information system in the initial phase of the U.K.’s Morpheus program.•$235 to provide fire control system modifications for ballistic-missile (SSBN) submarines.
46
MARINE SYSTEMS
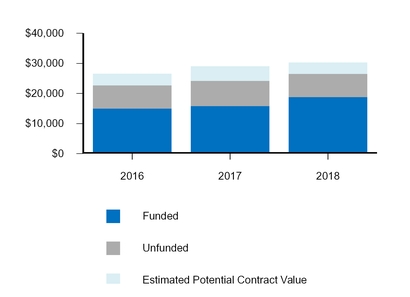
The Marine Systems segment’s backlog consists of long-term submarine and surface ship construction programs, as well as numerous engineering and repair contracts. The segment’s book-to-bill ratio exceeded 1-to-1 in2018, resulting in backlog growth of 9.8% from$24.2 billionat year-end2017to$26.6 billionat the end of2018.
The Virginia-class submarine program was the company’s largest program in2018and the largest contract in the company’s backlog. The segment’s backlog at year-end2018included$8.8 billionfor 11 Virginia-class submarines scheduled for delivery through 2023.
Navy destroyer programs represented$8.2 billionof the segment’s backlog at year-end2018, an increase of 106.9% driven by contracts totaling $4.8 billion awarded by the Navy for the construction of five DDG-51 guided-missile destroyers. As of year end, we had construction contracts for 11 DDG-51 destroyers scheduled for delivery through 2027. Backlog at year-end2018also included one ship under the DDG-1000 program scheduled for delivery in 2020.
The Marine Systems segment’s backlog onDecember 31, 2018, included$95for construction of ESB auxiliary support ships. The segment has delivered four ships in the program, and construction is underway on the fifth ship, scheduled for delivery in 2019. During 2018, the segment received funding for long-lead materials for a sixth ship.
In 2016, we were awarded a design and construction contract for the lead ship in the Navy’s new class of T-AO-205 fleet replenishment oilers, along with options for five additional ships. During 2018, the Navy exercised the options for three additional ships. Backlog at year-end2018was$1.8billion for the program, and estimated potential contract value totaled $1 billion for the program.
The year-end backlog also included a contract from a commercial customer for two liquefied natural gas (LNG)-capable Jones Act ships scheduled for delivery through 2020.
Complementing these ship construction programs, engineering services represented approximately$6.2 billionof the Marine Systems segment’s backlog onDecember 31, 2018. Design and prototype development efforts on the Columbia-class submarine program represented$5.1 billionof this amount.
47
Year-end backlog for ship and submarine maintenance, repair and other services totaled$1.2 billion, including $955 for surface-ship repair operations.
FINANCIAL CONDITION, LIQUIDITY AND CAPITAL RESOURCES
We place a strong emphasis on cash flow generation. This focus gives us the flexibility for capital deployment while preserving a strong balance sheet to position us for future opportunities. Cash generated by operating activities over the past three years was deployed to pay dividends, fund capital expenditures and business acquisitions, and repurchase our common stock.
Year Ended December 31201820172016
Net cash provided by operating activities$3,148$3,876$2,163
Net cash used by investing activities(10,234)(788)(391)
Net cash provided (used) by financing activities5,086(2,399)(2,169)
Net cash used by discontinued operations(20)(40)(54)
Net (decrease) increase in cash and equivalents(2,020)649(451)
Cash and equivalents at beginning of year2,9832,3342,785
Cash and equivalents at end of year9632,9832,334
Short- and long-term debt(12,417)(3,982)(3,888)
Net debt$(11,454)$(999)$(1,554)
Debt-to-equity (a)105.8%34.8%37.7%
Debt-to-capital (b)51.4%25.8%27.4%(a)Debt-to-equity ratio is calculated as total debt divided by total equity as of year end.(b)Debt-to-capital ratio is calculated as total debt divided by the sum of total debt plus total equity as of year end.
Our net debt position, defined as debt less cash and equivalents and marketable securities increased in 2018 due primarily to financing the CSRA acquisition.
We expect to continue to generate funds in excess of our short- and long-term liquidity needs. We believe we have adequate funds on hand and sufficient borrowing capacity to execute our financial and operating strategy. The following is a discussion of our major operating, investing and financing activities for each of the past three years, as classified on the Consolidated Statement of Cash Flows in Item 8.
OPERATING ACTIVITIES
We generated cash from operating activities of$3.1 billionin2018,$3.9 billionin2017and$2.2 billionin2016. The primary driver of cash inflows in all three years was net earnings. However, cash flows in all three years were affected negatively by growth in operating working capital, particularly on an international wheeled armored vehicle contract in our Combat Systems segment (for further discussion, see Note H to the Consolidated Financial Statements in Item 8). Additionally, cash flows in 2018 reflected a discretionary pension plan contribution of$255. In 2017 and 2016, the build-up of inventory related to the new G500 and G600 aircraft programs in our Aerospace segment also negatively affected operating cash flows. However, the 2017 growth in operating working capital was offset by lower income tax payments.
48
INVESTING ACTIVITIES
Cash used for investing activities was$10.2billion in2018,$788in2017and$391in2016. Our investing activities include cash paid for business acquisitions and capital expenditures; proceeds from asset sales; and purchases, sales and maturities of marketable securities.
Business Acquisitions.The primary use of cash for investing activities in 2018 was business acquisitions. In2018, we acquired six businesses for an aggregate of$10.1billion, including $9.7 billion for CSRA. In2017, we acquiredfourbusinesses for an aggregate of$399. In2016, we acquiredtwobusinesses for an aggregate of$58.
Capital Expenditures.Capital expenditures were$690in2018,$428in2017and$392in2016. Capital expenditures increased in 2018 to support growth at Gulfstream and our shipyards. We expect capital expenditures to be approximately 3% of revenue in2019.
Other, Net.Investing activities also include proceeds from asset sales.In2018, we completed the sale ofthreebusinesses in our Information Technology segment:a commercial health products business,certain CSRA operations we were required by a government customer to dispose of to address an organizational conflict of interest with respect to services provided to the customer, anda public-facing contact-center business.
FINANCING ACTIVITIES
Cash provided by financing activities was$5.1 billionin2018compared with cash used by financing activities of$2.4 billionin2017and$2.2 billionin2016. Net cash from financing activities includes proceeds received from debt and commercial paper issuances and employee stock option exercises. Our financing activities also include repurchases of common stock, payment of dividends and debt repayments.
Share Repurchases.Our board of directors from time to time authorizes management’s repurchase of outstanding shares of our common stock on the open market. We repurchased10.1 millionof our outstanding shares for$1.8 billionin2018,7.8 millionshares for$1.5 billionin2017and14.2 millionshares for$2 billionin2016. As a result, we have reduced our shares outstanding by approximately8%since the end of2015. OnDecember 31, 2018, 7.5 millionshares remained authorized by our board of directors for repurchase, approximately3% of our total shares outstanding.
Dividends.On March 7, 2018, our board of directors declared an increased quarterly dividend of $0.93 per share, the21st consecutive annual increase. Previously, the board had increased the quarterly dividend to $0.84 per share in March 2017 and $0.76 per share in March 2016. Cash dividends paid were$1.1billion in2018,$986in2017and$911in2016.
Debt and Commercial Paper Issuances and Repayments.In 2018, we issued $7.5 billion of fixed- and floating-rate notes to finance the acquisition of CSRA. Additionally, in 2018, we paid $450 to satisfy obligations under CSRA’s accounts receivable purchase agreement. In the third quarter of 2017, we issued $1 billion of fixed-rate notes that were used to repay $900 of fixed-rate notes that matured in the fourth quarter of 2017 and for general corporate purposes. In 2016, we repaid $500 of fixed-rate notes on their maturity date with cash on hand and issued $1 billion of fixed-rate notes for general corporate purposes.
We have no material repayments of long-term debt scheduled in 2019. See Note K to the Consolidated Financial Statements in Item 8 for additional information regarding our debt obligations, including scheduled debt maturities and interest rates.
49
OnDecember 31, 2018, we had$850of commercial paper outstanding. We have$5 billionin committed bank credit facilities for general corporate purposes and working capital needs and to support our commercial paper issuances. These credit facilities include a$2 billion364-day facility expiring inMarch 2019, a$1 billionmulti-year facility expiring inNovember 2020and a$2 billionmulti-year facility expiring inMarch 2023. We may renew or replace these credit facilities in whole or in part at or prior to their expiration dates. Our credit facilities are guaranteed by several of our100%-owned subsidiaries. We also have an effective shelf registration on file with the Securities and Exchange Commission that allows us to access the debt markets.
NON-GAAP FINANCIAL MEASURES
We emphasize the efficient conversion of net earnings into cash and the deployment of that cash to maximize shareholder returns. As described below, we use free cash flow from operations and return on invested capital (ROIC) to measure our performance in these areas. While we believe these metrics provide useful information, they are not defined operating measures under GAAP, and there are limitations associated with their use. Our calculation of these metrics may not be completely comparable to similarly titled measures of other companies due to potential differences in the method of calculation. As a result, the use of these metrics should not be considered in isolation from, or as a substitute for, other GAAP measures.
Free Cash Flow.We define free cash flow from operations as net cash provided by operating activities less capital expenditures. We believe free cash flow from operations is a useful measure for investors because it portrays our ability to generate cash from our businesses for purposes such as repaying maturing debt, funding business acquisitions, repurchasing our common stock and paying dividends. We use free cash flow from operations to assess the quality of our earnings and as a key performance measure in evaluating management. The following table reconciles the free cash flow from operations with net cash provided by operating activities, as classified on the Consolidated Statement of Cash Flows in Item 8:
Year Ended December 3120182017201620152014*
Net cash provided by operating activities$3,148$3,876$2,163$2,607$3,830
Capital expenditures(690)(428)(392)(569)(521)
Free cash flow from operations$2,458$3,448$1,771$2,038$3,309
Cash flows as a percentage of earnings
from continuing operations:
Net cash provided by operating activities94%133%81%86%143%
Free cash flow from operations73%118%66%67%124%
* 2014 information has not been restated for ASC Topic 606 and is, therefore, not comparable to the 2018, 2017, 2016 and 2015 information.
Return on Invested Capital.We believe ROIC is a useful measure for investors because it reflects our ability to generate returns from the capital we have deployed in our operations. We use ROIC to evaluate investment decisions and as a performance measure in evaluating management. We define ROIC as net operating profit after taxes divided by average invested capital. Net operating profit after taxes is defined as earnings from continuing operations plus after-tax interest and amortization expense, calculated using the statutory federal income tax rate. Average invested capital is defined as the sum of the average debt and shareholders’ equity excluding accumulated other comprehensive loss. ROIC excludes goodwill impairments and non-economic accounting changes as they are not reflective of company performance.
50
ROIC is calculated as follows:
Year Ended December 3120182017201620152014*
Earnings from continuing operations$3,358$2,912$2,679$3,036$2,673
After-tax interest expense29576646467
After-tax amortization expense21351577579
Net operating profit after taxes$3,866$3,039$2,800$3,175$2,819
Average invested capital$25,367$18,099$17,168$17,579$18,673
Return on invested capital15.2%16.8%16.3%18.1%15.1%
* 2014 information has not been restated for ASC Topic 606 and is, therefore, not comparable to the 2018, 2017, 2016 and 2015 information.
ADDITIONAL FINANCIAL INFORMATION
OFF-BALANCE SHEET ARRANGEMENTS
OnDecember 31, 2018, other than operating leases, we had no material off-balance sheet arrangements.
CONTRACTUAL OBLIGATIONS AND COMMERCIAL COMMITMENTS
The following tables present information about our contractual obligations and commercial commitments onDecember 31, 2018:
Payments Due by Period
Contractual ObligationsTotal Amount CommittedLess Than 1 Year1-3 Years4-5 YearsMore Than 5 Years
Debt (a)$14,361$1,318$6,040$2,569$4,434
Capital lease obligations4339216210970
Operating leases1,689297430264698
Purchase obligations (b)26,79914,7038,9182,495683
Other long-term liabilities (c)23,8425,4683,2152,35612,803
$67,124$21,878$18,765$7,793$18,688
(a)Includes scheduled interest payments. See Note K to the Consolidated Financial Statements in Item 8 for a discussion of long-term debt.
(b)Includes amounts committed under legally enforceable agreements for goods and services with defined terms as to quantity, price and timing of delivery. This amount includes$17.7 billionof purchase obligations for products and services to be delivered under firm government contracts under which we would expect full recourse under normal contract termination clauses.
(c)Represents other long-term liabilities on our Consolidated Balance Sheet, including the current portion of these liabilities. The projected timing of cash flows associated with these obligations is based on management’s estimates, which are based largely on historical experience. This amount also includes all liabilities under our defined-benefit retirement plans. See Note Q to the Consolidated Financial Statements in Item 8 for information regarding these liabilities and the plan assets available to satisfy them.
Amount of Commitment Expiration by Period
Commercial CommitmentsTotal Amount CommittedLess Than 1 Year1-3 Years4-5 YearsMore Than 5 Years
Letters of credit and guarantees*$1,658$1,173$195$165$125
Aircraft trade-in options*9898———
$1,756$1,271$195$165$125
* See Note O to the Consolidated Financial Statements in Item 8 for a discussion of letters of credit and aircraft trade-in options.
51
APPLICATION OF CRITICAL ACCOUNTING POLICIES
Management’s Discussion and Analysis of Financial Condition and Results of Operations is based on our Consolidated Financial Statements, which have been prepared in accordance with GAAP. The preparation of financial statements in accordance with GAAP requires that we make estimates and assumptions thataffect the reported amounts of assets and liabilities and the disclosure of contingent assets and liabilities at the date of the financial statements, as well as the reported amounts of revenue and expenses during the reporting period. On an ongoing basis, we evaluate our estimates including most pervasively those related to various assumptions and projections for our long-term contracts and programs. Other significant estimates include those related to goodwill and intangible assets, income taxes, pension and other post-retirement benefits, workers’ compensation, warranty obligations and litigation contingencies. We employ judgment in making our estimates, but they are based on historical experience, currently available information and various other assumptions that we believe to be reasonable under the circumstances. These estimates form the basis for making judgments about the carrying values of assets and liabilities that are not readily available from other sources. Actual results may differ from these estimates. We believe our judgment is applied consistently and produces financial information that fairly depicts the results of operations for all periods presented.
In our opinion, the following policies are critical and require the use of significant judgment in their application:
Revenue.The majority of our revenue is derived from long-term contracts and programs that can span several years.We account for revenue in accordance withASCTopic 606, Revenue from Contracts with Customers.Theunit of account in ASC Topic 606is a performance obligation.A contract’s transaction price is allocated to each distinct performance obligation within that contract and recognized as revenue when, or as, the performance obligation is satisfied.Our performance obligations are satisfied over time as work progresses or at a point in time.
Substantially all of our revenue in the defense segments is recognized over time, because control is transferred continuously to our customers.Typically, revenue is recognized over time using costs incurred to date relative to total estimated costs at completion to measure progress toward satisfying our performance obligations. Incurred cost represents work performed, which corresponds with, and thereby best depicts, the transfer of control to the customer. Contract costs include labor, material, overhead and, when appropriate, G&A expenses.
The majority of our revenue recognized at a point in time is for the manufacture of business-jet aircraft in our Aerospace segment.Revenue on these contracts is recognizedwhen the customer obtains control of the asset, which is generally upon delivery and acceptance by the customer of the fully outfitted aircraft.
Accounting for long-term contracts and programs involves the use of various techniques to estimate total contract revenue and costs.For long-term contracts, we estimate the profit on a contract as the difference between the total estimated revenue and expected costs to complete a contract and recognize that profit over the life of the contract.
Contract estimates are based on various assumptions to project the outcome of future events that often span several years.These assumptions include labor productivity and availability; the complexity of the work to be performed; the cost and availability of materials; the performance of subcontractors; and the availability and timing of funding from the customer.
The nature of our contracts gives rise to several types of variable consideration, including claims and award and incentive fees. We include in our contract estimates additional revenue for submitted contract
52
modifications or claims against the customer when we believe we have an enforceable right to the modification or claim, the amount can be estimated reliably and its realization is probable. In evaluating these criteria, we consider the contractual/legal basis for the claim, the cause of any additional costs incurred, the reasonableness of those costs and the objective evidence available to support the claim. We include award or incentive fees in the estimated transaction price when there is a basis to reasonably estimate the amount of the fee. These estimates are based on historical award experience, anticipated performance and our best judgment at the time. Because of our certainty in estimating these amounts, they are included in the transaction price of our contracts and the associated remaining performance obligations.
As a significant change in one or more of these estimates could affect the profitability of our contracts, we review and update our contract-related estimates regularly.We recognize adjustments in estimated profit on contracts under the cumulative catch-up method.Under this method, the impact of the adjustment on profit recorded to date on a contract is recognized in the period the adjustment is identified.Revenue and profit in future periods of contract performance are recognized using the adjusted estimate.The aggregate impact of adjustments in contract estimates increased ouroperating earnings (and diluted earnings per share) by$345($0.91) in2018,$323($0.69) in2017and$16($0.03) in2016. Whileno adjustment on any one contract was material to our Consolidated Financial Statements in2018,2017or2016, the amount in 2016 was negatively impacted by a loss on the design and development phase of the AJAX program in our Combat Systems segment and cost growth associated with the restart of the Navy’s DDG-51 program in our Marine Systems segment.
Consistent with industry practice, we classify assets and liabilities related to long-term contracts as current, even though some of these amounts may not be realized within one year.The timing of revenue recognition, billings and cash collections results in billed accounts receivable, unbilled receivables (contract assets), and customer advances and deposits (contract liabilities) on the Consolidated Balance Sheet.These assets and liabilities are reported on the Consolidated Balance Sheet on a contract-by-contract basis at the end of each reporting period.
CSRA Acquisition.We are required to estimate the fair value of the assets acquired and liabilities assumed in business combinations as of the acquisition date, including identified intangible assets. The amount of purchase price paid in excess of the net assets acquired is recorded as goodwill. The fair values are estimated in accordance with the principles of ASC 820, Fair Value Measurement, which defines fair value as the price that would be received to sell an asset or paid to transfer a liability in an orderly transaction between market participants. The fair values of the net assets acquired are determined primarily using Level 3 inputs (inputs that are unobservable to the marketplace participant).
The most significant of the fair value estimates is related to long-lived assets, specifically intangible assets subject to amortization. We have valued $2.1 billion of acquired intangible assets in connection with the CSRA acquisition. This amount was determined based primarily on CSRA’s projected cash flows. The projected cash flows include various assumptions, including the timing of work embedded in backlog, success in securing future business, profitability of work, and the appropriate risk-adjusted interest rate used to discount the projected cash flows.
We are in various phases of valuing the assets acquired and liabilities assumed, and our estimate of these values was still preliminary onDecember 31, 2018. Therefore,these provisional amounts are subject to change as we continue to evaluate information required to complete the valuations throughout the measurement period, which will extend into the second quarter of 2019.
Reorganization of Operating Segments and Composition of Reporting Units.Concurrent with the acquisition of CSRA in April 2018, we reorganized our Information Systems and Technology operating
53
segment in accordance with the nature of the segment’s products and services into the Information Technology and Mission Systems segments.
This reorganization similarly changed the composition of our reporting units.Accordingly, goodwill of the Information Systems and Technology reporting unit was reassigned to the Information Technology and Mission Systems reporting units using a relative fair value allocation approach as of the date of the reorganization.
Long-lived Assets and Goodwill.We review long-lived assets, including intangible assets subject to amortization, for impairment whenever events or changes in circumstances indicate that the carrying value of the asset may not be recoverable. We assess the recoverability of the carrying value of assets held for use based on a review of undiscounted projected cash flows. Impairment losses, where identified, are measured as the excess of the carrying value of the long-lived asset over its estimated fair value as determined by discounted projected cash flows.
Goodwill represents the purchase price paid in excess of the fair value of net tangible and intangible assets acquired in a business combination.We review goodwill for impairment annually or when circumstances indicate that the likelihood of an impairment is greater than 50%.Such circumstances include a significant adverse change in the business climate for one of our reporting units or a decision to dispose of a reporting unit or a significant portion of a reporting unit.The test for goodwill impairment is a two-step process to first identify potential goodwill impairment for each reporting unit by comparing the fair value of each of our reporting units to its respective carrying value and then, if necessary, measure the amount of the impairment loss.The process requires a significant level of estimation and use of judgment by management, particularly the estimate of the fair value of our reporting units.Our reporting units are consistent with our operating segments in Note Rto the Consolidated Financial Statements in Item 8.
We estimate the fair value of our reporting units based primarily on the discounted projected cash flows of the underlying operations.This requires numerous assumptions, including the timing of work embedded in our backlog, our performance and profitability under our contracts, our success in securing future business, the appropriate risk-adjusted interest rate used to discount the projected cash flows, and terminal value growth rates applied to the final year of projected cash flows. Due to the variables inherent in our estimates of fair value, differences in assumptions may have a material effect on the result of our impairment analysis. To assess the reasonableness of our discounted projected cash flows, we compare the sum of our reporting units’ fair value to our market capitalization and calculate an implied control premium (the excess of the market capitalization over the sum of the reporting units’ fair values). Additionally, we evaluate the reasonableness of each reporting unit’s fair value by comparing the fair value to comparable peer companies and recent comparable market transactions.
We completed the required annual goodwill impairment test as ofDecember 31, 2018. The first step of the goodwill impairment test compares the fair value of each of our reporting units to its carrying value.The results of the first-step test indicated that, for each of our reporting units, no impairment existed.The estimated fair value of each of our reporting units was substantially in excess of its respective carrying value as ofDecember 31, 2018, with the exception of our Information Technology reporting unitfor which the excess wasslightly more than 5%.This is due to the significant size of the CSRA acquisition relative to the newly formed Information Technology reporting unit and its recent acquisition date.Given that the net book value of this business was recorded at its fair value during the current reporting period, the reporting unit’s carrying value, by default, closely approximates its fair value at year end.As the carrying value and fair value of the Information Technology reporting unit are closely aligned, a material change in the fair value or carrying value would put the reporting unit at risk of goodwill impairment.For example, our ability to realize synergies from the acquisition of CSRA and the level of funding in the U.S. government budget
54
for contracts in our portfolio are key assumptions in our projections of revenue, earnings and cash flows. If our actual experience in future years falls significantly below our current projections, the fair value of the reporting unit could be negatively impacted.Similarly, an increase in interest rates would lower our discounted cash flows and negatively impact the fair value of the reporting unit.We believe our projections and assumptions are reasonable,but it is possible they could change, impacting our fair value estimate, or the carrying value could change.
Commitments and Contingencies.We are subject to litigation and other legal proceedings arising either fromthe normal course of businessor under provisions relating tothe protection of the environment. Estimating liabilities and costs associated with these matters requires the use of judgment. We record a charge against earnings when a liability associated with claims or pending or threatened litigation is probable and when our exposure is reasonably estimable. The ultimate resolution of our exposure related to these matters may change as further facts and circumstances become known.
Other Contract Costs.Other contract costs represent amounts that are not currently allocable to government contracts, such as a portion of our estimated workers’ compensation obligations, other insurance-related assessments, pension and other post-retirement benefits, and environmental expenses. These costs will become allocable to contracts generally after they are paid.We have elected to defer these costsin other current assets on the Consolidated Balance Sheetuntil they can be allocated to contracts.We expect to recover these costs through ongoing business, including existing backlog and probable follow-on contracts.We regularly assess the probability of recovery of these costs. This assessment requires that we make assumptions about future contract costs, the extent of cost recovery under our contracts and the amount of future contract activity. These estimates are based on our best judgment.If the backlog in the future does not support the continued deferral of these costs, the profitability of our remaining contracts could be adversely affected.
Retirement Plans.Our defined-benefit pension and other post-retirement benefit costs and obligations depend on several assumptions and estimates. The key assumptions include interest rates used to discount estimated future liabilities and projected long-term rates of return on plan assets.We base the discount rates on a current yield curve developed from a portfolio of high-quality, fixed-income investments with maturities consistent with the projected benefit payout period. We use the spot rate approach to identify individual spot rates along the yield curve that correspond with the timing of each projected service cost and discounted benefit obligation payment.
We determine the long-term rates of return on assets based on consideration of historical and forward-looking returns and the current and expected asset allocation strategy. In 2017, we decreased the expected long-term rate of return on assets in our primary U.S. government and commercial pension plans by 75 basis points following an assessment of the historical and expected long-term returns of our various asset classes. Beginning in 2019, we will decrease the expected long-term rates of return on assets in our primary U.S. other post-retirement benefit plans by 100 basis points, following an assessment of the historical and expected long-term returns of our various asset classes. This decrease is not expected to have a material impact on our 2019 benefit costs.
These retirement plan assumptionsare based on our best judgment, including consideration of current and future market conditions.In the event any of the assumptions change, pension and other post-retirement benefit cost could increase or decrease. For further discussion, including the impact of hypothetical changes in the discount rate and expected long-term rate of return on plan assets, see Note Q to the Consolidated Financial Statements in Item 8.
55
As discussed under Other Contract Costs, our contractual arrangements with the U.S. government provide for the recovery of benefit costs for our government retirement plans. We have elected to defer recognition of the benefit costs until such costs can be allocated to contracts.Therefore, the impact of annual changes in financial reporting assumptions on theretirement benefitcost for these plans does not immediately affect our operating results.
Accounting Standards Updates.See Note A to the Consolidated Financial Statements in Item 8 for information regarding accounting standards we adopted in2018and other new accounting standards that have been issued by the Financial Accounting Standards Board (FASB) but are not effective until afterDecember 31, 2018.
ITEM 7A.QUANTITATIVE AND QUALITATIVE DISCLOSURES ABOUT MARKET RISK
We are exposed to market risk, primarily from foreign currency exchange rates, interest rates, commodity prices and investments.See Note N to the Consolidated Financial Statements in Item 8 for a discussion of these risks. The following quantifies the market risk exposure arising from hypothetical changes in foreign currency exchange rates and interest rates.
We had notional forward exchange and interest rate swap contracts outstanding of$5.8 billionand$4.3 billiononDecember 31, 2018and2017, respectively. A10%unfavorable rate movement in our portfolio of forward exchange and interest rate swap contracts would have resulted in the following hypothetical, incremental pretax gains (losses):
(Dollars in millions)20182017
Recognized$61$(29)
Unrecognized(135)33
Foreign Currency Risk.Our exchange-rate sensitivity relates primarily to changes in the Canadian dollar, euro, Swiss franc and British pound exchange rates. These losses and gains would be offset by corresponding gains and losses in the remeasurement of the underlying transactions being hedged. We believe these foreign currency forward exchange contracts and the offsetting underlying commitments, when taken together, do not create material market risk.
Interest Rate Risk.Our financial instruments subject to interest rate risk include variable-rate commercial paper and fixed- and floating-rate long-term debt obligations.OnDecember 31, 2018, we had$10.5 billionpar value of fixed-rate debt,$1 billionof floating-rate notes and$850of commercial paper outstanding. Our fixed-rate debt obligations are not putable, and we do not trade these securities in the market. A10%unfavorable interest rate movement would not have a material impact on the fair value of our fixed-rate debt. As described in Note K to the Consolidated Financial Statements in Item 8,we entered into derivative financial instruments, specifically interest rate swap contracts, to eliminate our floating-rate interest rate risk.
Investment Risk.Our investment policy allows for purchases of fixed-income securities with an investment-grade rating and a maximum maturity of up tofive years. OnDecember 31, 2018,we held$963in cash and equivalents, but heldnomarketable securities other than those held in trust to meet some of our obligations under workers’ compensation and non-qualified supplemental executive retirement plans. OnDecember 31, 2018,these marketable securities totaled$202and were reflected at fair value on the Consolidated Balance Sheet in other current and noncurrent assets.
56
ITEM 8.FINANCIAL STATEMENTS AND SUPPLEMENTARY DATA
CONSOLIDATED STATEMENT OF EARNINGS
Year Ended December 31
(Dollars in millions, except per-share amounts)201820172016
Revenue:
Products$20,149$19,016$19,010
Services16,04411,95711,551
36,19330,97330,561
Operating costs and expenses:
Products(15,894)(14,773)(15,155)
Services(13,584)(9,958)(9,741)
General and administrative (G&A)(2,258)(2,006)(1,921)
(31,736)(26,737)(26,817)
Operating earnings4,4574,2363,744
Interest, net(356)(103)(91)
Other, net(16)(56)3
Earnings from continuing operations before income tax4,0854,0773,656
Provision for income tax, net(727)(1,165)(977)
Earnings from continuing operations3,3582,9122,679
Discontinued operations, net of tax provision of $13 in 2018 and
tax benefit of $51 in 2016(13)—(107)
Net earnings$3,345$2,912$2,572
Earnings per share
Basic:
Continuing operations$11.37$9.73$8.79
Discontinued operations(0.04)—(0.35)
Net earnings$11.33$9.73$8.44
Diluted:
Continuing operations$11.22$9.56$8.64
Discontinued operations(0.04)—(0.35)
Net earnings$11.18$9.56$8.29
The accompanying Notes to Consolidated Financial Statements are an integral part of these financial statements.
57
CONSOLIDATED STATEMENT OF COMPREHENSIVE INCOME
Year Ended December 31
(Dollars in millions)201820172016
Net earnings$3,345$2,912$2,572
Gains on cash flow hedges36341191
Unrealized gains (losses) on marketable securities—9(9)
Foreign currency translation adjustments(300)348(112)
Change in retirement plans’ funded status(61)20(192)
Other comprehensive (loss) income, pretax(325)718(122)
Benefit (provision) for income tax, net5(151)18
Other comprehensive (loss) income, net of tax(320)567(104)
Comprehensive income$3,025$3,479$2,468
The accompanying Notes to Consolidated Financial Statements are an integral part of these financial statements.
58
CONSOLIDATED BALANCE SHEET
December 31
(Dollars in millions)20182017
ASSETS
Current assets:
Cash and equivalents$963$2,983
Accounts receivable3,7593,617
Unbilled receivables6,5765,240
Inventories5,9775,303
Other current assets9141,185
Total current assets18,18918,328
Noncurrent assets:
Property, plant and equipment, net4,3483,517
Intangible assets, net2,585702
Goodwill19,59411,914
Other assets692585
Total noncurrent assets27,21916,718
Total assets$45,408$35,046
LIABILITIES AND SHAREHOLDERS’ EQUITY
Current liabilities:
Short-term debt and current portion of long-term debt$973$2
Accounts payable3,1793,207
Customer advances and deposits7,2706,992
Other current liabilities3,3172,898
Total current liabilities14,73913,099
Noncurrent liabilities:
Long-term debt11,4443,980
Other liabilities7,4936,532
Commitments and contingencies (see Note O)
Total noncurrent liabilities18,93710,512
Shareholders’ equity:
Common stock482482
Surplus2,9462,872
Retained earnings29,32626,444
Treasury stock(17,244)(15,543)
Accumulated other comprehensive loss(3,778)(2,820)
Total shareholders’ equity11,73211,435
Total liabilities and shareholders’ equity$45,408$35,046The accompanying Notes to Consolidated Financial Statements are an integral part of these financial statements.
59
CONSOLIDATED STATEMENT OF CASH FLOWS
Year Ended December 31
(Dollars in millions)201820172016
Cash flows from operating activities - continuing operations:
Net earnings$3,345$2,912$2,572
Adjustments to reconcile net earnings to net cash provided by operating activities:
Depreciation of property, plant and equipment493362365
Amortization of intangible assets2707988
Equity-based compensation expense14012395
Deferred income tax (benefit) provision(3)401184
Discontinued operations, net of tax13—107
(Increase) decrease in assets, net of effects of business acquisitions:
Accounts receivable417(195)(122)
Unbilled receivables(800)(987)(1,048)
Inventories(591)(182)(377)
Other current assets310207315
Increase (decrease) in liabilities, net of effects of business acquisitions:
Accounts payable(197)657567
Customer advances and deposits36264(305)
Other, net(285)235(278)
Net cash provided by operating activities3,1483,8762,163
Cash flows from investing activities:
Business acquisitions, net of cash acquired(10,099)(399)(58)
Capital expenditures(690)(428)(392)
Proceeds from sales of assets562509
Other, net(7)(11)50
Net cash used by investing activities(10,234)(788)(391)
Cash flows from financing activities:
Proceeds from fixed-rate notes6,461985992
Purchases of common stock(1,769)(1,558)(1,996)
Dividends paid(1,075)(986)(911)
Proceeds from floating-rate notes1,000——
Proceeds from commercial paper, net851——
Repayment of CSRA accounts receivable purchase agreement(450)——
Proceeds from stock option exercises136163292
Repayment of fixed-rate notes—(900)(500)
Other, net(68)(103)(46)
Net cash provided (used) by financing activities5,086(2,399)(2,169)
Net cash used by discontinued operations(20)(40)(54)
Net (decrease) increase in cash and equivalents(2,020)649(451)
Cash and equivalents at beginning of year2,9832,3342,785
Cash and equivalents at end of year$963$2,983$2,334
The accompanying Notes to Consolidated Financial Statements are an integral part of these financial statements.
60
CONSOLIDATED STATEMENT OF SHAREHOLDERS’ EQUITY
Common StockRetainedTreasuryAccumulated
Other
ComprehensiveTotal
Shareholders’
(Dollars in millions)ParSurplusEarningsStockLossEquity
December 31, 2015$482$2,730$22,903$(12,392)$(3,283)$10,440
Net earnings——2,572——2,572
Cash dividends declared——(932)——(932)
Equity-based awards—89—267—356
Shares purchased———(2,031)—(2,031)
Other comprehensive loss————(104)(104)
December 31, 20164822,81924,543(14,156)(3,387)10,301
Cumulative-effect adjustment*——(3)——(3)
Net earnings——2,912——2,912
Cash dividends declared——(1,008)——(1,008)
Equity-based awards—53—146—199
Shares purchased———(1,533)—(1,533)
Other comprehensive income————567567
December 31, 20174822,87226,444(15,543)(2,820)11,435
Cumulative-effects adjustments
(See Note A)——638—(638)—
Net earnings——3,345——3,345
Cash dividends declared——(1,101)——(1,101)
Equity-based awards—74—105—179
Shares purchased———(1,806)—(1,806)
Other comprehensive loss————(320)(320)
December 31, 2018$482$2,946$29,326$(17,244)$(3,778)$11,732
The accompanying Notes to Consolidated Financial Statements are an integral part of these financial statements.
* Reflects the cumulative effect of Accounting Standards Update (ASU) 2016-16, Income Taxes (Topic 740): Intra-Entity Transfers of Assets Other Than Inventory, which we adopted on January 1, 2017.
61
NOTES TO CONSOLIDATED FINANCIAL STATEMENTS
(Dollars in millions, except per-share amounts or unless otherwise noted)
A. SUMMARY OF SIGNIFICANT ACCOUNTING POLICIES
Organization.General Dynamics is a global aerospace and defense company that offers a broad portfolio of products and services in business aviation; combat vehicles, weapons systems and munitions; information technology (IT) services; C4ISR (command, control, communications, computers, intelligence, surveillance and reconnaissance) solutions; and shipbuilding and ship repair.
OnApril 3, 2018, we completed our acquisition of CSRA Inc. (CSRA). See Note B for further discussion of the acquisition. Concurrent with the acquisition, for segment reporting purposes, we reorganized our Information Systems and Technology operating segment into two separate segments: Information Technology and Mission Systems. Our company now hasfiveoperating segments: Aerospace, Combat Systems, Information Technology, Mission Systems and Marine Systems. The latterfoursegments we collectively refer to as our defense segments. Prior-period segment information has been restated for this change.
Basis of Consolidation and Classification.The Consolidated Financial Statements include the accounts of General Dynamics Corporation and our wholly owned and majority-owned subsidiaries. We eliminate all inter-company balances and transactions in the Consolidated Financial Statements. Some prior-year amounts have been reclassified among financial statement accounts or disclosures to conform to the current-year presentation.
Consistent with industry practice, we classify assets and liabilities related to long-term contracts as current, even though some of these amounts may not be realized within one year.
Further discussion of our significant accounting policies is contained in the other notes to these financial statements.
Use of Estimates.The nature of our business requires that we make estimates and assumptions in accordance with U.S. generally accepted accounting principles (GAAP). These estimates and assumptionsaffect the reported amounts of assets and liabilities and the disclosure of contingent assets and liabilities at the date of the financial statements, as well as the reported amounts of revenue and expenses during the reporting period. We base our estimateson historical experience, currently available information and various other assumptions that we believe are reasonable under the circumstances.Actual results could differ from these estimates.
Discontinued Operations, Net of Tax.Concurrent with the acquisition of CSRA, we were required by a government customer to dispose of certain CSRA operations to address an organizational conflict of interest with respect to services provided to the customer. In 2018, we sold these operations. In accordance with GAAP, the sale did not result in a gain for financial reporting purposes. However, the sale generated a taxable gain, resulting in tax expense of$13.
In 2013, we settled litigation with the U.S. Navy related to the terminated A-12 aircraft contract in the company’s former tactical military aircraft business. In connection with the settlement, we released some rights to reimbursement of costs on ships under contract at our Bath, Maine, shipyard. As we progressed through the shipbuilding process, we determined that the cost associated with this settlement was greater than anticipated. Therefore, in 2016, we recognized an$84loss, net of tax, to adjust the previously recognized
62
settlement value. In addition, we recognized$23of losses, net of tax, in 2016 related to other former operations of the company.
Research and Development Expenses.Company-sponsored research and development (R&D) expenses, including product development costs, were$502in2018,$521in2017and$418in2016. The R&D expenses in 2018 and 2017 reflected ongoing product-development efforts in the Aerospace segment as we progressed with the certification of our two newest Gulfstream aircraft models, the G500 and G600. R&D expenses are included in operating costs and expenses in the Consolidated Statement of Earnings in the period in which they are incurred. Customer-sponsored R&D expenses are charged directly to the related contracts.
The Aerospace segment has cost-sharing arrangements with some of its suppliers that enhance the segment’s internal development capabilities and offset a portion of the financial cost associated with the segment’s product development efforts. These arrangements explicitly state that supplier contributions are for reimbursements of costs we incur in the development of new aircraft models and technologies, and we retain substantial rights in the products developed under these arrangements. We record amounts received from these cost-sharing arrangements as a reduction of R&D expenses. We have no obligation to refund any amounts received under the agreements regardless of the outcome of the development efforts. Under the typical terms of an agreement, payments received from suppliers for their share of the costs are based on milestones and are recognized as received. Our policy is to defer payments in excess of the costs we have incurred.
Interest, Net.Net interest expense consisted of the following:
Year Ended December 31201820172016
Interest expense$374$117$99
Interest income(18)(14)(8)
Interest expense, net$356$103$91
The increase in 2018 is due primarily to the impact of financing the CSRA acquisition, including the issuance of$7.5 billionof fixed- and floating-rate notes in the second quarter of 2018. See Note K for additional information regarding our debt obligations, including interest rates.
Cash and Equivalents and Investments in Debt and Equity Securities.We consider securities with a maturity of three months or less to be cash equivalents. Our cash balances are invested primarily in time deposits rated A-/A3 or higher. Our investments in other securities are included in other current and noncurrent assets on the Consolidated Balance Sheet (see Note E). We report our equity securities at fair value with subsequent changes in fair value recognized in net earnings. We report our available-for-sale debt securities at fair value with unrealized gains and losses recognized as a component of other comprehensive income in the Consolidated Statement of Comprehensive Income. We hadnotrading or held-to-maturity debt securities onDecember 31, 2018or2017.
Other Contract Costs.Other contract costs represent amounts that are not currently allocable to government contracts, such as a portion of our estimated workers’ compensation obligations, other insurance-related assessments, pension and other post-retirement benefits, and environmental expenses. These costs will become allocable to contracts generally after they are paid.We expect to recover these costs through ongoing business, including existing backlog and probable follow-on contracts.If the backlog in the future does not support the continued deferral of these costs, the profitability of our remaining contracts could be adversely affected.Other contract costs onDecember 31, 2018and2017, were$135and$448, respectively, and are includedin other current assets on the Consolidated Balance Sheet.
63
Long-lived Assets and Goodwill.We review long-lived assets, including intangible assets subject to amortization, for impairment whenever events or changes in circumstances indicate that the carrying value of the asset may not be recoverable. We assess the recoverability of the carrying value of assets held for use based on a review of undiscounted projected cash flows. Impairment losses, where identified, are measured as the excess of the carrying value of the long-lived asset over its estimated fair value as determined by discounted projected cash flows.
Concurrent with the acquisition of CSRA in April 2018, we reorganized our Information Systems and Technology operating segment in accordance with the nature of the segment’s products and services into the Information Technology and Mission Systems segments.This reorganization similarly changed the composition of our reporting units.Accordingly, goodwill of the Information Systems and Technology reporting unit was reassigned to the Information Technology and Mission Systems reporting units using a relative fair value allocation approach as of the date of the reorganization.
We review goodwill for impairment annually or when circumstances indicate that the likelihood of an impairment is greater than 50%.Goodwill represents the purchase price paid in excess of the fair value of net tangible and intangible assets acquired in a business combination.The test for goodwill impairment is a two-step process to first identify potential goodwill impairment for each reporting unit by comparing the fair value of each of our reporting units to its respective carrying value and then, if necessary, measure the amount of the impairment loss.Our reporting units are consistent with our operating segments in Note R.We estimate the fair value of our reporting units based primarily on the discounted projected cash flows of the underlying operations.
We completed the required annual goodwill impairment test as ofDecember 31, 2018.The results of the first-step test indicated that, for each of our reporting units, no impairment existed.The estimated fair value of each of our reporting units was substantially in excess of its respective carrying value as ofDecember 31, 2018, with the exception of our Information Technology reporting unit.
The estimated fair value of the Information Technology reporting unit exceeded its carrying value as ofDecember 31, 2018, byslightly more than 5%.This is due to the significant size of the CSRA acquisition relative to the newly formed Information Technology reporting unit and its recent acquisition date.Given that the net book value of this business was recorded at its fair value during the current reporting period, the reporting unit’s carrying value, by default, closely approximates its fair value at year end.As the carrying value and fair value of the Information Technology reporting unit are closely aligned, a material change in the fair value or carrying value would put the reporting unit at risk of goodwill impairment.For example, our ability to realize synergies from the acquisition of CSRA and the level of funding in the U.S. government budget for contracts in our portfolio are key assumptions in our projections of revenue, earnings and cash flows. If our actual experience in future years falls significantly below our current projections, the fair value of the reporting unit could be negatively impacted.Similarly, an increase in interest rates would lower our discounted cash flows and negatively impact the fair value of the reporting unit.We believe the projections and assumptions we used in estimating fair value are reasonable,but it is possible they could change, impacting our fair value estimate, or the carrying value could change.
For a summary of our goodwill by reporting unit, see Note B.
Accounting Standards Updates.On January 1, 2018, we adopted the following accounting standards issued by the Financial Accounting Standards Board (FASB):•ASU 2016-01, Financial Instruments - Overall (Subtopic 825-10): Recognition and Measurement of Financial Assets and Financial Liabilities. ASU 2016-01 addresses certain aspects of recognition, measurement, presentation and disclosure of financial instruments. Specific to our business, ASU
64
2016-01 requires equity investments to be measured at fair value with changes in fair value recognized in net income. The ASU eliminates the available-for-sale classification for equity investments that recognized changes in fair value as a component of other comprehensive income. We adopted the standard on a modified retrospective basis on January 1, 2018, and recognized the cumulative effect as a$24increase to retained earnings on the date of adoption.•ASU 2016-15, Statement of Cash Flows (Topic 230): Classification of Certain Cash Receipts and Cash Payments. ASU 2016-15 is intended to reduce diversity in practice in how certain cash receipts and cash payments are presented and classified in the Consolidated Statement of Cash Flows by providing guidance on eight specific cash flow issues. We adopted the standard retrospectively on January 1, 2018. The adoption of the ASU did not have a material effect on our cash flows in 2017 and 2016.•ASU 2017-07, Compensation - Retirement Benefits (Topic 715): Improving the Presentation of Net Periodic Pension Cost and Net Periodic Postretirement Benefit Cost. ASU 2017-07 requires the service cost component of net retirement benefit cost to be reported separately from the other components of net retirement benefit cost in the Consolidated Statement of Earnings. We adopted the standard retrospectively on January 1, 2018. Our restated operating earnings increased$59and$10in2017and2016, respectively, due to the reclassification of the non-service cost components of net benefit cost. Other income decreased by the same amount, with no impact to net earnings.•ASU 2018-02, Income Statement - Reporting Comprehensive Income (Topic 220): Reclassification of Certain Tax Effects from Accumulated Other Comprehensive Income. ASU 2018-02 allows the reclassification from accumulated other comprehensive income to retained earnings of stranded tax effects resulting from the implementation of the Tax Cuts and Jobs Act (tax reform) enacted on December 22, 2017. We adopted the standard on January 1, 2018, and recognized a$614increase to retained earnings on the date of adoption.
There are several other accounting standards that have been issued by the FASB but are not effective until after December 31, 2018, including the following:•ASU 2016-02, Leases (Topic 842). ASU 2016-02 requires the recognition of lease rights and obligations as assets and liabilities on the balance sheet. Previously, lessees were not required to recognize on the balance sheet assets and liabilities arising from operating leases. The ASU also requires disclosure of key information about leasing arrangements. ASU 2016-02 is effective on January 1, 2019, using a modified retrospective method of adoption as of January 1, 2017. In July 2018, the FASB issued ASU 2018-11, Leases (Topic 842): Targeted Improvements, which provides an alternative transition method of adoption, permitting the recognition of a cumulative-effect adjustment to retained earnings on the date of adoption in lieu of retrospective adoption. We are adopting the standard effective January 1, 2019, using the alternative transition method provided by ASU 2018-11.
In order to adopt the new standard, we developed a comprehensive project plan and established cross-functional project teams to guide the implementation. The project plan included implementing a third-party software solution to facilitate the consolidation of our leases for reporting purposes, reviewing all forms of leases, performing a completeness assessment of our lease population, analyzing the optional practical expedients available in the new standard, and updating our business processes, systems and controls to meet the requirements of the new standard.
The new standard provides several optional practical expedients for use in transition. We have elected to use what the FASB has deemed the “package of practical expedients,” which allows us not to reassess our previous conclusions about lease identification, lease classification and the accounting treatment for initial direct costs. We have not elected the practical expedients pertaining to the use of hindsight and
65
land easements. The ASU also provides several optional practical expedients for the ongoing accounting for leases. We have elected the short-term lease recognition exemption for all leases that qualify, meaning that for these leases, we will not recognize right-of-use (ROU) assets or lease liabilities on our Consolidated Balance Sheet. Additionally, we have elected to use the practical expedient to not separate lease and non-lease components for leases of real estate, meaning that for these leases, the non-lease components are included in the associated ROU asset and lease liability balances on our Consolidated Balance Sheet.
The most significant effects of the standard on our Consolidated Financial Statements are (1) the recognition of new ROU assets and lease liabilities on our Consolidated Balance Sheet for our operating leases, and (2) significant new disclosures about our leasing activities. We expect to recognize operating lease liabilities ranging from$1.2to$1.6 billion, with corresponding ROU assets of the same amount based on the present value of the remaining lease payments over the lease term. The new standard is not expected to have a material impact on our results of operations or cash flows.•ASU 2017-12, Derivatives and Hedging (Topic 815): Targeted Improvements to Accounting for Hedging Activities. ASU 2017-12 is intended to simplify hedge accounting by better aligning an entity’s financial reporting for hedging relationships with its risk management activities through the expansion of the types of financial and nonfinancial hedging strategies that are eligible for hedge accounting. The ASU also simplifies the application of the hedge accounting guidance, including eliminating the requirement to separately measure and report hedge ineffectiveness. For cash flow hedges existing at the adoption date, the standard requires adoption on a modified retrospective basis with a cumulative-effect adjustment to the Consolidated Balance Sheet as of the beginning of the year of adoption. The amendments to presentation guidance and disclosure requirements are required to be adopted prospectively. We adopted the standard on January 1, 2019. The adoption of the ASU did not have a material effect on our results of operations, financial condition or cash flows.
B. ACQUISITIONS AND DIVESTITURES, GOODWILL, AND INTANGIBLE ASSETS
CSRA Acquisition
OnApril 3, 2018, we acquired100%of the outstanding shares of CSRA for$41.25per share in cash plus the assumption of outstanding net debt. CSRA has been combined with General Dynamics Information Technology (GDIT) to create a premier provider of IT solutions to the defense, intelligence and federal civilian markets. Except where otherwise noted in the Notes to the Consolidated Financial Statements, changes in balances and activity were generally driven by the CSRA acquisition.
Purchase Price and Fair Value of Net Assets Acquired.The cash purchase price totaled$9.7 billionand consisted of the following:
CSRA shares outstanding (in millions)165.4
Cash consideration per CSRA share$41.25
Cash paid to purchase outstanding CSRA shares$6,825
Cash paid to extinguish CSRA debt2,846
Cash settlement of outstanding CSRA stock options and restricted stock units78
Total purchase price$9,749
66
The following table summarizes the preliminary allocation of the purchase price to the estimated fair values of the assets acquired and liabilities assumed on the acquisition date, with the excess recorded as goodwill:
Cash and equivalents$45
Accounts receivable154
Unbilled receivables510
Other current assets301
Property, plant and equipment, net673
Intangible assets, net2,066
Goodwill7,859
Other noncurrent assets20
Total assets$11,628
Accounts payable$(139)
Customer advances and deposits(151)
Current capital lease obligation(51)
Other current liabilities(404)
Noncurrent capital lease obligation(207)
Noncurrent deferred tax liability(376)
Other noncurrent liabilities(551)
Total liabilities$(1,879)
Net assets acquired$9,749
We have continued to obtain information to refine the estimated fair values. The additional information obtained during the quarter did not result in any material adjustments. However,these provisional amounts are subject to change as we continue to evaluate information required to complete the valuations throughout the measurement period, which will extend into the second quarter of 2019.
We have valued$2.1 billionof acquired intangible assets, which consist of acquired backlog and probable follow-on work and associated customer relationships (contract and program intangible assets), with a weighted-average life of17years. The intangible assets will be amortized using an accelerated method, which approximates the pattern of how the economic benefit is expected to be used. Under this method, approximately50%of the aggregate value of the intangible assets will be amortized withinsixyears.
Goodwill represents the purchase price paid in excess of the fair value of net tangible and intangible assets acquired, and is attributable primarily to expected synergies, economies of scale and the assembled workforce of CSRA. Approximately$490of this goodwill is pre-acquisition goodwill deductible for income tax purposes over its remaining tax life.
CSRA’s operating results have been included with our reported results since the acquisition date. As we immediately began integrating CSRA with GDIT following the acquisition, it is becoming increasingly difficult to separate the results of legacy CSRA from those of the combined entity. Approximately$3.7 billionof revenue,$400of operating earnings and$430of pretax earnings from legacy CSRA were included in our Consolidated Statement of Earnings in2018. These amounts exclude amortization of intangible assets and acquisition financing.
In addition, we have recognized approximately$75of one-time, acquisition-related costs, reported in operating costs and expenses and other income (expense) in the Consolidated Statement of Earnings.
67
Pro Forma Information (Unaudited).The following pro forma information presents our consolidated revenue and earnings from continuing operations as if the acquisition of CSRA and the related financing transactions had occurred onJanuary 1, 2017:
Year Ended December 3120182017
Revenue$37,534$35,828
Earnings from continuing operations3,3902,982
Diluted earnings per share from continuing operations$11.33$9.79
The pro forma information was prepared by combining our reported historical results with the historical results of CSRA for the pre-acquisition periods. In addition, the reported historical amounts were adjusted for the following items, net of associated tax effects:•The impact of acquisition financing.•The removal of certain CSRA operations we were required by a government customer to dispose of to address an organizational conflict of interest with respect to services provided to the customer.We completed the sale of these operations in2018.•The removal of CSRA’s historical pre-acquisition intangible asset amortization expense and debt-related interest expense.•The impact of intangible asset amortization expense assuming our current estimate of fair value was applied onJanuary 1, 2017.•The payment of acquisition-related costs assuming they were incurred onJanuary 1, 2017.
The pro forma information is based on the preliminary amounts allocated to the estimated fair value of net assets acquired and may be revised as the provisional amounts change. The pro forma information does not reflect the realization of expected cost savings or synergies from the acquisition, and does not reflect what our combined results of operations would have been had the acquisition occurred onJanuary 1, 2017.
Other Acquisitions and Divestitures
In addition to the acquisition of CSRA, we acquiredfivebusinesses in2018for an aggregate of approximately$400:•Hawker Pacific, a leading provider of integrated aviation solutions across Asia Pacific and the Middle East, andtwofixed-base operation (FBO) businesses in our Aerospace segment;•a maintenance and service provider for the German Army and other international customers in our Combat Systems segment; and•a provider of specialized transmitters and receivers in our Mission Systems segment.
In2017, we acquiredfourbusinesses for an aggregate of approximately$400:•an FBO in our Aerospace segment;•a provider of mission-critical support services in our Information Technology segment; and•a manufacturer of electronics and communications products and a manufacturer of signal distribution products in our Mission Systems segment.
In2016, we acquiredtwobusinesses for an aggregate of approximately$60:•an aircraft management and charter services provider in our Aerospace segment; and•a manufacturer of unmanned underwater vehicles in our Mission Systems segment.
68
The operating results of these acquisitions have been included with our reported results since the respective closing dates. The purchase prices of the acquisitions have been allocated to the estimated fair value of net tangible and intangible assets acquired, with any excess purchase price recorded as goodwill.
In2018, we completed the sale ofthreebusinesses in our Information Technology segment:•a commercial health products business;•certain CSRA operations we were required by a government customer to dispose of to address an organizational conflict of interest with respect to services provided to the customer; and•a public-facing contact-center business.
Goodwill
The changes in the carrying amount of goodwill by reporting unit were as follows:
AerospaceCombat SystemsInformation Systems and TechnologyInformation TechnologyMission SystemsMarine SystemsTotal Goodwill
December 31, 2016 (a)$2,537$2,598$6,013$—$—$297$11,445
Acquisitions/
divestitures (b)28—268———296
Other (c)737921———173
December 31, 2017 (a)2,6382,6776,302——29711,914
Acquisitions/
divestitures (b)——16———16
Other (c)40(14)(1)———25
April 1, 2018 (a)2,6782,6636,317——29711,955
Change in reporting
unit composition (d)——(6,317)2,0764,241——
Acquisitions/
divestitures (b)18330—7,6017—7,821
Other (c)(48)(60)—(55)(19)—(182)
December 31, 2018 (e)$2,813$2,633$—$9,622$4,229$297$19,594
(a)Goodwill in the Information Systems and Technology reporting unit is net of$1.9 billionof accumulated impairment losses.
(b)Includes adjustments during the purchase price allocation period. Activity in the first quarter of 2018 and the nine-month period endedDecember 31, 2018, also includes an allocation of goodwill associated with the sale of the commercial health products business and an allocation of goodwill associated with the sale of a public-facing contact-center business, respectively, as discussed above.
(c)Consists primarily of adjustments for foreign currency translation. Activity in the nine-month period endedDecember 31, 2018, also includes an allocation of goodwill in our Information Technology reporting unit associated with certain operations classified as held for sale on the Consolidated Balance Sheet onDecember 31, 2018.
(d)Concurrent with the acquisition of CSRA, we reorganized our Information Systems and Technology operating segment into the Information Technology and Mission Systems segments. See Note A for further discussion of the segment reorganization. This reorganization similarly changed the composition of our reporting units. Accordingly, goodwill of the Information Systems and Technology reporting unit was reassigned to the Information Technology and Mission Systems reporting units using a relative fair value allocation approach as of the date of the reorganization.
(e)Goodwill in the Information Technology and Mission Systems reporting units is net of$536and$1.3 billionof accumulated impairment losses, respectively.
69
Intangible Assets
Intangible assets consisted of the following:
Gross Carrying Amount (a)Accumulated AmortizationNet Carrying AmountGross Carrying Amount (a)Accumulated AmortizationNet Carrying Amount
December 3120182017
Contract and program intangible assets (b)$3,771$(1,531)$2,240$1,684$(1,320)$364
Trade names and trademarks469(177)292465(160)305
Technology and software165(116)49137(105)32
Other intangible assets159(155)4155(154)1
Total intangible assets$4,564$(1,979)$2,585$2,441$(1,739)$702
(a)Change in gross carrying amounts consists primarily of adjustments for acquired intangible assets and foreign currency translation.
(b)Consists of acquired backlog and probable follow-on work and associated customer relationships.
We did not recognize any impairments of our intangible assets in2018,2017or2016. The amortization lives (in years) of our intangible assets onDecember 31, 2018, were as follows:
Intangible AssetRange of Amortization Life
Contract and program intangible assets7-30
Trade names and trademarks30
Technology and software5-20
Other intangible assets2-7
Amortization expense is included in operating costs and expenses in the Consolidated Statement of Earnings. Amortization expense was$270in2018,$79in2017and$88in2016. We expect to record annual amortization expense over the next five years as follows:
Year Ended December 31Amortization Expense
2019$280
2020265
2021217
2022192
2023175
C. REVENUE
The majority of our revenue is derived from long-term contracts and programs that can span several years.We account for revenue in accordance withAccounting Standards Codification (ASC)Topic 606, Revenue from Contracts with Customers.
Performance Obligations.A performance obligation is a promise in a contract to transfer a distinct good or service to the customer, and is theunit of account in ASC Topic 606.A contract’s transaction price is allocated to each distinct performance obligation within that contract and recognized as revenue when, or as, the performance obligation is satisfied.The majority of our contracts have a single performance obligation as the promise to transfer the individual goods or services is not separately identifiable from other promises in the contracts and is, therefore, not distinct. Some of our contracts have multiple
70
performance obligations, most commonly due to the contract covering multiple phases of the product lifecycle (development, production, maintenance and support). For contracts with multiple performance obligations, we allocate the contract’s transaction price to each performance obligation using our best estimate of the standalone selling price of each distinct good or service in the contract. The primary method used to estimate standalone selling price is the expected cost plus a margin approach, under which we forecast our expected costs of satisfying a performance obligation and then add an appropriate margin for that distinct good or service.
Contract modifications are routine in the performance of our contracts. Contracts are often modified to account for changes in contract specifications or requirements. In most instances, contract modifications are for goods or services that are not distinct and, therefore, are accounted for as part of the existing contract.
Our performance obligations are satisfied over time as work progresses or at a point in time.Revenue from products and services transferred to customers over time accounted for74%of our revenue in2018,71%in2017and72%in2016.Substantially all of our revenue in the defense segments is recognized over time, because control is transferred continuously to our customers.Typically, revenue is recognized over time using costs incurred to date relative to total estimated costs at completion to measure progress toward satisfying our performance obligations. Incurred cost represents work performed, which corresponds with, and thereby best depicts, the transfer of control to the customer. Contract costs include labor, material, overhead and, when appropriate, G&A expenses.
Revenue from goods and services transferred to customers at a point in time accounted for26%of our revenue in2018,29%in2017and28%in2016.The majority of our revenue recognized at a point in time is for the manufacture of business-jet aircraft in our Aerospace segment.Revenue on these contracts is recognizedwhen the customer obtains control of the asset, which is generally upon delivery and acceptance by the customer of the fully outfitted aircraft.
OnDecember 31, 2018, we had$67.9 billionof remaining performance obligations, which we also refer to as total backlog. We expect to recognize approximately45%of our remaining performance obligations as revenue in 2019, an additional35%by 2021 and the balance thereafter. OnDecember 31, 2017, we had$63.2 billionof remaining performance obligations, at which time we expected to recognize approximately40%of these remaining performance obligations as revenue in 2018, an additional40%by year-end 2020 and the balance thereafter.
Contract Estimates.Accounting for long-term contracts and programs involves the use of various techniques to estimate total contract revenue and costs.For long-term contracts, we estimate the profit on a contract as the difference between the total estimated revenue and expected costs to complete a contract and recognize that profit over the life of the contract.
Contract estimates are based on various assumptions to project the outcome of future events that often span several years.These assumptions include labor productivity and availability; the complexity of the work to be performed; the cost and availability of materials; the performance of subcontractors; and the availability and timing of funding from the customer.
The nature of our contracts gives rise to several types of variable consideration, including claims and award and incentive fees. We include in our contract estimates additional revenue for submitted contract modifications or claims against the customer when we believe we have an enforceable right to the modification or claim, the amount can be estimated reliably and its realization is probable. In evaluating these criteria, we consider the contractual/legal basis for the claim, the cause of any additional costs incurred, the reasonableness of those costs and the objective evidence available to support the claim. We include
71
award or incentive fees in the estimated transaction price when there is a basis to reasonably estimate the amount of the fee. These estimates are based on historical award experience, anticipated performance and our best judgment at the time. Because of our certainty in estimating these amounts, they are included in the transaction price of our contracts and the associated remaining performance obligations.
As a significant change in one or more of these estimates could affect the profitability of our contracts, we review and update our contract-related estimates regularly.We recognize adjustments in estimated profit on contracts under the cumulative catch-up method.Under this method, the impact of the adjustment on profit recorded to date on a contract is recognized in the period the adjustment is identified.Revenue and profit in future periods of contract performance are recognized using the adjusted estimate.If at any time the estimate of contract profitability indicates an anticipated loss on the contract, we recognize the total loss in the period it is identified.
The impact of adjustments in contract estimates on our operating earnings can be reflected in either operating costs and expenses or revenue.The aggregate impact of adjustments in contract estimates increased ourrevenue, operating earnings and diluted earnings per share as follows:
Year Ended December 31201820172016
Revenue$377$292$95
Operating earnings34532316
Diluted earnings per share$0.91$0.69$0.03
Whileno adjustment on any one contract was material to our Consolidated Financial Statements in2018,2017or2016, the amount in 2016 was negatively impacted by a loss on the design and development phase of the AJAX program in our Combat Systems segment and cost growth associated with the restart of the Navy’s DDG-51 program in our Marine Systems segment.
Revenue by Category.Our portfolio of products and services consists of approximately11,000active contracts. The following series of tables presents our revenue disaggregated by several categories.
72
Revenue by major products and services was as follows:
Year Ended December 31201820172016
Aircraft manufacturing and completions$6,226$6,320$6,074
Aircraft services2,0961,7431,625
Pre-owned aircraft13366116
Total Aerospace8,4558,1297,815
Military vehicles4,0273,7313,378
Weapons systems, armament and munitions1,7981,6331,517
Engineering and other services416585635
Total Combat Systems6,2415,9495,530
IT services8,2694,4104,428
Total Information Technology8,2694,4104,428
C4ISR solutions4,7264,4814,716
Total Mission Systems4,7264,4814,716
Nuclear-powered submarines5,7125,1755,264
Surface ships1,8721,6071,648
Repair and other services9181,2221,160
Total Marine Systems8,5028,0048,072
Total revenue$36,193$30,973$30,561
Revenue by contract type was as follows:
Year Ended December 31, 2018AerospaceCombat SystemsInformation TechnologyMission SystemsMarine SystemsTotal
Revenue
Fixed-price$7,600$5,406$3,396$2,711$5,493$24,606
Cost-reimbursement—8003,4221,8613,0049,087
Time-and-materials855351,45115452,500
Total revenue$8,455$6,241$8,269$4,726$8,502$36,193
Year Ended December 31, 2017
Fixed-price$7,479$5,090$1,465$2,478$4,808$21,320
Cost-reimbursement—8232,3051,8383,1868,152
Time-and-materials65036640165101,501
Total revenue$8,129$5,949$4,410$4,481$8,004$30,973
Year Ended December 31, 2016
Fixed-price$7,208$4,629$1,514$2,737$4,857$20,945
Cost-reimbursement—8652,2621,8223,2048,153
Time-and-materials60736652157111,463
Total revenue$7,815$5,530$4,428$4,716$8,072$30,561
Our segments operate under fixed-price, cost-reimbursement and time-and-materials contracts.Our production contracts are primarily fixed-price. Under these contracts, we agree to perform a specific scope of work for a fixed amount. Contracts for research, engineering, repair and maintenance, and other services are typically cost-reimbursement or time-and-materials. Under cost-reimbursement contracts, the customer reimburses contract costs incurred and pays a fixed, incentive or award-based fee. These fees are determined by our ability to achieve targets set in the contract, such as cost, quality, schedule and performance. Under
73
time-and-materials contracts, the customer pays a fixed hourly rate for direct labor and generally reimburses us for the cost of materials.
Each of these contract types presents advantages and disadvantages. Typically, we assume more risk with fixed-price contracts. However, these types of contracts offer additional profits when we complete the work for less than originally estimated. Cost-reimbursement contracts generally subject us to lower risk. Accordingly, the associated base fees are usually lower than fees earned on fixed-price contracts. Under time-and-materials contracts, our profit may vary if actual labor-hour rates vary significantly from the negotiated rates. Also, because these contracts can provide little or no fee for managing material costs, the content mix can impact profitability.
Revenue by customer was as follows:
Year Ended December 31, 2018AerospaceCombat SystemsInformation TechnologyMission SystemsMarine SystemsTotal
Revenue
U.S. government:
Department of Defense (DoD)$236$2,903$3,291$3,224$8,098$17,752
Non-DoD—84,71250625,228
Foreign Military Sales (FMS)983172244145626
Total U.S. government3343,2288,0253,7748,24523,606
U.S. commercial4,1752511631382454,972
Non-U.S. government5512,69881662104,002
Non-U.S. commercial3,39564—15223,613
Total revenue$8,455$6,241$8,269$4,726$8,502$36,193
Year Ended December 31, 2017
U.S. government:
DoD$189$2,702$1,802$3,027$7,721$15,441
Non-DoD—82,340556—2,904
FMS423742246192676
Total U.S. government2313,0844,1643,6297,91319,021
U.S. commercial3,885220214108714,498
Non-U.S. government2102,58032607133,442
Non-U.S. commercial3,80365—13774,012
Total revenue$8,129$5,949$4,410$4,481$8,004$30,973
Year Ended December 31, 2016
U.S. government:
DoD$231$2,274$1,781$3,287$7,507$15,080
Non-DoD—72,34352582,883
FMS1303332325202713
Total U.S. government3612,6144,1473,8377,71718,676
U.S. commercial3,5012872591083294,484
Non-U.S. government4962,5208613263,663
Non-U.S. commercial3,45710914158—3,738
Total revenue$7,815$5,530$4,428$4,716$8,072$30,561
74
Contract Balances.The timing of revenue recognition, billings and cash collections results in billed accounts receivable, unbilled receivables (contract assets), and customer advances and deposits (contract liabilities) on the Consolidated Balance Sheet.In our defense segments, amounts are billed as work progresses in accordance with agreed-upon contractual terms, either at periodic intervals (e.g., biweekly or monthly) or upon achievement of contractual milestones. Generally, billing occurs subsequent to revenue recognition, resulting in contract assets. However, we sometimes receive advances or deposits from our customers, particularly on our international contracts, before revenue is recognized, resulting in contract liabilities.These assets and liabilities are reported on the Consolidated Balance Sheet on a contract-by-contract basis at the end of each reporting period.In our Aerospace segment, we generally receive deposits from customers upon contract execution and upon achievement of contractual milestones. These deposits are liquidated when revenue is recognized. Changes in the contract asset and liability balances during the year endedDecember 31, 2018, were not materially impacted by any other factors except for the acquisition of CSRA in our Information Technology segment as further discussed in Note B and the delays in payment on an international wheeled armored vehicle contract in our Combat Systems segment as further discussed in Note H.
Revenue recognized in2018,2017and2016that was included in the contract liability balance at the beginning of each year was$4.3 billion,$4.3 billionand$4.2 billion, respectively. This revenue represented primarily the sale of business-jet aircraft.
D. EARNINGS PER SHARE
We compute basic earnings per share (EPS) using net earnings for the period and the weighted average number of common shares outstanding during the period. Basic weighted average shares outstanding have decreased in2018and2017due to share repurchases. See Note M for further discussion of our share repurchases. Diluted EPS incorporates the additional shares issuable upon the assumed exercise of stock options and the release of restricted stock and restricted stock units (RSUs).
Basic and diluted weighted average shares outstanding were as follows (in thousands):
Year Ended December 31201820172016
Basic weighted average shares outstanding295,262299,172304,707
Dilutive effect of stock options and restricted stock/RSUs*3,8985,4655,680
Diluted weighted average shares outstanding299,160304,637310,387
* Excludes outstanding options to purchase shares of common stock that had exercise prices in excess of the average market price of our common stock during the year and, therefore, the effect of including these options would be antidilutive. These options totaled3,143in2018,1,547in2017and4,201in2016.
E. FAIR VALUE
Fair value is defined as the price that would be received to sell an asset or paid to transfer a liability in the principal or most advantageous market in an orderly transaction between marketplace participants. Various valuation approaches can be used to determine fair value, each requiring different valuation inputs. The following hierarchy classifies the inputs used to determine fair value into three levels:•Level 1 - quoted prices in active markets for identical assets or liabilities;•Level 2 - inputs, other than quoted prices, observable by a marketplace participant either directly or indirectly; and•Level 3 - unobservable inputs significant to the fair value measurement.
We did not have any significant non-financial assets or liabilities measured at fair value onDecember 31, 2018or2017.
Our financial instruments include cash and equivalents, accounts receivable and payable, marketable securities held in trust and other investments, short- and long-term debt, and derivative financial instruments. The carrying values of cash and equivalents and accounts receivable and payable on the Consolidated Balance Sheet approximate their fair value. The following tables present the fair values of our other financial assets and liabilities onDecember 31, 2018and2017, and the basis for determining their fair values:
75
Carrying
ValueFair
ValueQuoted Prices in Active Markets for Identical Assets
(Level 1)Significant Other Observable Inputs
(Level 2)Significant Unobservable Inputs
(Level 3)
Financial Assets (Liabilities)December 31, 2018
Measured at fair value:
Marketable securities held in trust:
Cash and equivalents$29$29$23$6$—
Available-for-sale debt securities121121—121—
Equity securities525252——
Other investments44——4
Cash flow hedges(69)(69)—(69)—
Measured at amortized cost:
Short- and long-term debt principal(12,518)(12,346)—(12,346)—
December 31, 2017
Measured at fair value:
Marketable securities held in trust:
Cash and equivalents$20$20$15$5$—
Available-for-sale debt securities117117—117—
Equity securities545454——
Other investments44——4
Cash flow hedges(105)(105)—(105)—
Measured at amortized cost:
Short- and long-term debt principal(4,032)(3,974)—(3,974)—
Our Level 1 assets include investments in publicly traded equity securities valued using quoted prices from the market exchanges. The fair value of our Level 2 assets and liabilities is determined under a market approach using valuation models that incorporate observable inputs such as interest rates, bond yields and quoted prices for similar assets. Our Level 3 assets include direct private equity investments that are measured using inputs unobservable to a marketplace participant.
F. INCOME TAXES
Income Tax Provision.We calculate our provision for federal, state and international income taxes based on current tax law. U.S. federal tax reform was enacted on December 22, 2017, and has several key provisions impacting the accounting for and reporting of income taxes. The most significant provision reduced the U.S. corporate statutory tax rate from35%to21%beginning on January 1, 2018. We recorded the effect of the change in tax law in the fourth quarter of 2017.
The provision for income taxes and effective tax rate in 2017 included a$119unfavorable impact from the change in tax law. The impact was due primarily to the remeasurement of our U.S. federal deferred tax assets and liabilities at the tax rate expected to apply when the temporary differences are realized/settled (remeasured at a rate of21%versus35%for the majority of our deferred tax assets and liabilities).
76
The following is a summary of our net provision for income taxes for continuing operations:
Year Ended December 31201820172016
Current:
U.S. federal$587$656$698
State483124
International957771
Total current730764793
Deferred:
U.S. federal(37)215140
State877
International266037
Adjustment for enacted change in U.S. tax law—119—
Total deferred(3)401184
Provision for income taxes, net$727$1,165$977
Net income tax payments$532$617$959
The reported tax provision differs from the amounts paid because some income and expense items are recognized in different time periods for financial reporting than for income tax purposes. State and local income taxes allocable to U.S. government contracts are included in operating costs and expenses in the Consolidated Statement of Earnings and, therefore, are not included in the provision above.
The reconciliation from the statutory federal income tax rate to our effective income tax rate follows:
Year Ended December 31201820172016
Statutory federal income tax rate21.0%35.0%35.0%
State tax on commercial operations, net of federal benefits1.10.60.6
Impact of international operations0.6(4.5)(4.0)
Domestic production deduction—(1.5)(1.5)
Foreign derived intangible income(1.2)——
Equity-based compensation(1.1)(2.6)(2.3)
Domestic tax credits(1.1)(0.8)(0.9)
Contract close-outs(0.5)——
Adoption impact of enacted change in U.S. tax law—2.9—
Other, net(1.0)(0.5)(0.2)
Effective income tax rate17.8%28.6%26.7%
77
Net Deferred Tax Liability.The tax effects of temporary differences between reported earnings and taxable income consisted of the following:
December 3120182017
Retirement benefits$1,055$935
Tax loss and credit carryforwards393437
Salaries and wages160137
Workers’ compensation138139
Other351335
Deferred assets2,0971,983
Valuation allowances(336)(402)
Net deferred assets$1,761$1,581
Intangible assets$(1,061)$(688)
Contract accounting methods(530)(500)
Property, plant and equipment(265)(182)
Capital Construction Fund qualified ships(160)(159)
Other(284)(221)
Deferred liabilities$(2,300)$(1,750)
Net deferred tax liability$(539)$(169)
Our deferred tax assets and liabilities are included in other noncurrent assets and liabilities on the Consolidated Balance Sheet. Our net deferred tax liability consisted of the following:
December 3120182017
Deferred tax asset$38$75
Deferred tax liability(577)(244)
Net deferred tax liability$(539)$(169)
We believe it is more likely than not that we will generate sufficient taxable income in future periods to realize our deferred tax assets, subject to the valuation allowances recognized.
Our deferred tax balance associated with our retirement benefits includes a deferred tax asset of$1 billiononDecember 31, 2018and2017, related to the amounts recorded in accumulated other comprehensive loss (AOCL) to recognize the funded status of our retirement plans. See Notes M and Q for additional details.
One of our deferred tax liabilities results from our participation in the Capital Construction Fund (CCF), a program established by the U.S. government and administered by the Maritime Administration that supports the acquisition, construction, reconstruction or operation of U.S. flag merchant marine vessels. The program allows us to defer federal and state income taxes on earnings derived from eligible programs as long as the proceeds are deposited in the fund and withdrawals are used for qualified activities. We had U.S. government accounts receivable pledged (and thereby deposited) to the CCF of$483and$692onDecember 31, 2018and2017, respectively.
OnDecember 31, 2018, we had net operating loss carryforwards of$1 billionthat begin to expire in 2019 and tax credit carryforwards of$135that begin to expire in 2019.
Tax Uncertainties.For all periods open to examination by tax authorities, we periodically assess our liabilities and contingencies based on the latest available information. Where we believe there is more than
78
a50%chance that our tax position will not be sustained, we record our best estimate of the resulting tax liability, including interest, in the Consolidated Financial Statements. We include any interest or penalties incurred in connection with income taxes as part of income tax expense. The total amount of these tax liabilities onDecember 31, 2018, was not material to our results of operations, financial condition or cash flows.
We participate in the Internal Revenue Service (IRS) Compliance Assurance Process (CAP), a real-time audit of our consolidated federal corporate income tax return. The IRS has examined our consolidated federal income tax returns through 2017. We do not expect the resolution of tax matters for open years to have a material impact on our results of operations, financial condition, cash flows or effective tax rate.
Based on all known facts and circumstances and current tax law, we believe the total amount of any unrecognized tax benefits onDecember 31, 2018, was not material to our results of operations, financial condition or cash flows, and if recognized, would not have a material impact on our effective tax rate. In addition, there arenotax positions for which it is reasonably possible that the unrecognized tax benefits will vary significantly over the next 12 months, producing, individually or in the aggregate, a material effect on our results of operations, financial condition or cash flows.
G. ACCOUNTS RECEIVABLE
Accounts receivable represent amounts billed and currently due from customers. Payment is typically received from our customers either at periodic intervals (e.g., biweekly or monthly) or upon achievement of contractual milestones. Accounts receivable consisted of the following:
December 3120182017
Non-U.S. government$2,035$2,228
U.S. government1,189971
Commercial535418
Total accounts receivable$3,759$3,617
Receivables from non-U.S. government customers included amounts related to long-term production programs for the Spanish Ministry of Defence of$1.9 billionand$2.1 billiononDecember 31, 2018and2017, respectively. A different ministry, the Spanish Ministry of Industry, has funded work on these programs in advance of costs incurred by the company. The cash advances are reported on the Consolidated Balance Sheet in current customer advances and deposits and will be repaid to the Ministry of Industry as we collect on the outstanding receivables from the Ministry of Defence. The net amounts for these programs onDecember 31, 2018and2017, were advance payments of$338and$284, respectively. With respect to our other receivables, we expect to collect substantially all of the year-end2018balance during2019.
H. UNBILLED RECEIVABLES
Unbilled receivables represent revenue recognized on long-term contracts (contract costs and estimated profits) less associated advances and progress billings. These amounts will be billed in accordance with the agreed-upon contractual terms. Unbilled receivables consisted of the following:
79
December 3120182017
Unbilled revenue$27,908$21,845
Advances and progress billings(21,332)(16,605)
Net unbilled receivables$6,576$5,240
Excluding the acquisition of CSRA, the increase in net unbilled receivables in2018was primarily on an international wheeled armored vehicle contract in our Combat Systems segment. AtDecember 31, 2018, the net unbilled receivable related to this contract was$1.9 billion. Our contract is with the Canadian government, who is selling the vehicles to an international customer. We have experienced delays in payment under the contract. We continue to meet our obligations under the contract and are entitled to payment for work performed. Therefore, we expect to collect the full amount currently outstanding.
G&A costs in unbilled revenue onDecember 31, 2018and2017, were$381and$282, respectively. Contract costs also may include estimated contract recoveries for matters such as contract changes and claims for unanticipated contract costs. We record revenue associated with these matters only when the amount of recovery can be estimated reliably and realization is probable.
We expect to bill substantially all of our year-end2018net unbilled receivables balance during2019. The amount not expected to be billed in2019results primarily from the agreed-upon contractual billing terms.
I.INVENTORIES
The majority of our inventories are for business-jet aircraft. Our inventories are stated at the lower of cost or net realizable value. Work in process represents largely labor, material and overhead costs associated with aircraft in the manufacturing process and is based primarily on the estimated average unit cost in a production lot. Raw materials are valued primarily on the first-in, first-out method. We record pre-owned aircraft acquired in connection with the sale of new aircraft at the lower of the trade-in value or the estimated net realizable value.
Inventories consisted of the following:
December 3120182017
Work in process$4,357$3,872
Raw materials1,5041,357
Finished goods3351
Pre-owned aircraft8323
Total inventories$5,977$5,303
The increase in total inventories was due primarily to the ramp-up in production of the new G500 and G600 aircraft programs in our Aerospace segment. Customer deposits associated with these aircraft, which are reflected in customer advances and deposits and other noncurrent liabilities on the Consolidated Balance Sheet, have also increased.
We received type certification from the U.S. Federal Aviation Administration (FAA) and delivered the first G500 aircraft in the third quarter of 2018. Additionally, we are anticipating FAA type certification and entry into service in 2019 of the new G600 aircraft.
80
J. PROPERTY, PLANT AND EQUIPMENT, NET
Property, plant and equipment (PP&E) is carried at historical cost, net of accumulated depreciation. PP&E by major asset class consisted of the following:
December 3120182017
Machinery and equipment$5,534$4,736
Buildings and improvements3,0112,837
Land and improvements386357
Construction in process472307
Total PP&E9,4038,237
Accumulated depreciation(5,055)(4,720)
PP&E, net$4,348$3,517
We depreciate most of our assets using the straight-line method and the remainder using accelerated methods. Buildings and improvements are depreciated over periods of up to50 years. Machinery and equipment are depreciated over periods of up to30 years. Our government customers provide certain facilities and equipment for our use that are not included above.
81
K. DEBT
Debt consisted of the following:
December 3120182017
Fixed-rate notes due:Interest rate:
May 20202.875%$2,000$—
May 20213.000%2,000—
July 20213.875%500500
November 20222.250%1,0001,000
May 20233.375%750—
August 20231.875%500500
November 20242.375%500500
May 20253.500%750—
August 20262.125%500500
November 20272.625%500500
May 20283.750%1,000—
November 20423.600%500500
Floating-rate notes due:
May 20203-month LIBOR + 0.29%500—
May 20213-month LIBOR + 0.38%500—
Commercial paper2.568%850—
OtherVarious16832
Total debt principal12,5184,032
Less unamortized debt issuance costs
and discounts10150
Total debt12,4173,982
Less current portion9732
Long-term debt$11,444$3,980
In April 2018, we borrowed$7.5 billionunder a short-term credit facility to finance, in part, the acquisition of CSRA. In May 2018, we issued$7.5 billionof fixed- and floating-rate notes to repay the borrowings under this facility. We entered into interest rate swap contracts that exchange the floating interest rates on the$500notes due inMay 2020andMay 2021for fixed rates. The result of the interest rate swap contracts is effective interest rates on the floating-rate notes that are the same as the rates on the fixed-rate notes due inMay 2020andMay 2021. See Note N for further discussion of our derivative financial instruments. Interest payments associated with our debt were$312in2018,$93in2017and$83in2016.
Our fixed- and floating-rate notes are fully and unconditionally guaranteed by several of our100%-owned subsidiaries. See Note S for condensed consolidating financial statements. We have the option to redeem the fixed-rate notes prior to their maturity in whole or in part for the principal plus any accrued but unpaid interest and applicable make-whole amounts.
82
The aggregate amounts of scheduled principal maturities of our debt are as follows:
Year Ended December 31Debt
Principal
2019$973
20202,501
20213,002
20221,002
20231,252
Thereafter3,788
Total debt principal$12,518
OnDecember 31, 2018, we had$850of commercial paper outstanding with a dollar-weighted average interest rate of2.568%. We have$5 billionin committed bank credit facilities for general corporate purposes and working capital needs and to support our commercial paper issuances. These credit facilities include a$2 billion364-day facility expiring inMarch 2019, a$1 billionmulti-year facility expiring inNovember 2020and a$2 billionmulti-year facility expiring inMarch 2023. We may renew or replace these credit facilities in whole or in part at or prior to their expiration dates. Our credit facilities are guaranteed by several of our100%-owned subsidiaries. We also have an effective shelf registration on file with the Securities and Exchange Commission that allows us to access the debt markets.
Our financing arrangements contain a number of customary covenants and restrictions. We were in compliance with all covenants and restrictions onDecember 31, 2018.
L. OTHER LIABILITIES
A summary of significant other liabilities by balance sheet caption follows:
December 3120182017
Salaries and wages$952$786
Retirement benefits272295
Workers’ compensation244320
Fair value of cash flow hedges141180
Other (a)1,7081,317
Total other current liabilities$3,317$2,898
Retirement benefits$4,422$4,408
Customer deposits on commercial contracts726814
Deferred income taxes577244
Other (b)1,7681,066
Total other liabilities$7,493$6,532
(a)Consists primarily of dividends payable, taxes payable, capital lease obligations, environmental remediation reserves, warranty reserves, deferred revenue and supplier contributions in the Aerospace segment, liabilities of discontinued operations, and insurance-related costs.
(b)Consists primarily of capital lease obligations, warranty reserves, workers’ compensation liabilities and liabilities of discontinued operations.
M. SHAREHOLDERS’ EQUITY
Authorized Stock.Our authorized capital stock consists of500 millionshares of$1per share par value common stock and50 millionshares of$1per share par value preferred stock. The preferred stock is
83
issuable in series, with the rights, preferences and limitations of each series to be determined by our board of directors.
Shares Issued and Outstanding.OnDecember 31, 2018, we had481,880,634shares of common stock issued and288,698,149shares of common stock outstanding, including unvested restricted stock of686,921shares. OnDecember 31, 2017, we had481,880,634shares of common stock issued and296,895,608shares of common stock outstanding.Noshares of our preferred stock were outstanding on either date. The only changes in our shares outstanding during2018and2017resulted from shares repurchased in the open market and share activity under our equity compensation plans. See Note P for additional details.
Share Repurchases.Our board of directors from time to time authorizes management’s repurchase of outstanding shares of our common stock on the open market. On December 5, 2018, the board of directors authorized management to repurchase up to10 millionadditional shares of the company’s outstanding stock. In2018, we repurchased10.1 millionof our outstanding shares for$1.8 billion. OnDecember 31, 2018,7.5 millionshares remained authorized by our board of directors for repurchase, approximately3%of our total shares outstanding. We repurchased7.8 millionshares for$1.5 billionin2017and14.2 millionshares for$2 billionin2016.
Dividends per Share.Our board of directors declared dividends per share of$3.72in2018,$3.36in2017and$3.04in2016. We paid cash dividends of$1.1 billionin2018,$986in2017and$911in2016.
Accumulated Other Comprehensive Loss.The changes, pretax and net of tax, in each component of AOCL consisted of the following:
Losses on Cash Flow HedgesUnrealized Gains on Marketable SecuritiesForeign Currency Translation AdjustmentsChanges in Retirement Plans’ Funded StatusAOCL
December 31, 2015$(487)$20$181$(2,997)$(3,283)
Other comprehensive loss, pretax191(9)(112)(192)(122)
Benefit from income tax, net(49)3—6418
Other comprehensive loss, net of tax142(6)(112)(128)(104)
December 31, 2016(345)1469(3,125)(3,387)
Other comprehensive income, pretax341934820718
Provision for income tax, net(90)(4)(15)(42)(151)
Other comprehensive income, net of tax2515333(22)567
December 31, 2017(94)19402(3,147)(2,820)
Cumulative effect adjustments (see Note A)(4)(19)—(615)(638)
Other comprehensive loss, pretax36—(300)(61)(325)
Benefit from income tax, net(9)——145
Other comprehensive loss, net of tax27—(300)(47)(320)
December 31, 2018$(71)$—$102$(3,809)$(3,778)
Current-period amounts reclassified out of AOCL related primarily to changes in our retirement plans’ funded status and consisted of pretax recognized net actuarial losses of$355in2018,$358in2017and$340in2016. This was offset partially by pretax amortization of prior service credit of$50in2018,$69in2017and$74in2016. These AOCL components are included in our net periodic pension and other post-retirement benefit cost. See Note Q for additional details.
84
N. DERIVATIVE FINANCIAL INSTRUMENTS AND HEDGING ACTIVITIES
We are exposed to market risk, primarily from foreign currency exchange rates, interest rates, commodity prices and investments.We may use derivative financial instruments to hedge some of these risks as described below. We do not use derivative financial instruments for trading or speculative purposes.
Foreign Currency Risk.Our foreign currency exchange rate risk relates to receipts from customers, payments to suppliers and inter-company transactions denominated in foreign currencies. To the extent possible, we include terms in our contracts that are designed to protect us from this risk. Otherwise, we enter into derivative financial instruments, principally foreign currency forward purchase and sale contracts, designed to offset and minimize our risk. The dollar-weightedtwo-year average maturity of these instruments generally matches the duration of the activities that are at risk.
Interest Rate Risk.Our financial instruments subject to interest rate risk include variable-rate commercial paper and fixed- and floating-rate long-term debt obligations.As described in Note K,we entered into derivative financial instruments, specifically interest rate swap contracts, to eliminate our floating-rate interest rate risk. The interest rate risk associated with our financial instruments is not material.
Commodity Price Risk.We are subject to rising labor and commodity price risk, primarily on long-term, fixed-price contracts. To the extent possible, we include terms in our contracts that are designed to protect us from these risks. Some of the protective terms included in our contracts are considered derivative financial instruments but are not accounted for separately, because they are clearly and closely related to the host contract. We have not entered into any material commodity hedging contracts but may do so as circumstances warrant. We do not believe that changes in labor or commodity prices will have a material impact on our results of operations or cash flows.
Investment Risk.Our investment policy allows for purchases of fixed-income securities with an investment-grade rating and a maximum maturity of up tofiveyears. OnDecember 31, 2018,we held$963in cash and equivalents, but heldnomarketable securities other than those held in trust to meet some of our obligations under workers’ compensation and non-qualified supplemental executive retirement plans. OnDecember 31, 2018,these marketable securities totaled$202and were reflected at fair value on the Consolidated Balance Sheet in other current and noncurrent assets. See Note E for additional details.
Hedging Activities.We had notional forward exchange and interest rate swap contracts outstanding of$5.8 billionand$4.3 billiononDecember 31, 2018and2017, respectively. These derivative financial instruments are cash flow hedges, and are reflected at fair value on the Consolidated Balance Sheet in other current assets and liabilities. See Note E for additional details.
Changes in fair value (gains and losses) related to derivative financial instruments that qualify as cash flow hedges are deferred in AOCL until the underlying transaction is reflected in earnings. Gains and losses on derivative financial instruments that do not qualify for hedge accounting are recorded each period in the Consolidated Statement of Earnings in operating costs and expenses or interest expense. The gains and losses on derivative financial instruments that do not qualify for hedge accounting generally offset losses and gains on the assets and liabilities being hedged. Gains and losses resulting from hedge ineffectiveness are recognized in the Consolidated Statement of Earnings for all derivative financial instruments, regardless of designation.
Net gains and losses on derivative financial instruments recognized in earnings, including gains and losses related to hedge ineffectiveness, were not material to our results of operations in any of the past three years. Net gains and losses reclassified to earnings from AOCL were not material to our results of operations
85
in any of the past three years, and we do not expect the amount of these gains and losses that will be reclassified to earnings in 2019 to be material.
We had no material derivative financial instruments designated as fair value or net investment hedges onDecember 31, 2018or2017.
Foreign Currency Financial Statement Translation.We translate foreign currency balance sheets from our international businesses’ functional currency (generally the respective local currency) to U.S. dollars at the end-of-period exchange rates, and statements of earnings at the average exchange rates for each period. The resulting foreign currency translation adjustments are a component of AOCL.
We do not hedge the fluctuation in reported revenue and earnings resulting from the translation of these international operations’ results into U.S. dollars. The impact of translating our non-U.S. operations’ revenue into U.S. dollars was not material to our results of operations in any of the past three years. In addition, the effect of changes in foreign exchange rates on non-U.S. cash balances was not material in any of the past three years.
86
O. COMMITMENTS AND CONTINGENCIES
Litigation
In 2015, Electric Boat Corporation, a subsidiary of General Dynamics Corporation, received a Civil Investigative Demand from the U.S. Department of Justice regarding an investigation of potential False Claims Act violations relating to alleged failures of Electric Boat’s quality system with respect to allegedly non-conforming parts purchased from a supplier. In 2016, Electric Boat was made aware that it is a defendant in a lawsuit related to this matter filed under seal in U.S. district court. Also in 2016, the Suspending and Debarring Official for the U.S. Department of the Navy issued a Show Cause Letter to Electric Boat requesting that Electric Boat respond to the official’s concerns regarding Electric Boat’s oversight and management with respect to its quality assurance systems for subcontractors and suppliers. Electric Boat responded to the Show Cause Letter and has been engaged in discussions with the U.S. government. Given the current status of these matters, we are unable to express a view regarding the ultimate outcome or, if the outcome is adverse, to estimate an amount or range of reasonably possible loss. Depending on the outcome of these matters, there could be a material impact on our results of operations, financial condition and cash flows.
Additionally, various other claims and legal proceedings incidental tothe normal course of businessare pending or threatened against us. These other matters relate to such issues as government investigations and claims,the protection of the environment, asbestos-related claims and employee-related matters. The nature of litigation is such that we cannot predict the outcome of these other matters. However, based on information currently available, we believe any potential liabilities in these other proceedings, individually or in the aggregate, will not have a material impact on our results of operations, financial condition or cash flows.
Environmental
We are subject to and affected by a variety of federal, state, local and foreign environmental laws and regulations. We are directly or indirectly involved in environmental investigations or remediation at some of our current and former facilities and third-party sites that we do not own but where we have been designated a Potentially Responsible Party (PRP) by the U.S. Environmental Protection Agency or a state environmental agency. Based on historical experience, we expect that a significant percentage of the total remediation and compliance costs associated with these facilities will continue to be allowable contract costs and, therefore, recoverable under U.S. government contracts.
As required, we provide financial assurance for certain sites undergoing or subject to investigation or remediation. We accrue environmental costs when it is probable that a liability has been incurred and the amount can be reasonably estimated. Where applicable, we seek insurance recovery for costs related to environmental liabilities. We do not record insurance recoveries before collection is considered probable. Based on all known facts and analyses, we do not believe that our liability at any individual site, or in the aggregate, arising from such environmental conditions will be material to our results of operations, financial condition or cash flows. We also do not believe that the range of reasonably possible additional loss beyond what has been recorded would be material to our results of operations, financial condition or cash flows.
Minimum Lease Payments
Total expense under operating leases was$380in2018,$309in2017and$307in2016. Operating leases are primarily for facilities and equipment. Future minimum lease payments are as follows:
87
Year Ended December 31Future Minimum
Lease Payments
2019$297
2020234
2021196
2022154
2023110
Thereafter698
Total future minimum lease payments$1,689
Other
Government Contracts.As a government contractor, we are subject to U.S. government audits and investigations relating to our operations, including claims for fines, penalties, and compensatory and treble damages. We believe the outcome of such ongoing government audits and investigations will not have a material impact on our results of operations, financial condition or cash flows.
In the performance of our contracts, we routinely request contract modifications that require additional funding from the customer. Most often, these requests are due to customer-directed changes in the scope of work. While we are entitled to recovery of these costs under our contracts, the administrative process with our customer may be protracted. Based on the circumstances, we periodically file requests for equitable adjustment (REAs) that are sometimes converted into claims. In some cases, these requests are disputed by our customer. We believe our outstanding modifications, REAs and other claims will be resolved without material impact to our results of operations, financial condition or cash flows.
Letters of Credit and Guarantees.In the ordinary course of business, we have entered into letters of credit, bank guarantees, surety bonds and other similar arrangements with financial institutions and insurance carriers totaling approximately$1.7 billiononDecember 31, 2018. In addition, from time to time and in the ordinary course of business, we contractually guarantee the payment or performance of our subsidiaries arising under certain contracts.
Aircraft Trade-ins.In connection with orders for new aircraft in contract backlog, our Aerospace segment has outstanding options with some customers to trade in aircraft as partial consideration in their new-aircraft transaction. These trade-in commitments are generally structured to establish the fair market value of the trade-in aircraft at a date generally45or fewer days preceding delivery of the new aircraft to the customer. At that time, the customer is required to either exercise the option or allow its expiration. Additionally, certain trade-in commitments are structured to guarantee a pre-determined trade-in value. In either case, any excess of the pre-established trade-in price above the fair market value at the time the new aircraft is delivered is treated as a reduction of revenue in the new-aircraft sales transaction.
Labor Agreements.OnDecember 31, 2018, approximatelyone-fifthof the employees of our subsidiaries were working under collectively bargained terms and conditions, including94collective agreements that we have negotiated directly with unions and works councils. A number of these agreements expire within any given year. Historically, we have been successful at renegotiating these labor agreements without any material disruption of operating activities. In2019, we expect to negotiate the terms of21agreements covering approximately5,500employees. We do not expect the renegotiations will, either individually or in the aggregate, have a material impact on our results of operations, financial condition or cash flows.
Product Warranties.We provide warranties to our customers associated with certain product sales. We record estimated warranty costs in the period in which the related products are delivered. The warranty
88
liability recorded at each balance sheet date is based generally on the number of months of warranty coverage remaining for the products delivered and the average historical monthly warranty payments. Warranty obligations incurred in connection with long-term production contracts are accounted for within the contract estimates at completion. Our other warranty obligations, primarily for business-jet aircraft, are included in other current and noncurrent liabilities on the Consolidated Balance Sheet.
The changes in the carrying amount of warranty liabilities for each of the past three years were as follows:
Year Ended December 31201820172016
Beginning balance$467$474$434
Warranty expense129146155
Payments(102)(123)(100)
Adjustments(14)(30)(15)
Ending balance$480$467$474
Capital Leases.Capital lease liabilities represent obligations due under capital leases for the use of buildings and improvements, and machinery and equipment. The gross amount of assets recorded under capital leases was$485and$19with accumulated amortization of$61and$3as ofDecember 31, 2018and 2017, respectively. Amortization of capital lease assets is included within depreciation expense. The increase in capital lease liabilities in 2018 was due primarily to the acquisition of CSRA.
The future minimum lease payments are as follows:
Year Ended December 31Future Minimum
Lease Payments
2019$92
202084
202178
202279
202330
Thereafter70
Total future minimum lease payments433
Less amount representing interest95
Less amount representing executory costs19
Present value of net minimum lease payments319
Less current maturities of capital lease liability64
Non-current capital lease liability$255
P. EQUITY COMPENSATION PLANS
Equity Compensation Overview.We have equity compensation plans for employees, as well as for non-employee members of our board of directors. The equity compensation plans seek to provide an effective means of attracting and retaining directors, officers and key employees, and to provide them with incentives to enhance our growth and profitability. Under the equity compensation plans, awards may be granted to officers, employees or non-employee directors in common stock, options to purchase common stock, restricted shares of common stock, participation units or any combination of these.
89
Annually, we grant awards of stock options, restricted stock and RSUs to participants in our equity compensation plans in early March. Additionally, we may make limited ad hoc grants on a quarterly basis for new hires or promotions. We issue common stock under our equity compensation plans from treasury stock. OnDecember 31, 2018, in addition to the shares reserved for issuance upon the exercise of outstanding stock options, approximately28 millionshares have been authorized for awards that may be granted in the future.
Equity-based Compensation Expense.Equity-based compensation expense is included in G&A expenses. The following table details the components of equity-based compensation expense recognized in net earnings in each of the past three years:
Year Ended December 31201820172016
Stock options$45$34$25
Restricted stock/RSUs654636
Total equity-based compensation expense, net of tax$110$80$61
Stock Options.Stock options granted under our equity compensation plans are issued with an exercise price at the fair value of our common stock determined by the average of the high and low stock prices as listed on the New York Stock Exchange on the date of grant. The majority of our outstanding stock options vest overthreeyears, with50%of the options vesting after two years and the remaining50%vesting the following year, and expire10years after the grant date.
We recognize compensation expense related to stock options on a straight-line basis over the vesting period of the awards, net of estimated forfeitures. Estimated forfeitures are based on our historical forfeiture experience. We estimate the fair value of stock options on the date of grant using the Black-Scholes option pricing model with the following assumptions for each of the past three years:
Year Ended December 31201820172016
Expected volatility17.6-18.2%17.3-19.4%19.1-20.0%
Weighted average expected volatility17.6%19.4%20.0%
Expected term (in months)686870
Risk-free interest rate2.6-2.9%2.0-2.2%1.5-1.6%
Expected dividend yield1.8%1.8%2.0%
We determine the above assumptions based on the following:•Expected volatility is based on the historical volatility of our common stock over a period equal to the expected term of the option.•Expected term is based on assumptions used by a set of comparable peer companies.•Risk-free interest rate is the yield on a U.S. Treasury zero-coupon issue with a remaining term equal to the expected term of the option at the grant date.•Expected dividend yield is based on our historical dividend yield.
The resulting weighted average fair value per stock option granted (in dollars) was$37.42in2018,$33.09in2017and$22.11in2016. Stock option expense reduced pretax operating earnings (and on a diluted per-share basis) by$57($0.15) in2018,$53($0.11) in2017and$39($0.08) in2016. Compensation expense for stock options is reported as a Corporate expense for segment reporting purposes (see Note R). OnDecember 31, 2018, we had$73of unrecognized compensation cost related to stock options, which is expected to be recognized over a weighted average period of1.9 years.
90
A summary of stock option activity during2018follows:
In Shares and DollarsShares Under OptionWeighted Average
Exercise Price Per Share
Outstanding on December 31, 201710,620,389$126.08
Granted1,730,430223.06
Exercised(1,388,110)104.48
Forfeited/canceled(197,514)182.08
Outstanding on December 31, 201810,765,195$143.43
Vested and expected to vest on December 31, 201810,595,953$142.32
Exercisable on December 31, 20186,119,560$109.19
Summary information with respect to our stock options’ intrinsic value and remaining contractual term onDecember 31, 2018, follows:
Weighted Average Remaining Contractual Term (in years)Aggregate Intrinsic
Value
Outstanding5.5$320
Vested and expected to vest5.4319
Exercisable3.4294
In the table above, intrinsic value is calculated as the excess, if any, of the market price of our stock on the last trading day of the year over the exercise price of the options. For stock options exercised, intrinsic value is calculated as the difference between the market price on the date of exercise and the exercise price. The total intrinsic value of stock options exercised was$147in2018,$215in2017and$263in2016.
Restricted Stock/RSUs.The fair value of restricted stock and RSUs equals the average of the high and low market prices of our common stock as listed on the New York Stock Exchange on the date of grant. Grants of restricted stock are awards of shares of common stock. Participation units represent obligations that have a value derived from or related to the value of our common stock. These include stock appreciation rights, phantom stock units and RSUs, and are payable in cash or common stock.
Restricted stock and RSUs generally vest over athree-year restriction period after the grant date, during which recipients may not sell, transfer, pledge, assign or otherwise convey their restricted shares to another party. During this period, restricted stock recipients receive cash dividends on their restricted shares and are entitled to vote those shares, while RSU recipients receive dividend-equivalent units instead of cash dividends and are not entitled to vote their RSUs or dividend-equivalent units.
We grant RSUs with a performance measure derived from a non-GAAP-based management metric, return on invested capital (ROIC). Depending on the company’s performance with respect to this metric, the number of RSUs earned may be less than, equal to or greater than the original number of RSUs awarded subject to a payout range.
We generally recognize compensation expense related to restricted stock and RSUs on a straight-line basis over the vesting period of the awards. Compensation expense related to restricted stock and RSUs reduced pretax operating earnings (and on a diluted per-share basis) by$83($0.22) in2018,$70($0.15) in2017and$56($0.12) in2016. Compensation expense for restricted stock and RSUs is reported as an operating expense for segment reporting purposes (see Note R). OnDecember 31, 2018, we had$53of
91
unrecognized compensation cost related to restricted stock and RSUs, which is expected to be recognized over a weighted average period of1.6 years.
A summary of restricted stock and RSU activity during2018follows:
In Shares and DollarsShares/
Share-Equivalent
UnitsWeighted Average
Grant-Date Fair Value Per Share
Nonvested at December 31, 20171,983,173$135.38
Granted482,700204.97
Vested(1,163,702)122.59
Forfeited(39,895)195.99
Nonvested at December 31, 20181,262,276$171.62
The total fair value of vesting shares was$242in2018,$200in2017and$68in2016.
Q. RETIREMENT PLANS
We provide defined-contribution benefits to eligible employees, as well as some remaining defined-benefit pension and other post-retirement benefits. Substantially all of our plans use a December 31 measurement date consistent with our fiscal year. The following discussion reflects the inclusion of legacy CSRA plans assumed in connection with the acquisition as of the acquisition date.
Retirement Plan Summary Information
Defined-contribution Benefits.We provide eligible employees the opportunity to participate in defined-contribution savings plans (commonly known as 401(k) plans), which permit contributions on a before-tax and after-tax basis. Employees may contribute to various investment alternatives. In most of these plans, we match a portion of the employees’ contributions. Our contributions to these plans totaled$302in2018,$274in2017and$261in2016. The defined-contribution plans held approximately21 millionshares of our common stock, representing approximately7%of our outstanding shares onDecember 31, 2018and2017.
Pension Benefits.We havetennoncontributory andfivecontributory trusteed, qualified defined-benefit pension plans covering eligible government business employees, andtwononcontributory andfourcontributory plans covering eligible commercial business employees, including some employees of our international operations. The primary factors affecting the benefits earned by participants in our pension plans are employees’ years of service and compensation levels. Our primary government pension plans, which comprise the majority of our unfunded obligation, were closed to new salaried participants on January 1, 2007. Additionally, we made changes to these plans for certain participants effective in 2014 that limit or cease the benefits that accrue for future service. We made similar changes to our primary commercial pension plan in 2015.
We also sponsoronefunded and several unfunded non-qualified supplemental executive retirement plans, which provide participants with additional benefits, including excess benefits over limits imposed on qualified plans by federal tax law.
Other Post-retirement Benefits.We maintain plans that provide post-retirement healthcare and life insurance coverage for certain employees and retirees. These benefits vary by employment status, age, service and salary level at retirement. The coverage provided and the extent to which the retirees share in the cost of the program vary throughout the company. The plans provide health and life insurance benefits
92
only to those employees who retire directly from our service and not to those who terminate service prior to eligibility for retirement.
Contributions and Benefit Payments
It is our policy to fund our defined-benefit retirement plans in a manner that optimizes the tax deductibility and contract recovery of contributions considered within our capital deployment framework. Therefore, we may make discretionary contributions in addition to the required contributions determined in accordance with IRS regulations. In 2018, in addition to our required contributions of approximately$315, we made a discretionary contribution of$255, resulting in total pension plan contributions of approximately$570in2018. The additional contribution was considered to be a significant event in accordance with ASC Topic 715 and, therefore, triggered a remeasurement of the 2018 net periodic defined-benefit pension cost. In2019, our required contributions are approximately$190.
We maintain several tax-advantaged accounts, primarily Voluntary Employees’ Beneficiary Association (VEBA) trusts, to fund the obligations for some of our other post-retirement benefit plans. For non-funded plans, claims are paid as received. Contributions to our other post-retirement benefit plans were not material in2018and are not expected to be material in2019.
We expect the following benefits to be paid from our retirement plans over the next 10 years:
Pension
BenefitsOther Post-retirement
Benefits
2019$816$68
202084667
202187366
202289965
202392764
2024-20284,947296
Government Contract Considerations
Our contractual arrangements with the U.S. government provide for the recovery of contributions to our pension and other post-retirement benefit plans covering employees working in our defense segments. For non-funded plans, our government contracts allow us to recover claims paid. Following payment, these recoverable amounts are allocated to contracts and billed to the customer in accordance with the Cost Accounting Standards (CAS) and specific contractual terms. For some of these plans, the cumulative pension and other post-retirement benefit cost exceeds the amount currently allocable to contracts. To the extent we consider recovery of the cost to be probable based on our backlog and probable follow-on contracts, we defer the excess in other contract costs in other current assets on the Consolidated Balance Sheet until the cost is allocable to contracts. See Note A for a discussion of our other contract costs. For other plans, the amount allocated to contracts and included in revenue has exceeded the plans’ cumulative benefit cost. We have similarly deferred recognition of these excess earnings on the Consolidated Balance Sheet.
Defined-benefit Retirement Plan Summary Financial Information
Estimating retirement plan assets, liabilities and costs requires the extensive use of actuarial assumptions. These include the long-term rate of return on plan assets, the interest rates used to discount projected benefit payments, healthcare cost trend rates and future salary increases. Given the long-term nature of the assumptions being made, actual outcomes can and often do differ from these estimates.
93
Our annual benefit cost consists of three primary elements: the cost of benefits earned by employees for services rendered during the year, an interest charge on our plan liabilities and an assumed return on our plan assets for the year. The annual cost also includes gains and losses resulting from changes in actuarial assumptions, differences between the actual and assumed long-term rate of return on assets, and gains and losses resulting from changes we make to plan benefit terms.
We recognize an asset or liability on the Consolidated Balance Sheet equal to the funded status of each of our defined-benefit retirement plans. The funded status is the difference between the fair value of the plan’s assets and its benefit obligation. Changes in plan assets and liabilities due to differences between actuarial assumptions and the actual results of the plan are deferred in AOCL rather than charged to earnings. These differences are then amortized over future years as a component of our annual benefit cost. We amortize actuarial differences under qualified plans on a straight-line basis over the average remaining service period of eligible employees. If all of a plan’s participants are inactive or are not accruing additional benefits, we amortize these differences over the average remaining life expectancy of the plan participants. We recognize the difference between the actual and expected return on plan assets for qualified plans overfiveyears. The deferral of these differences reduces the volatility of our annual benefit cost that can result either from year-to-year changes in the assumptions or from actual results that are not necessarily representative of the long-term financial position of these plans. We recognize differences under nonqualified plans immediately.
Net annual defined-benefit pension and other post-retirement benefit cost (credit) consisted of the following:
Pension Benefits
Year Ended December 31201820172016
Service cost$180$168$173
Interest cost532453456
Expected return on plan assets(856)(679)(713)
Recognized net actuarial loss359362343
Amortization of prior service credit(46)(66)(68)
Net annual benefit cost$169$238$191
Other Post-retirement Benefits
Year Ended December 31201820172016
Service cost$10$9$10
Interest cost333034
Expected return on plan assets(40)(34)(33)
Recognized net actuarial gain(4)(4)(3)
Amortization of prior service credit(4)(3)(6)
Net annual benefit (credit) cost$(5)$(2)$2
As discussed in Note A, the service cost component of net annual benefit cost (credit) is reported separately from the other components of net annual benefit cost (credit) in accordance with ASU 2017-07.
94
The following is a reconciliation of the benefit obligations and plan/trust assets, and the resulting funded status, of our defined-benefit retirement plans:
Pension BenefitsOther Post-retirement Benefits
Year Ended December 312018201720182017
Change in Benefit Obligation
Benefit obligation at beginning of year$(14,212)$(13,022)$(996)$(1,005)
Service cost(180)(168)(10)(9)
Interest cost(532)(453)(33)(30)
Acquisitions(2,758)—(62)—
Amendments151——
Actuarial gain (loss)1,183(1,098)78(42)
Settlement/curtailment/other23(58)2127
Benefits paid7415866763
Benefit obligation at end of year$(15,720)$(14,212)$(935)$(996)
Change in Plan/Trust Assets
Fair value of assets at beginning of year$10,130$8,980$541$499
Actual return on plan assets(749)1,469(4)82
Acquisitions2,328—77—
Employer contributions57119913
Settlement/curtailment/other(26)56——
Benefits paid(722)(574)(45)(43)
Fair value of assets at end of year$11,532$10,130$570$541
Funded status at end of year$(4,188)$(4,082)$(365)$(455)
Amounts recognized on the Consolidated Balance Sheet consisted of the following:
Pension BenefitsOther Post-retirement Benefits
December 312018201720182017
Noncurrent assets$67$133$74$33
Current liabilities(131)(145)(141)(150)
Noncurrent liabilities(4,124)(4,070)(298)(338)
Net liability recognized$(4,188)$(4,082)$(365)$(455)
Amounts deferred in AOCL consisted of the following:
Pension BenefitsOther Post-retirement Benefits
December 312018201720182017
Net actuarial loss (gain)$4,959$4,899$(37)$(5)
Prior service (credit) cost(95)(124)1(3)
Total amount recognized in AOCL, pretax$4,864$4,775$(36)$(8)
95
The following is a reconciliation of the change in AOCL for our defined-benefit retirement plans:
Pension BenefitsOther Post-retirement Benefits
Year Ended December 312018201720182017
Net actuarial loss (gain)$422$308$(34)$(6)
Prior service cost(15)(1)——
Amortization of:
Net actuarial (loss) gain from prior
years(359)(362)44
Prior service credit466643
Other*(5)7(2)(39)
Change in AOCL, pretax$89$18$(28)$(38)
* Includes foreign exchange translation, curtailment and other adjustments.
The following table represents amounts deferred in AOCL on the Consolidated Balance Sheet onDecember 31, 2018, that we expect to recognize in our retirement benefit cost in2019:
Pension
BenefitsOther Post-retirement
Benefits
Net actuarial loss (gain)$280$(8)
Prior service credit(18)(4)
A pension plan’s funded status is the difference between the plan’s assets and its projected benefit obligation (PBO). The PBO is the present value of future benefits attributed to employee services rendered to date, including assumptions about future compensation levels. A pension plan’s accumulated benefit obligation (ABO) is the present value of future benefits attributed to employee services rendered to date, excluding assumptions about future compensation levels. The ABO for all defined-benefit pension plans was$15.5 billionand$13.9 billiononDecember 31, 2018and2017, respectively. OnDecember 31, 2018and2017, some of our pension plans had an ABO that exceeded the plans’ assets. Summary information for those plans follows:
December 3120182017
PBO$(15,067)$(13,660)
ABO(14,856)(13,398)
Fair value of plan assets10,8329,526
Retirement Plan Assumptions
We calculate the plan assets and liabilities for a given year and the net annual benefit cost for the subsequent year using assumptions determined as of December 31 of the year in question.
96
The following table summarizes the weighted average assumptions used to determine our benefit obligations:
Assumptions on December 3120182017
Pension Benefits
Benefit obligation discount rate4.28%3.62%
Rate of increase in compensation levels2.79%2.82%
Other Post-retirement Benefits
Benefit obligation discount rate4.24%3.64%
Healthcare cost trend rate:
Trend rate for next year6.50%6.50%
Ultimate trend rate5.00%5.00%
Year rate reaches ultimate trend rate20242024
The following table summarizes the weighted average assumptions used to determine our net annual benefit cost:
Assumptions for Year Ended December 31201820172016
Pension Benefits
Discount rates:
Benefit obligation3.69%4.19%4.46%
Service cost3.51%4.13%4.42%
Interest cost3.34%3.56%3.71%
Expected long-term rate of return on assets7.45%7.43%8.14%
Rate of increase in compensation levels2.79%2.90%3.39%
Other Post-retirement Benefits
Discount rates:
Benefit obligation3.64%4.11%4.35%
Service cost3.79%4.34%4.52%
Interest cost3.27%3.43%3.53%
Expected long-term rate of return on assets7.75%7.76%7.81%
We base the discount rates on a current yield curve developed from a portfolio of high-quality, fixed-income investments with maturities consistent with the projected benefit payout period. We use the spot rate approach to identify individual spot rates along the yield curve that correspond with the timing of each projected service cost and discounted benefit obligation payment.
We determine the long-term rates of return on assets based on consideration of historical and forward-looking returns and the current and expected asset allocation strategy. In 2017, we decreased the expected long-term rate of return on assets in our primary U.S. government and commercial pension plans by 75 basis points following an assessment of the historical and expected long-term returns of our various asset classes. Beginning in 2019, we will decrease the expected long-term rates of return on assets in our primary U.S. other post-retirement benefit plans by 100 basis points, following an assessment of the historical and expected long-term returns of our various asset classes. This decrease is not expected to have a material impact on our 2019 benefit costs.
Retirement plan assumptionsare based on our best judgment, including consideration of current and future market conditions.Changes in these estimates impact future pension and other post-retirement benefit
97
cost. As discussed above, we defer recognition of the cumulative benefit cost for our government plans in excess of costs allocated to contracts and included in revenue.Therefore, the impact of annual changes in financial reporting assumptions on thecost for these plans does not immediately affect our operating results.For our U.S. pension plans that represent the majority of our total obligation, the following hypothetical changes in the discount rates and expected long-term rates of return on plan assets would have had the following impact in2018:
Increase
25 Basis PointsDecrease
25 Basis Points
Increase (decrease) to net pension cost from:
Change in discount rates$(24)$25
Change in long-term rates of return on plan assets(27)27
A 25-basis-point change in these assumed rates would not have had a measurable impact on the benefit cost for our other post-retirement benefit plans in2018. For our healthcare plans, the effect of a 1% increase or decrease in the assumed healthcare cost trend rate on the2018net annual benefit cost is$4and($3), respectively, and the effect on theDecember 31, 2018, accumulated other post-retirement benefit obligation is$65and($52), respectively.
Plan Assets
A committee of our board of directors is responsible for the strategic oversight of our defined-benefit retirement plan assets held in trust. Management develops investment policies and provides oversight of a third-party investment manager who reports to the committee on a regular basis. The outsourced third-party investment manager develops investment strategies and makes all day-to-day investment decisions related to defined-benefit retirement plan assets in accordance with our investment policy and target allocation percentages.
Our investment policy endeavors to strike the appropriate balance among capital preservation, asset growth and current income. The objective of our investment policy is to generate future returns consistent with our assumed long-term rates of return used to determine our benefit obligations and net annual benefit cost. Target allocation percentages vary over time depending on the perceived risk and return potential of various asset classes and market conditions. At the end of2018, our asset allocation policy ranges were:
Equities48-68%
Fixed income20-48%
Cash0-5%
Other asset classes0-16%
Approximately75%of our pension plan assets are held in a single trust for our primary U.S. government and commercial pension plans. OnDecember 31, 2018, the trust was invested largely in publicly traded equities, fixed-income securities and commingled funds comprised of equity securities. The trust also invests in other asset classes consistent with our investment policy. Our investments in equity assets include U.S. and international securities and equity funds. Our investments in fixed-income assets include U.S. Treasury and U.S. agency securities, corporate bonds, mortgage-backed securities and other asset-backed securities. Our investment policy allows the use of derivative instruments when appropriate to reduce anticipated asset volatility, to gain exposure to an asset class or to adjust the duration of fixed-income assets.
Assets for our non-U.S. pension plans are held in trusts in the countries in which the related operations reside. Our non-U.S. operations maintain investment policies for their individual plans based on country-
98
specific regulations. The non-U.S. plan assets are invested primarily in commingled funds comprised of equity and fixed-income securities.
We hold assets in VEBA trusts for some of our other post-retirement benefit plans. These assets are managed by a third-party investment manager with oversight by management and are generally invested in equities, fixed-income securities and commingled funds comprised of equity and fixed-income securities. Our asset allocation strategy for the VEBA trusts considers potential fluctuations in our other post-retirement benefit obligation, the taxable nature of certain VEBA trusts, tax deduction limits on contributions and the regulatory environment.
Our retirement plan assets are reported at fair value. See Note E for a discussion of the hierarchy for determining fair value. Our Level 1 assets include investments in publicly traded equity securities. These securities are actively traded and valued using quoted prices for identical securities from the market exchanges. Our Level 2 assets consist of fixed-income securities and commingled funds whose underlying investments are valued using observable marketplace inputs. The fair value of plan assets invested in fixed-income securities is generally determined under a market approach using valuation models that incorporate observable inputs such as interest rates, bond yields and quoted prices for similar assets. Our plan assets that are invested in commingled funds are valued using a unit price or net asset value (NAV) that is based on the underlying investments of the fund. Our Level 3 assets include real estate funds, insurance deposit contracts and direct private equity investments.
Certain investments valued using NAV as a practical expedient are excluded from the fair value hierarchy. These investments are redeemable at NAV on a monthly or quarterly basis and have redemption notice periods of up to90 days. The unfunded commitments related to these investments were not material onDecember 31, 2018, and we hadnounfunded commitments related to these investments on December 31,2017.
99
The fair value of our pension plan assets by investment category and the corresponding level within the fair value hierarchy were as follows:
Fair
ValueQuoted Prices
in Active
Markets for
Identical Assets
(Level 1)Significant
Other
Observable
Inputs
(Level 2)Significant
Unobservable
Inputs
(Level 3)
Asset CategoryDecember 31, 2018
Cash and equivalents$73$—$73$—
Equity securities (a):
U.S. companies732732——
Non-U.S. companies117117——
Private equity investments20——20
Fixed-income securities:
Corporate bonds (b)1,600—1,600—
Treasury securities1,410—1,410—
Commingled funds:
Equity funds5,243—5,243—
Fixed-income funds624—624—
Real estate funds68——68
Other investments:
Insurance deposit contracts128——128
Total plan assets in fair value hierarchy$10,015$849$8,950$216
Plan assets measured using NAV as a practical expedient (c):
Hedge funds910
Real estate funds420
Fixed-income funds101
Equity funds86
Total pension plan assets$11,532
(a)No single equity holding amounted to more than1%of the total fair value.
(b)Our corporate bond investments had an average rating ofA+.
(c)Investments measured at fair value using NAV as a practical expedient are not classified in the fair value hierarchy. The fair value amounts presented in this table for these investments are included to permit reconciliation of the fair value hierarchy to the total plan assets.
100
Fair
ValueQuoted Prices
in Active
Markets for
Identical Assets
(Level 1)Significant
Other
Observable
Inputs
(Level 2)Significant
Unobservable
Inputs
(Level 3)
Asset CategoryDecember 31, 2017
Cash and equivalents$48$—$48$—
Equity securities (a):
U.S. companies770770——
Non-U.S. companies9797——
Private equity investments18——18
Fixed-income securities:
Corporate bonds (b)1,604—1,604—
Treasury securities1,361—1,361—
Commingled funds:
Equity funds5,018—5,018—
Fixed-income funds325—325—
Real estate funds51——51
Other investments:
Insurance deposit contracts120——120
Total plan assets in fair value hierarchy$9,412$867$8,356$189
Plan assets measured using NAV as a practical expedient (c):
Real estate funds390
Hedge funds328
Total pension plan assets$10,130
(a)No single equity holding amounted to more than1%of the total fair value.
(b)Our corporate bond investments had an average rating ofA+.
(c)Investments measured at fair value using NAV as a practical expedient are not classified in the fair value hierarchy. The fair value amounts presented in this table for these investments are included to permit reconciliation of the fair value hierarchy to the total plan assets.
101
The fair value of our other post-retirement benefit plan assets by category and the corresponding level within the fair value hierarchy were as follows:
Fair
ValueQuoted Prices
in Active
Markets for
Identical Assets
(Level 1)Significant
Other
Observable
Inputs
(Level 2)
Asset Category (a)December 31, 2018
Cash and equivalents$23$—$23
Equity securities8080—
Fixed-income securities87—87
Commingled funds:
Equity funds237—237
Fixed-income funds111—111
Real estate funds22—
Total plan assets in fair value hierarchy$540$82$458
Plan assets measured using NAV as a practical expedient (b):
Hedge funds22
Equity funds3
Fixed-income funds3
Real estate funds2
Total other post-retirement benefit plan assets$570(a) We had no Level 3 investments onDecember 31, 2018.
(b)Investments measured at fair value using NAV as a practical expedient are not classified in the fair value hierarchy. The fair value amounts presented in this table for these investments are included to permit reconciliation of the fair value hierarchy to the total plan assets.
Fair
ValueQuoted Prices
in Active
Markets for
Identical Assets
(Level 1)Significant
Other
Observable
Inputs
(Level 2)
Asset Category (a)December 31, 2017
Cash and equivalents$18$—$18
Equity securities7070—
Fixed-income securities89—89
Commingled funds:
Equity funds260—260
Fixed-income funds99—99
Real estate funds22—
Total plan assets in fair value hierarchy$538$72$466
Plan assets measured using NAV as a practical expedient (b):
Real estate funds2
Hedge funds1
Total other post-retirement benefit plan assets$541
(a) We had no Level 3 investments onDecember 31, 2017.
(b)Investments measured at fair value using NAV as a practical expedient are not classified in the fair value hierarchy. The fair value amounts presented in this table for these investments are included to permit reconciliation of the fair value hierarchy to the total plan assets.
102
Changes in our Level 3 retirement plan assets during2018and2017were as follows:
Private Equity InvestmentsReal Estate FundsInsurance Deposits ContractsTotal Level 3 Assets
December 31, 2016$13$42$109$164
Actual return on plan assets:
Unrealized gains, net1449
Realized gains, net——22
Purchases, sales and settlements, net45514
December 31, 20171851120189
Actual return on plan assets:
Unrealized losses, net—(1)—(1)
Realized gains, net——33
Purchases, sales and settlements, net218525
December 31, 2018$20$68$128$216
R. SEGMENT INFORMATION
We havefiveoperating segments: Aerospace, Combat Systems, Information Technology, Mission Systems, and Marine Systems. We organize our segments in accordance with the nature of products and services offered. We measure each segment’s profitability based on operating earnings. As a result, we do not allocate net interest, other income and expense items, and income taxes to our segments.
Summary financial information for each of our segments follows:
RevenueOperating EarningsRevenue from U.S. Government
Year Ended December 31201820172016201820172016201820172016
Aerospace$8,455$8,129$7,815$1,490$1,577$1,394$334$231$361
Combat Systems6,2415,9495,5309629378313,2283,0842,614
Information
Technology8,2694,4104,4286083733408,0254,1644,147
Mission Systems4,7264,4814,7166596386013,7743,6293,837
Marine Systems8,5028,0048,0727616855958,2457,9137,717
Corporate———(23)26(17)———
Total$36,193$30,973$30,561$4,457$4,236$3,744$23,606$19,021$18,676
Corporate operating results have two primary components: pension and other post-retirement benefit income, and stock option expense. ASU 2017-07 requires the non-service cost components of pension and other post-retirement benefit cost (e.g., interest cost) to be reported in other income (expense) in the Consolidated Statement of Earnings. In our defense segments, as described in Note Q, pension and other post-retirement benefit costs are allocable contract costs. For these segments, we report the offset for the non-service cost components in Corporate operating results. Corporate operating results in 2018 also included one-time charges of approximately$45associated with the costs to complete the CSRA acquisition.
103
The following is additional summary financial information for each of our segments:
Identifiable AssetsCapital ExpendituresDepreciation and Amortization
Year Ended December 31201820172016201820172016201820172016
Aerospace$11,220$10,126$9,792$194$132$125$154$147$153
Combat Systems9,8539,8468,885918471878686
Information
Technology14,1593,0212,7786216103333242
Mission Systems5,9845,8565,667494787656061
Marine Systems3,1302,9063,06324312392116109105
Corporate*1,0623,2912,98751267876
Total$45,408$35,046$33,172$690$428$392$763$441$453
* Corporate identifiable assets are primarily cash and equivalents.
See Note C for additional revenue information by segment.
The following table presents our revenue by geographic area based on the location of our customers:
Year Ended December 31201820172016
North America:
United States$28,578$23,519$23,160
Other755915709
Total North America29,33324,43423,869
Europe2,7722,5582,152
Asia/Pacific2,2522,0111,650
Africa/Middle East1,5651,6552,617
South America271315273
Total revenue$36,193$30,973$30,561
Our revenue from non-U.S. operations was$4.2 billionin2018and$3.7 billionin2017and2016, and earnings from continuing operations before income taxes from non-U.S. operations were$578in2018,$550in2017and$530in2016. The long-lived assets associated with these operations were3%of our total long-lived assets onDecember 31, 2018,and5%for December 31,2017and 2016.
S. CONDENSED CONSOLIDATING FINANCIAL STATEMENTS
The fixed- and floating-rate notes described in Note K are fully and unconditionally guaranteed on an unsecured, joint and several basis by several of our100%-owned subsidiaries (the guarantors). The following condensed consolidating financial statements illustrate the composition of the parent, the guarantors on a combined basis (each guarantor together with its majority-owned subsidiaries) and all other subsidiaries on a combined basis.
104
CONDENSED CONSOLIDATING STATEMENT OF EARNINGS
Year Ended December 31, 2018ParentGuarantors on a
Combined BasisOther Subsidiaries
on a Combined BasisConsolidating
AdjustmentsTotal
Consolidated
Revenue$—$28,132$8,061$—$36,193
Cost of sales67(22,841)(6,704)—(29,478)
G&A(90)(1,638)(530)—(2,258)
Operating earnings(23)3,653827—4,457
Interest, net(326)—(30)—(356)
Other, net(81)1253—(16)
Earnings before income tax(430)3,665850—4,085
Provision for income tax, net116(677)(166)—(727)
Discontinued operations, net of tax(13)———(13)
Equity in net earnings of subsidiaries3,672——(3,672)—
Net earnings$3,345$2,988$684$(3,672)$3,345
Comprehensive income$3,025$2,992$305$(3,297)$3,025
Year Ended December 31, 2017
Revenue$—$26,933$4,040$—$30,973
Cost of sales76(21,695)(3,112)—(24,731)
G&A(48)(1,643)(315)—(2,006)
Operating earnings283,595613—4,236
Interest, net(97)1(7)—(103)
Other, net(72)124—(56)
Earnings before income tax(141)3,608610—4,077
Provision for income tax, net154(1,262)(57)—(1,165)
Equity in net earnings of subsidiaries2,899——(2,899)—
Net earnings$2,912$2,346$553$(2,899)$2,912
Comprehensive income$3,479$2,336$1,158$(3,494)$3,479
Year Ended December 31, 2016
Revenue$—$26,573$3,988$—$30,561
Cost of sales21(21,811)(3,106)—(24,896)
G&A(37)(1,568)(316)—(1,921)
Operating earnings(16)3,194566—3,744
Interest, net(91)(2)2—(91)
Other, net(11)59—3
Earnings before income tax(118)3,197577—3,656
Provision for income tax, net121(1,055)(43)—(977)
Discontinued operations, net of tax(107)———(107)
Equity in net earnings of subsidiaries2,676——(2,676)—
Net earnings$2,572$2,142$534$(2,676)$2,572
Comprehensive income$2,468$2,112$543$(2,655)$2,468
105
CONDENSED CONSOLIDATING BALANCE SHEET
December 31, 2018ParentGuarantors
on a
Combined
BasisOther
Subsidiaries
on a
Combined
BasisConsolidating
AdjustmentsTotal
Consolidated
ASSETS
Current assets:
Cash and equivalents$460$—$503$—$963
Accounts receivable—1,1712,588—3,759
Unbilled receivables—2,7583,818—6,576
Inventories—5,855122—5,977
Other current assets(45)441518—914
Total current assets41510,2257,549—18,189
Noncurrent assets:
PP&E2737,1971,933—9,403
Accumulated depreciation of PP&E(83)(4,075)(897)—(5,055)
Intangible assets, net—2512,334—2,585
Goodwill—8,03111,563—19,594
Other assets195258239—692
Net investment in subsidiaries25,313——(25,313)—
Total noncurrent assets25,69811,66215,172(25,313)27,219
Total assets$26,113$21,887$22,721$(25,313)$45,408
LIABILITIES AND SHAREHOLDERS’ EQUITY
Current liabilities:
Short-term debt and current portion of long-term debt$850$—$123$—$973
Customer advances and deposits—4,5412,729—7,270
Other current liabilities5523,9442,000—6,496
Total current liabilities1,4028,4854,852—14,739
Noncurrent liabilities:
Long-term debt11,398397—11,444
Other liabilities1,5814,0731,839—7,493
Total noncurrent liabilities12,9794,1121,846—18,937
Total shareholders’ equity11,7329,29016,023(25,313)11,732
Total liabilities and shareholders’ equity$26,113$21,887$22,721$(25,313)$45,408
106
CONDENSED CONSOLIDATING BALANCE SHEET
December 31, 2017ParentGuarantors
on a
Combined
BasisOther
Subsidiaries
on a
Combined
BasisConsolidating
AdjustmentsTotal
Consolidated
ASSETS
Current assets:
Cash and equivalents$1,930$—$1,053$—$2,983
Accounts receivable—1,2592,358—3,617
Unbilled receivables—2,5472,693—5,240
Inventories—5,21687—5,303
Other current assets351461373—1,185
Total current assets2,2819,4836,564—18,328
Noncurrent assets:
PP&E2216,7791,237—8,237
Accumulated depreciation of PP&E(75)(3,869)(776)—(4,720)
Intangible assets, net—287415—702
Goodwill—8,3203,594—11,914
Other assets199232154—585
Net investment in subsidiaries15,771——(15,771)—
Total noncurrent assets16,11611,7494,624(15,771)16,718
Total assets$18,397$21,232$11,188$(15,771)$35,046
LIABILITIES AND SHAREHOLDERS’ EQUITY
Current liabilities:
Short-term debt and current portion of long-term debt$—$1$1$—$2
Customer advances and deposits—4,1802,812—6,992
Other current liabilities5613,7581,786—6,105
Total current liabilities5617,9394,599—13,099
Noncurrent liabilities:
Long-term debt3,950219—3,980
Other liabilities2,4513,473608—6,532
Total noncurrent liabilities6,4013,494617—10,512
Total shareholders’ equity11,4359,7995,972(15,771)11,435
Total liabilities and shareholders’ equity$18,397$21,232$11,188$(15,771)$35,046
107
CONDENSED CONSOLIDATING STATEMENT OF CASH FLOWS
Year Ended December 31, 2018ParentGuarantors
on a
Combined
BasisOther
Subsidiaries
on a
Combined
BasisConsolidating
AdjustmentsTotal
Consolidated
Net cash provided by operating activities*$(579)$2,954$773$—$3,148
Cash flows from investing activities:
Business acquisitions, net of cash acquired(9,749)(74)(276)—(10,099)
Capital expenditures(51)(513)(126)—(690)
Proceeds from sales of assets90472——562
Other, net4(12)1—(7)
Net cash used by investing activities(9,706)(127)(401)—(10,234)
Cash flows from financing activities:
Proceeds from fixed-rate notes6,461———6,461
Purchases of common stock(1,769)———(1,769)
Dividends paid(1,075)———(1,075)
Proceeds from floating-rate notes1,000———1,000
Proceeds from commercial paper, net851———851
Repayment of CSRA accounts receivable purchase
agreement——(450)—(450)
Other, net23531—68
Net cash provided by financing activities5,47035(419)—5,086
Net cash used by discontinued operations(20)———(20)
Cash sweep/funding by parent3,365(2,862)(503)——
Net decrease in cash and equivalents(1,470)—(550)—(2,020)
Cash and equivalents at beginning of year1,930—1,053—2,983
Cash and equivalents at end of year$460$—$503$—$963
Year Ended December 31, 2017
Net cash provided by operating activities*$312$2,371$1,193$—$3,876
Cash flows from investing activities:
Capital expenditures(26)(330)(72)—(428)
Business acquisitions, net of cash acquired—(350)(49)—(399)
Other, net1031(2)—39
Net cash used by investing activities(16)(649)(123)—(788)
Cash flows from financing activities:
Purchases of common stock(1,558)———(1,558)
Dividends paid(986)———(986)
Proceeds from fixed-rate notes985———985
Repayment of fixed-rate notes(900)———(900)
Other, net63(3)——60
Net cash used by financing activities(2,396)(3)——(2,399)
Net cash used by discontinued operations(40)———(40)
Cash sweep/funding by parent2,816(1,719)(1,097)——
Net increase in cash and equivalents676—(27)—649
Cash and equivalents at beginning of year1,254—1,080—2,334
Cash and equivalents at end of year$1,930$—$1,053$—$2,983
* Continuing operations only.
108
CONDENSED CONSOLIDATING STATEMENT OF CASH FLOWS
Year Ended December 31, 2016ParentGuarantors
on a
Combined
BasisOther
Subsidiaries
on a
Combined
BasisConsolidating
AdjustmentsTotal
Consolidated
Net cash provided by operating activities*$217$1,881$65$—$2,163
Cash flows from investing activities:
Capital expenditures(8)(336)(48)—(392)
Other, net732(38)—1
Net cash used by investing activities(1)(304)(86)—(391)
Cash flows from financing activities:
Purchases of common stock(1,996)———(1,996)
Proceeds from fixed-rate notes992———992
Dividends paid(911)———(911)
Repayment of fixed-rate notes(500)———(500)
Proceeds from stock option exercises292———292
Other, net(45)(1)——(46)
Net cash used by financing activities(2,168)(1)——(2,169)
Net cash used by discontinued operations(54)———(54)
Cash sweep/funding by parent1,528(1,576)48——
Net decrease in cash and equivalents(478)—27—(451)
Cash and equivalents at beginning of year1,732—1,053—2,785
Cash and equivalents at end of year$1,254$—$1,080$—$2,334
* Continuing operations only.
109
REPORT OF INDEPENDENT REGISTERED PUBLIC ACCOUNTING FIRM
To the Board of Directors and Shareholders of General Dynamics Corporation:
Opinion on the Consolidated Financial Statements
We have audited the accompanying Consolidated Balance Sheets of General Dynamics Corporation and subsidiaries (the Company) as ofDecember 31, 2018and2017, the related Consolidated Statements of Earnings, Comprehensive Income, Cash Flows, and Shareholders’ Equity for each of the years in the three-year period endedDecember 31, 2018, and the related notes (collectively, the Consolidated Financial Statements). In our opinion, the Consolidated Financial Statements present fairly, in all material respects, the financial position of the Company as ofDecember 31, 2018and2017, and the results of their operations and their cash flows for each of the years in the three-year period endedDecember 31, 2018, in conformity with U.S. generally accepted accounting principles.
We also have audited, in accordance with the standards of the Public Company Accounting Oversight Board (United States) (PCAOB), the Company’s internal control over financial reporting as ofDecember 31, 2018, based on criteria established inInternal Control – Integrated Framework (2013)issued by the Committee of Sponsoring Organizations of the Treadway Commission, and our report datedFebruary 13, 2019, expressed an unqualified opinion on the effectiveness of the Company’s internal control over financial reporting.
Basis for Opinion
These Consolidated Financial Statements are the responsibility of the Company’s management. Our responsibility is to express an opinion on these Consolidated Financial Statements based on our audits. We are a public accounting firm registered with the PCAOB and are required to be independent with respect to the Company in accordance with the U.S. federal securities laws and the applicable rules and regulations of the Securities and Exchange Commission and the PCAOB.
We conducted our audits in accordance with the standards of the PCAOB. Those standards require that we plan and perform the audit to obtain reasonable assurance about whether the Consolidated Financial Statements are free of material misstatement, whether due to error or fraud. Our audits included performing procedures to assess the risks of material misstatement of the Consolidated Financial Statements, whether due to error or fraud, and performing procedures that respond to those risks. Such procedures included examining, on a test basis, evidence regarding the amounts and disclosures in the Consolidated Financial Statements. Our audits also included evaluating the accounting principles used and significant estimates made by management, as well as evaluating the overall presentation of the Consolidated Financial Statements. We believe that our audits provide a reasonable basis for our opinion.

We have served as the Company’s auditor since 2002.
McLean, Virginia
February 13, 2019
110
SUPPLEMENTARY DATA (UNAUDITED)
(Dollars in millions, except per-share amounts)20172018
1Q2Q3Q4Q (a)1Q2Q3Q4Q
Revenue$7,441$7,675$7,580$8,277$7,535$9,186$9,094$10,378
Operating earnings1,0461,0671,0631,0601,0081,0881,1351,226
Earnings from continuing operations763749764636799786864909
Discontinued operations, net of tax——————(13)—
Net earnings$763$749$764$636$799$786$851$909
Earnings per share - basic (b):
Continuing operations$2.53$2.50$2.56$2.14$2.70$2.65$2.92$3.10
Discontinued operations——————(0.04)—
Net earnings$2.53$2.50$2.56$2.14$2.70$2.65$2.88$3.10
Earnings per share - diluted (b):
Continuing operations$2.48$2.45$2.52$2.10$2.65$2.62$2.89$3.07
Discontinued operations——————(0.04)—
Net earnings$2.48$2.45$2.52$2.10$2.65$2.62$2.85$3.07
Quarterly data are based on a 13-week period. Because our fiscal year ends onDecember 31, the number of days in our first and fourth quarters varies slightly from year to year.
(a)Fourth-quarter 2017 includes a $119 unfavorable one-time, non-cash impact resulting from the December 2017 change in tax law further discussed in Note F to the Consolidated Financial Statements in Item 8.
(b)The sum of the basic and diluted earnings per share for the four quarters of the year may differ from the annual basic and diluted earnings per share due to the required method of computing the weighted average number of shares in interim periods.
ITEM 9.CHANGES IN AND DISAGREEMENTS WITH ACCOUNTANTS ON ACCOUNTING AND FINANCIAL DISCLOSURE
None.
ITEM 9A.CONTROLS AND PROCEDURES
EVALUATION OF DISCLOSURE CONTROLS AND PROCEDURES
Our management, under the supervision and with the participation of the Chief Executive Officer and the Chief Financial Officer, evaluated the effectiveness of our disclosure controls and procedures as ofDecember 31, 2018, (as defined in Rule 13a-15(e) and Rule 15d-15(e) under the Securities Exchange Act of 1934, as amended). Based on this evaluation, the Chief Executive Officer and Chief Financial Officer concluded that, onDecember 31, 2018, our disclosure controls and procedures were effective.
The certifications of the company’s Chief Executive Officer and Chief Financial Officer required under Section 302 of the Sarbanes-Oxley Act have been filed as Exhibits 31.1 and 31.2 to this report.
111
MANAGEMENT’S REPORT ON INTERNAL CONTROL OVER FINANCIAL REPORTING
To the Shareholders of General Dynamics Corporation:
The management of General Dynamics Corporation is responsible for establishing and maintaining adequate internal control over financial reporting and for its assessment of the effectiveness of internal control over financial reporting as defined in Rules 13a-15(f) and 15d-15(f) under the Exchange Act. Our internal control system was designed to provide reasonable assurance to our management and board of directors regarding the preparation and fair presentation of published financial statements.
Because of its inherent limitations, internal control over financial reporting may not prevent or detect misstatements. Also, projections of any evaluation of effectiveness to future periods are subject to the risk that controls may become inadequate because of changes in conditions, or that the degree of compliance with the policies or procedures may deteriorate.
Our management evaluated the effectiveness of our internal control over financial reporting as ofDecember 31, 2018. In making this evaluation, we used the criteria set forth by the Committee of Sponsoring Organizations of the Treadway Commission inInternal Control – Integrated Framework (2013). Based on our evaluation we believe that, as ofDecember 31, 2018, our internal control over financial reporting is effective based on those criteria.
KPMG LLP has issued an audit report on the effectiveness of our internal control over financial reporting. The KPMG report immediately follows this report.


Phebe N. NovakovicJason W. Aiken
Chairman and Chief Executive OfficerSenior Vice President and Chief Financial Officer
112
REPORT OF INDEPENDENT REGISTERED PUBLIC ACCOUNTING FIRM
To the Board of Directors and Shareholders of General Dynamics Corporation:
Opinion on Internal Control Over Financial Reporting
We have audited General Dynamics Corporation and subsidiaries’ (the Company) internal control over financial reporting as ofDecember 31, 2018, based on criteria established inInternal Control – Integrated Framework (2013)issued by the Committee of Sponsoring Organizations of the Treadway Commission. In our opinion, the Company maintained, in all material respects, effective internal control over financial reporting as ofDecember 31, 2018, based on criteria established inInternal Control – Integrated Framework (2013)issued by the Committee of Sponsoring Organizations of the Treadway Commission.
We also have audited, in accordance with the standards of the Public Company Accounting Oversight Board (United States) (PCAOB), the Consolidated Balance Sheets of the Company as ofDecember 31, 2018and2017, the related Consolidated Statements of Earnings, Comprehensive Income, Cash Flows, and Shareholders’ Equity for each of the years in the three-year period endedDecember 31, 2018, and the related notes (collectively, the Consolidated Financial Statements), and our report datedFebruary 13, 2019, expressed an unqualified opinion on those Consolidated Financial Statements.
Basis for Opinion
The Company’s management is responsible for maintaining effective internal control over financial reporting and for its assessment of the effectiveness of internal control over financial reporting, included in the accompanying Management’s Report on Internal Control over Financial Reporting. Our responsibility is to express an opinion on the Company’s internal control over financial reporting based on our audit. We are a public accounting firm registered with the PCAOB and are required to be independent with respect to the Company in accordance with the U.S. federal securities laws and the applicable rules and regulations of the Securities and Exchange Commission and the PCAOB.
We conducted our audit in accordance with the standards of the PCAOB. Those standards require that we plan and perform the audit to obtain reasonable assurance about whether effective internal control over financial reporting was maintained in all material respects. Our audit of internal control over financial reporting included obtaining an understanding of internal control over financial reporting, assessing the risk that a material weakness exists, and testing and evaluating the design and operating effectiveness of internal control based on the assessed risk. Our audit also included performing such other procedures as we considered necessary in the circumstances. We believe that our audit provides a reasonable basis for our opinion.
Definition and Limitations of Internal Control Over Financial Reporting
A company’s internal control over financial reporting is a process designed to provide reasonable assurance regarding the reliability of financial reporting and the preparation of financial statements for external purposes in accordance with generally accepted accounting principles. A company’s internal control over financial reporting includes those policies and procedures that (1) pertain to the maintenance of records that, in reasonable detail, accurately and fairly reflect the transactions and dispositions of the assets of the company; (2) provide reasonable assurance that transactions are recorded as necessary to permit preparation of financial statements in accordance with generally accepted accounting principles, and that receipts and expenditures of the company are being made only in accordance with authorizations of management and directors of the company; and (3) provide reasonable assurance regarding prevention or timely detection of unauthorized acquisition, use, or disposition of the company’s assets that could have a material effect on the financial statements.
113
Because of its inherent limitations, internal control over financial reporting may not prevent or detect misstatements. Also, projections of any evaluation of effectiveness to future periods are subject to the risk that controls may become inadequate because of changes in conditions, or that the degree of compliance with the policies or procedures may deteriorate.

McLean, Virginia
February 13, 2019
CHANGES IN INTERNAL CONTROL OVER FINANCIAL REPORTING
There werenochanges in our internal control over financial reporting that occurred during the quarter endedDecember 31, 2018, that have materially affected, or are reasonably likely to materially affect, our internal control over financial reporting.
ITEM 9B.OTHER INFORMATION
None.
PART III
ITEM 10.DIRECTORS, EXECUTIVE OFFICERS AND CORPORATE GOVERNANCE
The information required to be set forth herein, except for the information included under Executive Officers of the Company in Part I, is included in the sections entitled “Election of the Board of Directors of the Company,” “Governance of the Company – Our Culture of Ethics,” “Audit Committee Report” and “Other Information – Section 16(a) Beneficial Ownership Reporting Compliance” in our definitive proxy statement for our2019annual shareholders meeting (the Proxy Statement), which sections are incorporated herein by reference.
ITEM 11.EXECUTIVE COMPENSATION
The information required to be set forth herein is included in the sections entitled “Governance of the Company – Director Compensation,” “Compensation Discussion and Analysis,” “Executive Compensation” and “Compensation Committee Report” in our Proxy Statement, which sections are incorporated herein by reference.
ITEM 12.SECURITY OWNERSHIP OF CERTAIN BENEFICIAL OWNERS AND MANAGEMENT AND RELATED STOCKHOLDER MATTERS
The information required to be set forth herein is included in the sections entitled “Security Ownership of Management” and “Security Ownership of Certain Beneficial Owners” in our Proxy Statement, which sections are incorporated herein by reference.
114
The information required to be set forth herein with respect to securities authorized for issuance under our equity compensation plans is included in the section entitled “Equity Compensation Plan Information” in our Proxy Statement, which section is incorporated herein by reference.
ITEM 13.CERTAIN RELATIONSHIPS AND RELATED TRANSACTIONS, AND DIRECTOR INDEPENDENCE
The information required to be set forth herein is included in the sections entitled “Governance of the Company – Related Person Transactions Policy” and “Governance of the Company – Director Independence” in our Proxy Statement, which sections are incorporated herein by reference.
ITEM 14.PRINCIPAL ACCOUNTANT FEES AND SERVICES
The information required to be set forth herein is included in the section entitled “Selection of Independent Auditors – Audit and Non-Audit Fees” in our Proxy Statement, which section is incorporated herein by reference.
PART IV
ITEM 15.EXHIBITS1.Consolidated Financial Statements
Consolidated Statement of Earnings
Consolidated Statement of Comprehensive Income
Consolidated Balance Sheet
Consolidated Statement of Cash Flows
Consolidated Statement of Shareholders’ Equity
Notes to Consolidated Financial Statements (A to S)2.Index to Exhibits - General Dynamics Corporation
Commission File No. 1-3671
Exhibits listed below, which have been filed with the Commission pursuant to the Securities Act of 1933, as amended, or the Securities Exchange Act of 1934, as amended, and which were filed as noted below, are hereby incorporated by reference and made a part of this report with the same effect as if filed herewith.
115
116
117
118
* Indicates a management contract or compensatory plan or arrangement required to be filed pursuant to Item 15(b) of Form 10-K.
** Filed or furnished herewith.
In accordance with Item 601(b)(4)(iii)(A) of Regulation S-K, copies of certain instruments defining the rights of holders of long-term debt of the company are not filed herewith. Pursuant to this regulation, we hereby agree to furnish a copy of any such instrument to the SEC upon request.
ITEM 16.FORM 10-K SUMMARY
None.
119
SIGNATURES
Pursuant to the requirements of the Securities Exchange Act of 1934, the Registrant has duly caused this report to be signed on its behalf by the undersigned thereunto duly authorized.
GENERAL DYNAMICS CORPORATION
by
William A. Moss
Vice President and Controller
Dated: February 13, 2019
Pursuant to the requirements of the Securities Exchange Act of 1934, this report has been signed below onFebruary 13, 2019, by the following persons on behalf of the Registrant and in the capacities indicated, including a majority of the directors.
120
Chairman, Chief Executive Officer and Director
Phebe N. Novakovic(Principal Executive Officer)
 Senior Vice President and Chief Financial Officer
Jason W. Aiken(Principal Financial Officer)
Vice President and Controller
William A. Moss(Principal Accounting Officer)
*
James S. CrownDirector
*
Rudy F. deLeonDirector
*
Lester L. LylesDirector
*
Mark M. MalcolmDirector
*
C. Howard NyeDirector
*
William A. OsbornDirector
*
Catherine B. ReynoldsDirector
*
Laura J. SchumacherDirector
*
Peter A. WallDirector
* By Gregory S. Gallopoulos pursuant to a Power of Attorney executed by the directors listed above, which Power of Attorney has been filed as an exhibit hereto and incorporated herein by reference thereto.

Gregory S. Gallopoulos
Senior Vice President, General Counsel and Secretary
121