1.prometheus框架结构

2.prometheus组件介绍
2.1.Prometheus Server
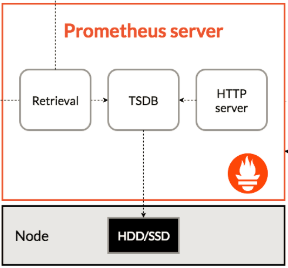
这是Prometheus的服务端,也就是核心。
Prometheus本身是一个以进程方式启动,之后以多进程和多线程实现监控数据收集、计算、查询、更新、存储的这样一个C/S模型运行模式。
2.2.prometheus存储
- prometheus采用的是time-series(时间序列)的方式,以一种自定义的格式存储在本地硬盘上。
- prometheus的本地T-S(time-series)数据库以每两小时为间隔来分block(块)存储,每一个块中又分为多个chunk文件,chunk文件是用来存放采集过来的数据的T-S数据,metadata和索引文件(index)
- index 文件是对
metrics(prometheus采集的数据叫metrics)和 labels(标签)进行索引后存储在chunk中,chunk是作为存储的基本单位,index and metadata是作为子集。 - prometheus平时是将采集过来的数据先都存放在内存之中(prometheus对内存的消耗还是不小的)以类似缓存的方式用于加快搜索和访问。
- 当出现宕机时,prometheus有一种保护机制叫做WAL,可以将数据定期存入硬盘中,以Chunk来表示,并在重新启动时,用以恢复进内存。
2.3.服务发现
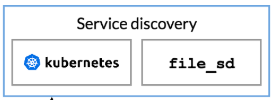
这里指的是prometheus可以集成的服务发现功能。
prometheus本身跟其他的开源软件类似,也是通过定义配置文件来给prometheus本身规定需要被监控的项目和被监控的节点。
2.4.采集客户端
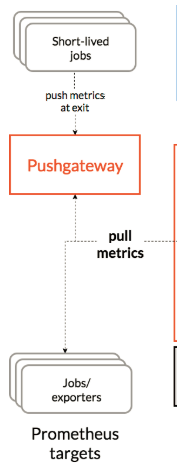
客户端主要有两种方式采集数据:
2.4.1.pull:
指的是,客户端(被监控机器)先安装各类已有exporters(由社区或企业、开发的监控客户端插件)在系统上,exporters 以守护进程的模式运行并开始采集数据。
exporter本身也是一个http_server可以对http请求作出响应,返回数据。prometheus用pull这种主动拉取的方式(Http get)去访问每个节点上exporter并采集回需要的数据。
2.4.2.push:
指的是,在客户端(或者服务端)安装官方提供的Pushgateway插件,然后运行自己开发的各种脚本,把监控数据组织成k-v的形式(metrics)形式,发送给pushgateway之后,pushgateway再推送给prometheus。
这是一种被动的数据采集模式。
3.prometheus的安装
安装prometheus之前,我们必须先安装ntp时间同步。prometheus T_S对系统时间的准确性要求很高,必须保证本机时间实时同步。
3.1.安装
我们可以去prometheus的官网去下载prometheus的二进制安装包,然后解压,执行./prometheus就可以了。
Prometheus Server 默认端口是 9090。当Prometheus启动后,我们可以通过浏览器来访问http://192.168.9.91:9090,将看到如下页面:

4.metrics的概念

prometheus监控中,对于采集过来的数据统一称为metrics数据。
metrics是一种对采样数据的总称(metrics并不代表某一种具体的数据格式,是一种对于度量计算单位的抽象)。
4.1.metrics的几种主要类型
4.1.1.Gauge(测量仪)

• 当前值的一次快照(snapshot)测量,可增可减
• 磁盘使用率,当前同时在线用户数
例如:
如果要监控硬盘容量或者内存的使用量,那么就应该使用Gauges的metrics格式来度量,因为硬盘的容量或者内存的使用量是随着时间的推移不断的瞬时变化的。这种变化没有规律,当前是多少,采集回来就是多少。
既不能一直持续增长,也不能一直降低,是多少就是多少,这种就是Gauges使用类型的代表。

4.1.2.Counter(计数器)

• 始终增加
• http请求数,下单数
从数据量0开始累积计算,在理想状态下只能是永远的增长不会降低(特殊情况除外)。
例如:
用户访问量的采样数据,产品被用户访问一次就是1过了10分钟后,积累到100,过一天后积累到20000……

4.1.3.Histogram(直方图)

• 通过分桶(bucket)方式统计样本分布
比如最小值、最大值、中间值、还有中位数,75百分位,90百分位,95百分位,98百分位、99百分位和99.9百分位的值(percentiles)。
这是一种特殊的metrics数据类型,代表的是一种近似的百分比估算数值。
例如:
http_response_time: HTTP响应时间,代表的是一次用户http请求,在系统传输和执行过程中总共花费的时间。
如果一天有100w次的http请求,把这100w次的http_response_time全部加起来然后除以100w最后的出来一个avg值,0.05秒=50毫秒。(正常情况下)
假如今天中午1:00的时候,发生了一次线上故障,系统的整体访问变得非常缓慢,大部分的用户请求时间达到了0.51秒的时间。但是这一段时间,只持续了5分钟,总的一天的平均值并不能表现得出来,那么想在1:001:05实现报警,总平均值就不大好用。
就算一天中,系统没有出现故障,大部分用户的响应时间在0.05秒左右。但是任何系统中都会存在慢请求,那么我们的监控需要发现和报警这种少部分的特殊情况,用平局值也不合适。
通过histogram类型,可以分别统计出全部用户的响应时间中,=0.05秒的量有多少;00.05秒的有多少,>2秒的有多少;>10秒的有多少。
我们就可以很清晰的看到,当前我们的系统中,处于基本正常状态的有多少百分比的用户,处于速度极快的有多少用户,有多少处于慢请求或者有问题的用户。
4.2.k/v的数据形式
上面我们了解了metrics的概念和类型,prometheus的数据类型就是依赖于这种metrics的类型来计算的。
对于采集回来的数据,往细了说,必须要以一种具体的数据格式供我们查看和使用。
go_memstats_lookups_total 0
node_disk_io_now{device="dm-0"} 0
node_disk_io_now{device="dm-1"} 0
node_disk_io_now{device="dm-2"} 0
node_disk_io_now{device="sda"} 0
node_filefd_maximum 379804
4.3.metric保留时长
普罗米修斯是为短期监视和警报需求而设计的。默认情况下,它在本地数据库中保存了15天的时间序列。如果您
希望保留更长时间的数据,建议的方法是将所需的数据发送到远程的第三方平台。普罗米修斯具有向外部数据存
储写入的能力。
5.prometheus配置
5.1.配置
Prometheus 启动的时候,可以加载运行参数 -config.file 指定配置文件,默认为 prometheus.yml。
配置⽂件是服务运⾏在哪个⽬录,就默认读取哪个⽬录下的prometheus.yml⽂件。除⾮使⽤参数指定其他位置的 配置⽂件。
在配置文件中我们可以指定 global, alerting, rule_files, scrape_configs, remote_write, remote_read 等属性。
配置文件结构大概为:
global:
[ scrape_interval: <duration> | default = 1m ]
[ scrape_timeout: <duration> | default = 10s ]
[ evaluation_interval: <duration> | default = 1m ]
external_labels:
[ <labelname>: <labelvalue> ... ]
rule_files:
[ - <filepath_glob> ... ]
scrape_configs:
[ - <scrape_config> ... ]
alerting:
alert_relabel_configs:
[ - <relabel_config> ... ]
alertmanagers:
[ - <alertmanager_config> ... ]
remote_write:
[ - <remote_write> ... ]
remote_read:
[ - <remote_read> ... ]
5.1.1.全局配置:
global 属于全局的默认配置,它主要包含 4 个属性,
- scrape_interval: 拉取 targets 的默认时间间隔。
- scrape_timeout: 拉取一个 target 的超时时间。
- evaluation_interval: 执行 rules 的时间间隔。
- external_labels: 额外的属性,会添加到拉取的数据并存到数据库中。
配置文件结构大概为:
global:
scrape_interval: 15s
evaluation_interval: 15s
scrape_timeout: 10s
external_labels:
monitor: 'codelab-monitor'
5.1.2.告警配置
alerting 配置能够更好的管理 Alertmanager, 主要包含 2 个参数:
- alert_relabel_configs: 动态修改 alert 属性的规则配置。
- alertmanagers: 用于动态发现 Alertmanager 的配置。
配置文件结构大概为:
alerting:
alert_relabel_configs:
[ - <relabel_config> ... ]
alertmanagers:
[ - <alertmanager_config> ... ]
5.1.3.规则配置
rule_files 主要用于配置 rules 文件,它支持多个文件以及文件目录。
配置文件大概为:
rule_files:
  - "rules/node.rules"
  - "rules2/*.rules"
5.1.4.服务发现
在 Prometheus 的配置中,一个最重要的概念就是数据源 target,而数据源的配置主要分为静态配置和动态发现, 如下:
- static_configs: 静态服务发现
- dns_sd_configs: DNS 服务发现
- file_sd_configs: 文件服务发现
- consul_sd_configs: Consul 服务发现
- serverset_sd_configs: Serverset 服务发现
它们具体使用以及配置模板,请参考服务发现配置模板。
它们中最重要的,也是使用最广泛的应该是 static_configs, 其实那些动态类型都可以看成是某些通用业务使用静态服务封装的结果。
5.1.5.数据拉取配置
scrape_configs 主要用于配置拉取数据节点,每一个拉取配置主要包含以下参数:
- job_name:任务名称
- honor_labels: 用于解决拉取数据标签有冲突,当设置为 true, 以拉取数据为准,否则以服务配置为准
- params:数据拉取访问时带的请求参数
- scrape_interval: 拉取时间间隔
- scrape_timeout: 拉取超时时间
- metrics_path: 拉取节点的 metric 路径
- scheme: 拉取数据访问协议
- sample_limit: 存储的数据标签个数限制,如果超过限制,该数据将被忽略,不入存储;默认值为0,表示没有限制
- relabel_configs: 拉取数据重置标签配置
- metric_relabel_configs:metric 重置标签配置
ServiceDiscoveryConfig 主要用于 target 发现,大体分为两类,静态配置和动态发现。
所以,一份完整的 scrape_configs 配置大致为:
job_name: <job_name>
[ scrape_interval: <duration> | default = <global_config.scrape_interval> ]
[ scrape_timeout: <duration> | default = <global_config.scrape_timeout> ]
[ metrics_path: <path> | default = /metrics ]
[ honor_labels: <boolean> | default = false ]
[ scheme: <scheme> | default = http ]
params:
[ <string>: [<string>, ...] ]
basic_auth:
[ username: <string> ]
[ password: <string> ]
[ bearer_token: <string> ]
[ bearer_token_file: /path/to/bearer/token/file ]
tls_config:
[ <tls_config> ]
[ proxy_url: <string> ]
azure_sd_configs:
[ - <azure_sd_config> ... ]
consul_sd_configs:
[ - <consul_sd_config> ... ]
dns_sd_configs:
[ - <dns_sd_config> ... ]
ec2_sd_configs:
[ - <ec2_sd_config> ... ]
openstack_sd_configs:
[ - <openstack_sd_config> ... ]
file_sd_configs:
[ - <file_sd_config> ... ]
gce_sd_configs:
[ - <gce_sd_config> ... ]
kubernetes_sd_configs:
[ - <kubernetes_sd_config> ... ]
marathon_sd_configs:
[ - <marathon_sd_config> ... ]
nerve_sd_configs:
[ - <nerve_sd_config> ... ]
serverset_sd_configs:
[ - <serverset_sd_config> ... ]
triton_sd_configs:
[ - <triton_sd_config> ... ]
static_configs:
[ - <static_config> ... ]
relabel_configs:
[ - <relabel_config> ... ]
metric_relabel_configs:
[ - <relabel_config> ... ]
[ sample_limit: <int> | default = 0 ]
5.1.5.1.在prometheus服务配置prometheus.yml
scrape_configs:
  - job_name: 'prometheus'
    static_configs:
    - targets: ['localhost:9090']
  - job_name: 'node'
    static_configs:
    - targets: ['192.168.20.172:9100', '192.168.20.173:9100', '192.168.20.174:9100']
5.1.5.2.在服务器上过滤收集器
使用 params 参数配合 collect ,过滤想要的数据
 params:
      collect[]:
        - cpu
        - meminfo
        - diskstats
        - netdev
        - netstat
        - filefd
        - filesystem
        - xfs
        - systemd
5.1.6.配置样例
global:
scrape_interval: 15s
evaluation_interval: 15s
alerting:
alertmanagers:
- static_configs:
- targets:
rule_files:
scrape_configs:
- job_name: 'prometheus'
static_configs:
- targets: ['localhost:9090']
- job_name: 'node'
static_configs:
- targets: ['192.168.20.172:9100', '192.168.20.173:9100', '192.168.20.174:9100']
params:
collect[]:
- cpu
- meminfo
- diskstats
- netdev
- netstat
- filefd
- filesystem
- xfs
- systemd
- job_name: 'docker'
static_configs:
- targets: ['192.168.20.172:8080', '192.168.20.173:8080', '192.168.20.174:8080']
6.监控docker
docker run \
  --volume=/:/rootfs:ro \
  --volume=/var/run:/var/run:rw \
  --volume=/sys:/sys:ro \
  --volume=/var/lib/docker/:/var/lib/docker:ro \
  --volume=/dev/disk/:/dev/disk:ro \
  --publish=8080:8080 \
  --detach=true \
  --name=cadvisor \
  google/cadvisor:latest
 - job_name: 'docker'
    static_configs:
      - targets: ['192.168.20.172:8080', '192.168.20.173:8080', '192.168.20.174:8080']
7.exproter的介绍
pull 形式采集数据;
官网提供了丰富的,成型exporters插件可以使用

大多数exporter下载之后,就提供了启动的命令,一般直接运行带上一定的参数就可以了。
8.pushgateway的介绍
push形式采集数据;
上面说的exporter,首先需要安装在被监控的服务器上,然后自动采集系统数据。本身是一个http_server,可以被prometheus服务器定时去HTTP GET取得数据,属于pull的形式。
把这个过程反过来,push的形式就是把pushgateway安装在客户端或者服务端(装在哪无所谓),pushgateway本身也是一个http服务器。运维通过写自己的脚本程序抓自己想要的监控数据,然后推送到pushgateway再由pushgateway推送到prometheus服务端。
pushgateway形式存在的原因如下:
- exporter虽然采集类型已经很丰富了,但是我们依然需要很多自制的监控数据,非规则化的,自定制的。
- exporter采集的数据,大部分我们用不到,用pushgateway自定义采集可以节省资源。
- 一个新的自定义的pushgateway的脚本开发,远远比开发一个全新的exporter简单快速多的多(exporter的开发需要使用真正的编程语言,shell这种快速脚本是不行的)。
- exporter虽然很丰富了,但是依然有许多我们需要的采集形式,exporter无法提供,pushgateway比较灵活。

9.PromQL
9.1.prometheus命令行格式
标签: 来⾃于采集的数据, 可以⾃定义,也可以直接使⽤默认的exporter提供的标签项。
命令⾏的查询,在原始输⼊的基础上,先使⽤{} 进⾏第⼀步过滤:
node_cpu_seconds_total{job="node"},指明监控job是node 的机器。
上面是精确匹配,过滤除了精确匹配,还有模糊匹配:
node_cpu_seconds_total{job=~"no.*"} #=> 把job名中,带有no的都查询出来。
.* 属于正则表达式
模糊匹配: =~
模糊不匹配: !~
9.2.常用函数的介绍
9.2.1.rate()
rate() 函数是专门搭配counter类型数据使⽤的函数,它的功能是按照设置⼀个时间段,取counter在这个时间段中平均每秒的增量。
rate(node_network_receive_bytes_total[1m])
9.2.2.increase()
increase 函数和rate() 的概念及使⽤⽅法非常相似。rate(1m) 是取⼀段时间增量的平均每秒数量,increase(1m) 则是取⼀段时间增量的总量。
increase(node_network_receive_bytes[1m])
9.2.3.sum()
sum就是总取合,sum 会把结果集的输出 进⾏总加合。比如,现在我监控的是两台客户端,使用rate(node_network_receive_bytes[1m])显⽰的结果集会包含如下内容:

当我们使⽤sum()包起来以后,sum(rate(node_network_receive_bytes[1m])) 就变成下⾯这样一条线了:

等于是给出了所有机器的每秒请求量。
9.2.4.topk()
取前⼏位的最⾼值。
topK(3,node_scrape_collector_success{collector="arp"})
topk(3,rate(node_network_receive_bytes[20m]))
根据给定的数字取数值最⾼ >=x 的数值。
9.2.5.count()
定义: 把数值符合条件的输出数目进⾏加合 。
count(node_netstat_Tcp_RetransSegs > 10)
本文内容由网友自发贡献,版权归原作者所有,本站不承担相应法律责任。如您发现有涉嫌抄袭侵权的内容,请联系:hwhale#tublm.com(使用前将#替换为@)