浅谈prometheus client golang
含类型精讲+接口示例+源码节选
Prometheus:
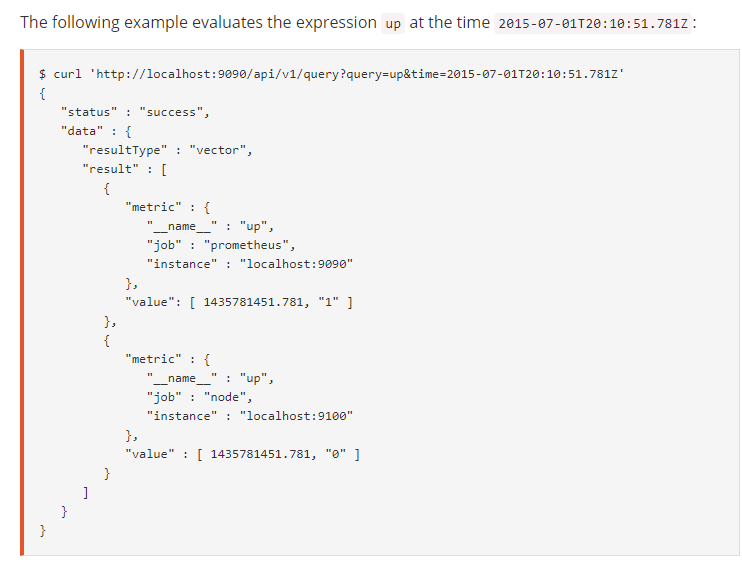
prometheus是什么,网上已经有很多文章了,prometheus的部署和启动可以参照这个链接。prometheus为使用者提供了http接口,使用者可以使用PromQl通过get或post来从prometheus进行query。prometheus http api传送
示例:
命名规则
在https://github.com/prometheus/common/blob/master/model/metric.go定义了prometheus metric的命名规则,即只能为大小写字母,数字,’_’,’:’,并且名字不能为空string,其他的字符均不可出现
    func IsValidMetricName(n LabelValue) bool {
        if len(n) == 0 {
            return false
        }
        for i, b := range n {
            if !((b >= 'a' && b <= 'z') || (b >= 'A' && b <= 'Z') || b == '_' || b == ':' || (b >= '0' && b <= '9' && i > 0)) {
                return false
            }
        }
        return true
    }
Client golang四种类型:
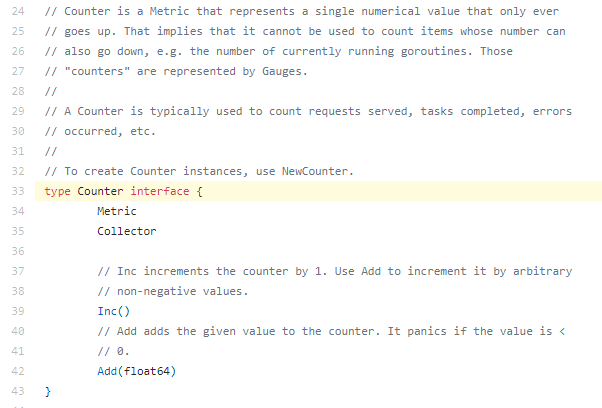
counter
计数器,并且只能增长和重置。例如:一个网站的总访问量,机器的运行时长
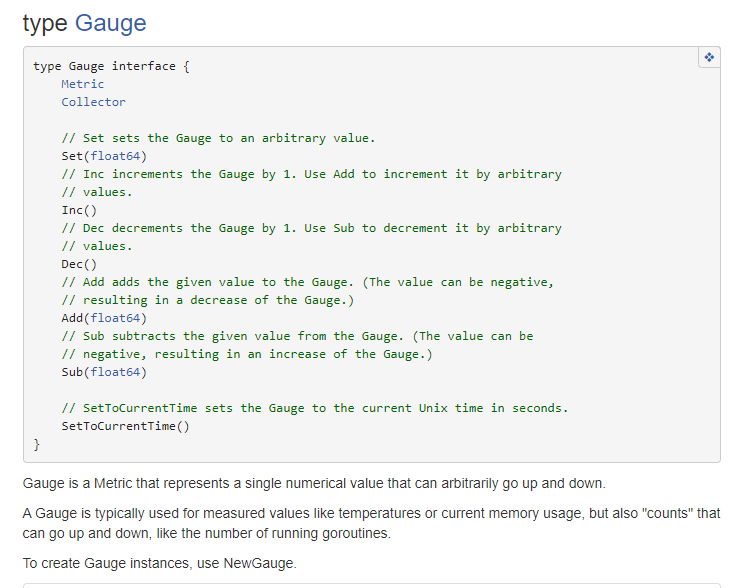
gauge
测量值,或瞬时记录值,可以增加,也可以减少。例如:一个视频的同时观看人数,当前运行的进程数
histogram
- 直方图,一个histogram会生成三个指标,分别是_count,_sum,_bucket。暂时为了好理解,先把_sum指标理解为Gauge,然后_count指标就是对Gauge值修改的总次数,而_bucket指标分成了几个桶子,把每次修改的值放进桶子里,不过会把值分几个层次,进入不同的桶,每个桶子里面的个数,就是直方图的纵坐标(实际情况是这个桶之前所有桶里面的个数是这个桶的纵坐标),而桶子的划分条件,就是横坐标。
- 举个铁球做例子,我们一共有1000个大小不同的铁球,质量从1kg-100kg不等,假设我分5个桶,每个桶存储不同质量的铁球,第一个桶0-20kg,第二个20-40kg,后面依此。然后1000个铁球,就是histogram的count,而1000个铁球的总质量就是histogram的sum,那么bucket就是那五个桶,当然几个桶,桶的规则怎样都是可以设计的,这五个桶每个的0-20,20-40…就是横坐标,而每个桶中的个数,就是纵坐标。根据这些数据就可以形成一个直方图。
- 因为直方图能够分出数据的质量,所以应用直方图的例子如:页面的响应时间,一块业务代码的时延
- 一个不错的例子:传送门
- 刚接触的可能会懵懵的,不过不太复杂,建议多去实践一下。
summary
- 概要,summary和histogram类似也会产生三个指标,分别是_count,_sum,和{quantile} ,count和sum与histogram的概念相同,quantile的含义是分位数,我们都知道中位数,那么中位数其实就是一个五分quantile,而summary可以在定义时指定很多分位数,如五分数,九分数,九九分数。九分数的概念就是比这个数小的数占百分之九十。
- summary和histogram类似也可以用来描述页面响应时间这类型的值,但差别是,histogram可以很容易看出来长尾值,比如投票很多时候都是去掉一个最高分,去掉一个最低分这种,长尾值就是很影响平均数的值,所有直方图能够很容易分析出问题数据。 而summary更能发现百分之多少的页面响应时间是多少,更能分析出页面响应时间的总体情况。
比较
- summary和histogram都很容易看出平均数(即_sum/_count),但是histogram容易发现影响平均数的极端值,而histogram可以直接得到分位数,两种结构可以由开发者根据数据需求自行抉择。
- histogram由clinet go直接算出分位数,而summary虽然可以算出分位数,但是更多是由开发者计算,或者调用prometheus的api获取histogram的分位数,prometheus处理函数传送门。
四种类型的接口(go):
下面图片可传送:
Counter
counter.Inc(), counter.Add(123)
Gauge
gauge.Set(), gauge.Inc(), gauge.Dec(), gauge.Add(123) , gauge.Sub(321)
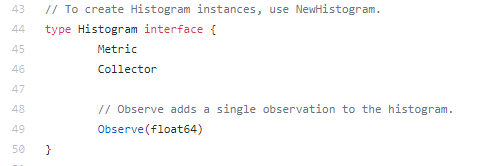
Histogram
histogram.Observer(123)//添加此数据到此histogram实例(使其观察)
Summary
summary.Observer(123)
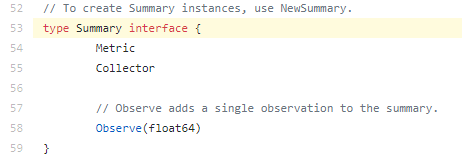
共有接口
    type Metric interface {
        //获取此metric的描述
        Desc() *Desc
        //转化为proto格式的Metric,返回
        Write(*dto.Metric) error //dto "github.com/prometheus/client_model/go"
    }
四种类型使用:
client golang的代码均是安全的,使用了sync库下的读写锁和CAS原子操作
package main
import (
"net/http"
"time"
"log"
"math"
"github.com/prometheus/client_golang/prometheus"
"github.com/prometheus/client_golang/prometheus/promhttp"
)
var (
MyTestCounter = prometheus.NewCounter(prometheus.CounterOpts{
Name: "my_test_counter",
Help: "my test counter",
})
MyTestGauge = prometheus.NewGauge(prometheus.GaugeOpts{
Name: "my_test_gauge",
Help: "my test gauge",
})
MyTestHistogram = prometheus.NewHistogram(prometheus.HistogramOpts{
Name: "my_test_histogram",
Help: "my test histogram",
Buckets: prometheus.LinearBuckets(20, 5, 5),
})
MyTestSummary = prometheus.NewSummary(prometheus.SummaryOpts{
Name: "my_test_summary",
Help: "my test summary",
Objectives: map[float64]float64{0.5: 0.05, 0.9: 0.01, 0.99: 0.001},
})
)
func main() {
prometheus.MustRegister(MyTestCounter)
prometheus.MustRegister(MyTestGauge)
prometheus.MustRegister(MyTestHistogram)
prometheus.MustRegister(MyTestSummary)
go func(){
var i float64
for {
i++
MyTestCounter.Add(10000)
MyTestGauge.Add(i)
MyTestHistogram.Observe(30 + math.Floor(120*math.Sin(float64(i)*0.1))/10)
MyTestSummary.Observe(30 + math.Floor(120*math.Sin(float64(i)*0.1))/10)
time.Sleep(time.Second)
}
}()
http.Handle("/metrics", promhttp.Handler())
log.Fatal(http.ListenAndServe("0.0.0.0:8080", nil))
}
我们看一下瞬时的值(运行之后在控制台输入curl 127.0.0.1:8080/metrics即可获取metrics):
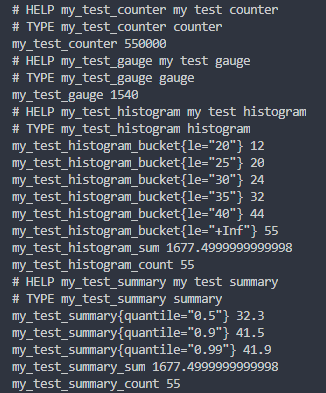
- 我们重点看下histogram_bucket,le=“20”,代表0-20的值有12个,le=“25”,代表0-25的值有20个,le="+Inf",代表一共有55个值,和histogram的值是相同的,如果想计算30-35的值的个数,需要用le=“35” - le="30"来获取。
- summary{quantile=“0.5”},代表瞬时,中位数为32.3,summary{quantile=“0.9”},九分数为41.5。
- histogram的平均数是 sum/count = 1677.5/55 = 30.5
- summary的平均数是 sum/count = 1677.5/55 = 30.5,因为他们两个每次赋的值相同,所以平均数也肯定相同。他们的区别通过上面的数据,估计读者也应该有个了解了。
放上几张prometheus的图表,很好理解:
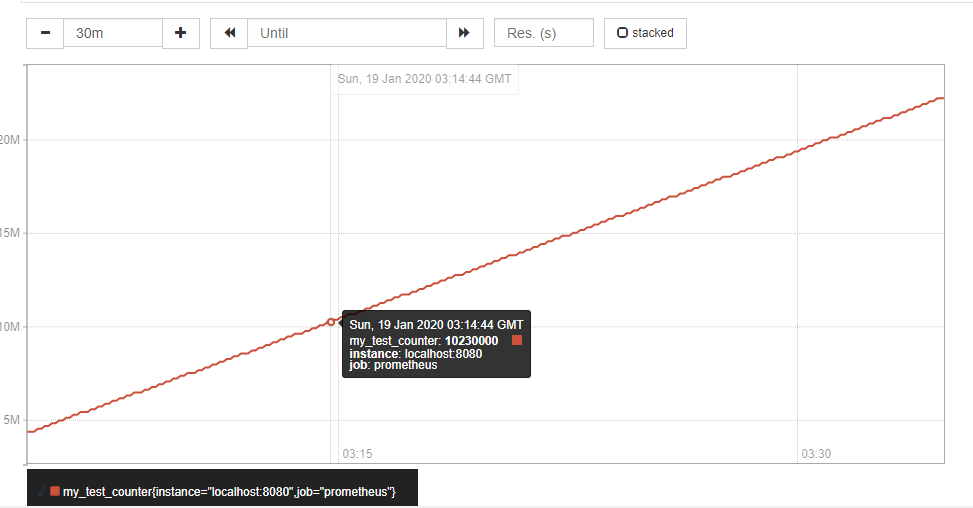
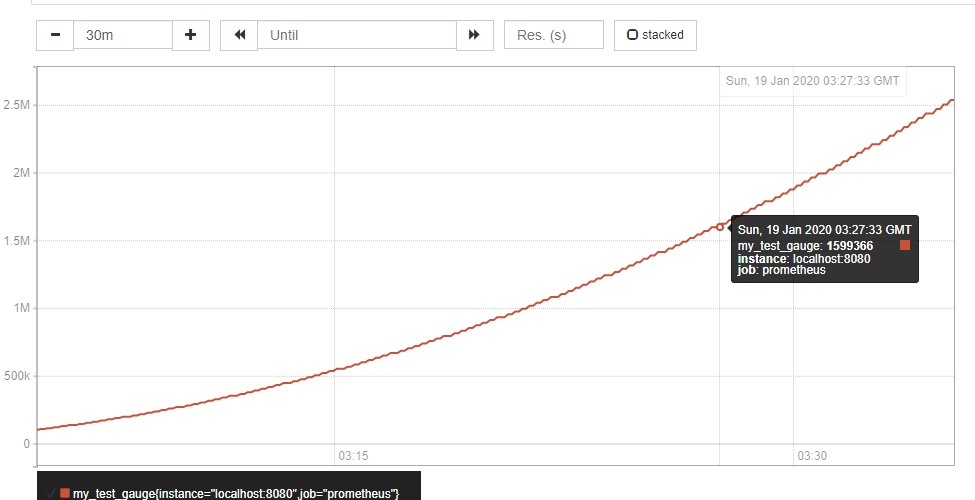
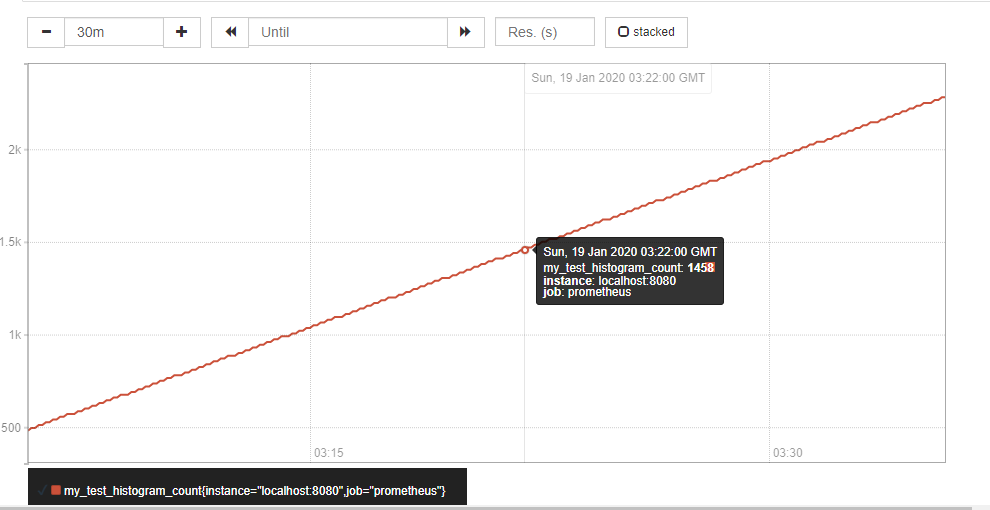
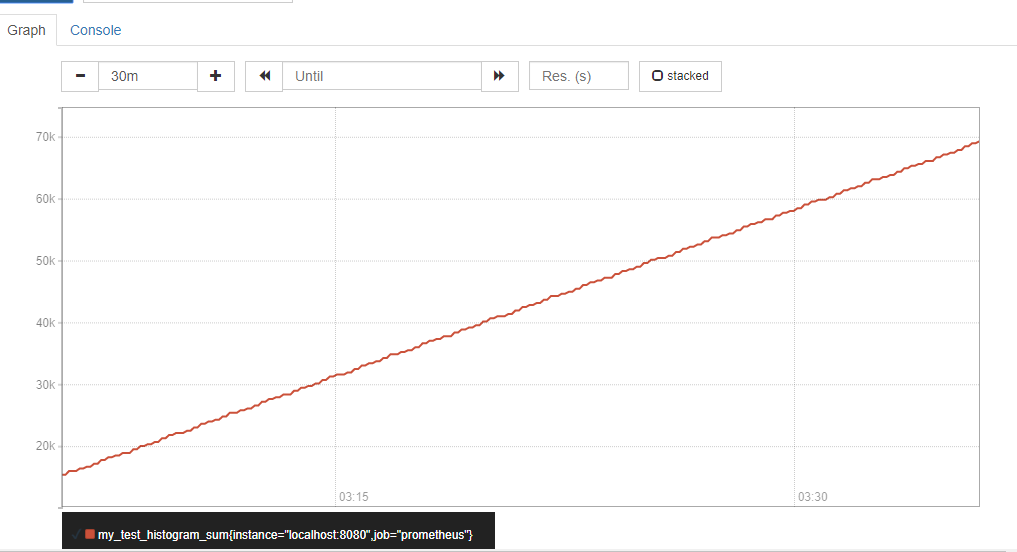
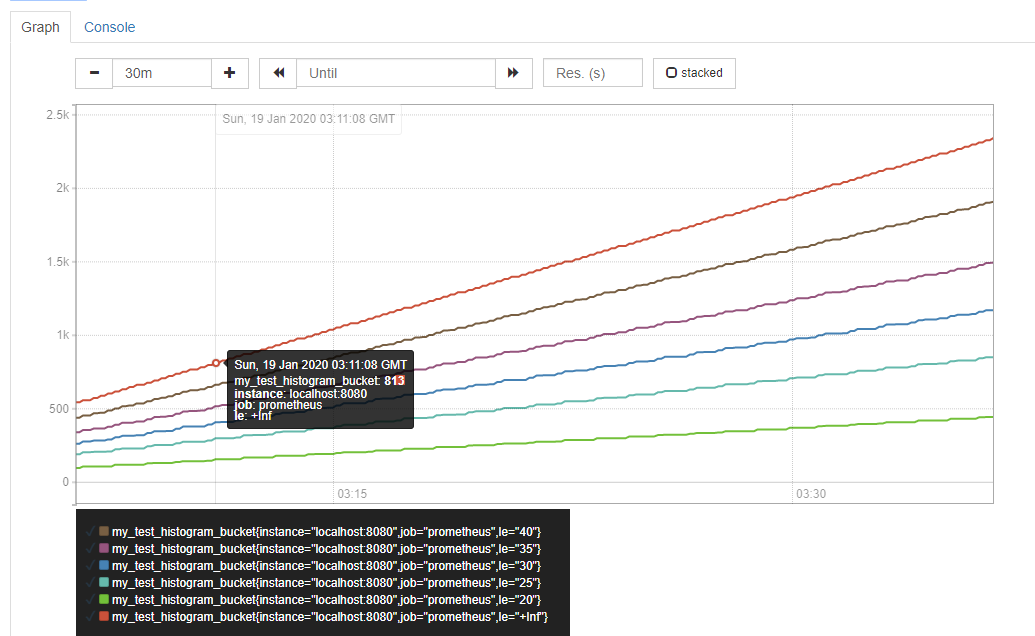
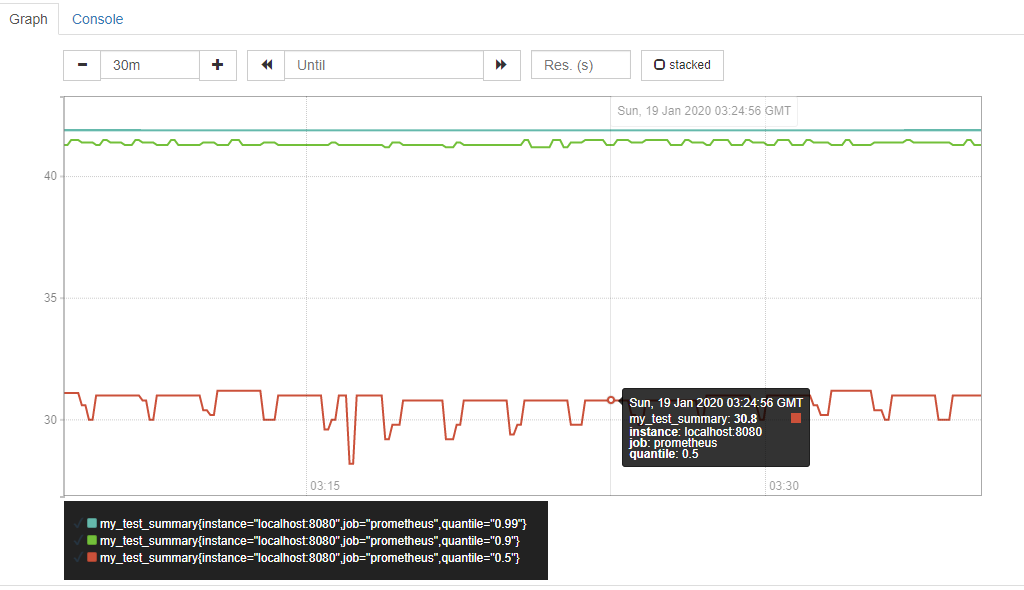
图像存在锯齿是因为prometheus默认每15s同步一次数据
Vector类型及其提供的接口:
不论是Counter, Gauge, Histogram, Summary,都有自己的数组形式, 我们可以直接使用。
以下是client go提供的对数组全部操作的接口。
type metricVec struct {
*metricMap
curry []curriedLabelValue
hashAdd func(h uint64, s string) uint64
hashAddByte func(h uint64, b byte) uint64
}
func (m *metricVec) DeleteLabelValues(lvs ...string) bool{}
func (m *metricVec) Delete(labels Labels) bool {}
type Observer interface {
Observe(float64)
}
type XXXVec struct {
*metricVec
}
func NewXXXVec(opts XXXOpts, labelNames []string) *XXXVec{}
func (v *XXXVec) GetMetricWith(labels Labels) (TTT, error){}
func (v *XXXVec) GetMetricWithLabelValues(lvs ...string)(TTT, error){}
func (v *XXXVec) WithLabelValues(lvs ...string) TTT{}
func (v *XXXVec) With(labels Labels) TTT{}
func (v *XXXVec) CurryWith(labels Labels) (TTTVec, error){}
func (v *XXXVec) MustCurryWith(labels Labels) TTTVec{}
数组的使用:
package main
import (
"net/http"
"time"
"log"
"math"
"github.com/prometheus/client_golang/prometheus"
"github.com/prometheus/client_golang/prometheus/promhttp"
)
var (
MyTestHistogramVec = prometheus.NewHistogramVec(prometheus.HistogramOpts{
Name: "human_weight_histogram",
Help: "human weight histogram",
Buckets: prometheus.LinearBuckets(1, 10, 15),
},[]string{"sex","age","race"},)
)
func main() {
prometheus.MustRegister(MyTestHistogramVec)
go func(){
var i float64
for i < 20 {
MyTestHistogramVec.With(prometheus.Labels{"sex":"man","age":"20","race":"black"}).Observe(90 + math.Floor(400*math.Sin(float64(i*127)*0.1))/10)
MyTestHistogramVec.With(prometheus.Labels{"sex":"woman","age":"20","race":"black"}).Observe(70 + math.Floor(400*math.Sin(float64(i*127)*0.1))/10)
MyTestHistogramVec.With(prometheus.Labels{"sex":"man","age":"25","race":"black"}).Observe(95 + math.Floor(400*math.Sin(float64(i*127)*0.1))/10)
MyTestHistogramVec.With(prometheus.Labels{"sex":"woman","age":"25","race":"black"}).Observe(95 + math.Floor(400*math.Sin(float64(i*127)*0.1))/10)
MyTestHistogramVec.With(prometheus.Labels{"sex":"man","age":"20","race":"yellow"}).Observe(90 + math.Floor(400*math.Sin(float64(i*127)*0.1))/10)
time.Sleep(time.Second)
i++
}
}()
http.Handle("/metrics", promhttp.Handler())
log.Fatal(http.ListenAndServe("0.0.0.0:8080", nil)
}
看一下结果
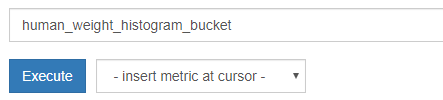
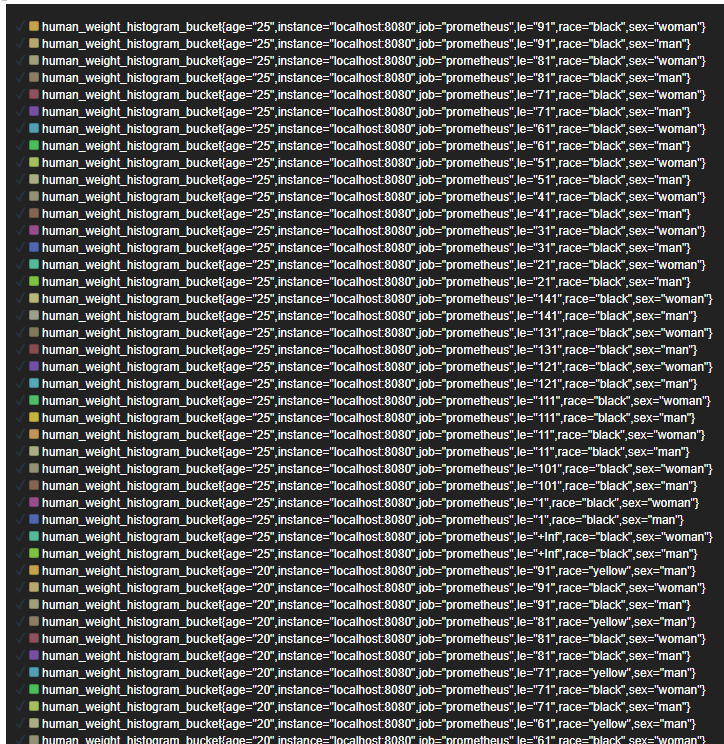
可以发现,有太多项了
下面我们对结果进行过滤
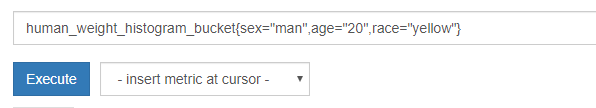
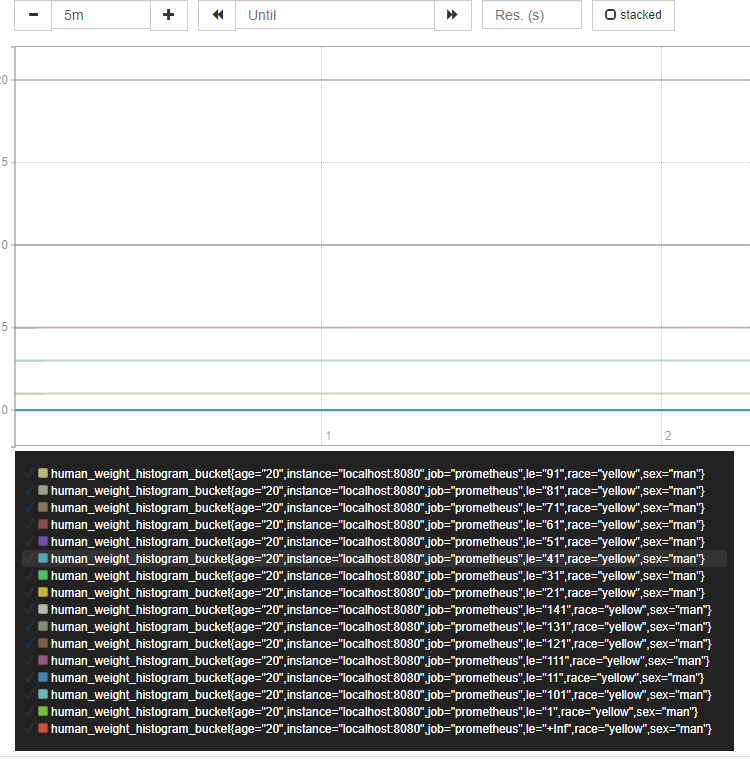
这样就可以对数组,或者Histogram, 或者Summary进行过滤了
promauto:
如果你是一个懒人的话,不想去手动Registor()的话,promauto提供了这种方法。
import (
"github.com/prometheus/client_golang/prometheus"
"github.com/prometheus/client_golang/prometheus/promauto"
)
var histogram = promauto.NewHistogram(prometheus.HistogramOpts{
Name: "random_numbers",
Help: "A histogram of normally distributed random numbers.",
Buckets: prometheus.LinearBuckets(-3, .1, 61),
})
func NewCounterFunc(opts prometheus.CounterOpts, function func() float64) prometheus.CounterFunc {
g := prometheus.NewCounterFunc(opts, function)
prometheus.MustRegister(g)
return g
}
func NewSummary(opts prometheus.SummaryOpts) prometheus.Summary {
s := prometheus.NewSummary(opts)
prometheus.MustRegister(s)
return s
}
func NewHistogramVec(opts prometheus.HistogramOpts, labelNames []string) *prometheus.HistogramVec {
h := prometheus.NewHistogramVec(opts, labelNames)
prometheus.MustRegister(h)
return h
}
Timer:
原文链接
package prometheus
import "time"
type Timer struct {
begin time.Time
observer Observer
}
func NewTimer(o Observer) *Timer {
return &Timer{
begin: time.Now(),
observer: o,
}
}
func (t *Timer) ObserveDuration() time.Duration {
d := time.Since(t.begin)
if t.observer != nil {
t.observer.Observe(d.Seconds())
}
return d
}
最后附赠几个网络上文档链接
https://godoc.org/github.com/prometheus/client_golang/prometheus
https://ryanyang.gitbook.io/prometheus/
https://s0prometheus0io.icopy.site/docs/introduction/overview/
本文内容由网友自发贡献,版权归原作者所有,本站不承担相应法律责任。如您发现有涉嫌抄袭侵权的内容,请联系:hwhale#tublm.com(使用前将#替换为@)