
来自公众号:大胖聊编程
作者:大胖
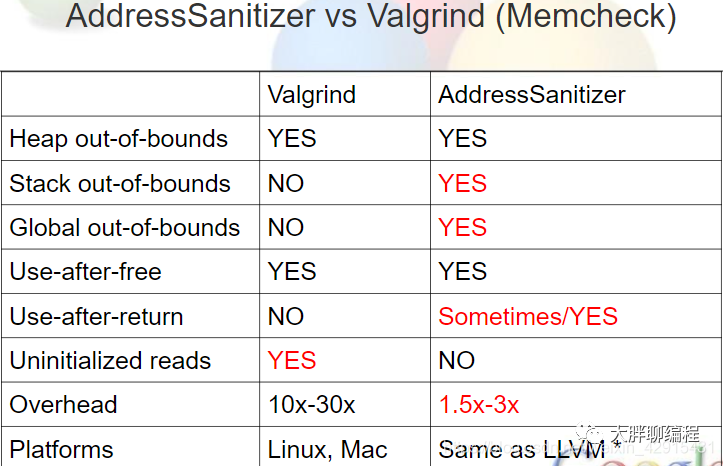
ASan,即Address Sanitizer,是一个适用于c/c++程序的动态内存错误检测器,它由一个编译器检测模块(LLVM pass)和一个替换malloc函数的运行时库组成,在性能及检测内存错误方面都优于Valgrind,你值得拥有。
一
适用平台
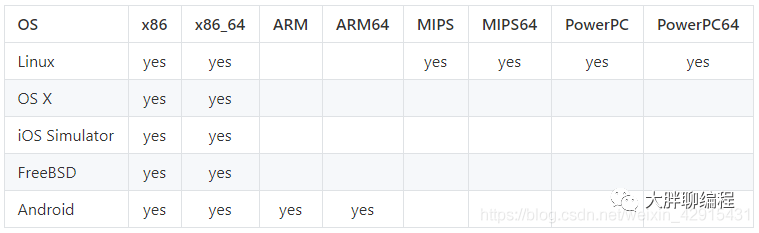
在LLVM3.1版之后,ASan就是其的一个组成部分,所以所有适用LLVM的平台,且llvm版本大于3.1的,都可以适用ASan来检查c/c++内存错误。
对于gcc,则是4.8版本之后才加入ASan,但是ASan的完整功能则是要gcc版本在4.9.2以上。
二
强大功能
ASan作为编译器内置功能,支持检测各种内存错误:
ASan和Valgrind对比如下图:
三
如何使用
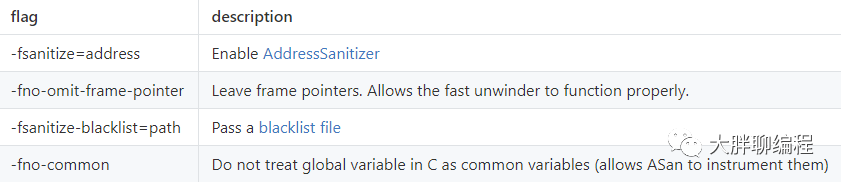
使用ASan时,只需gcc选项加上-fsanitize=address选项;
如果想要在使用asan的时候获取更好的性能,可以加上O1或者更高的编译优化选项;
想要在错误信息中让栈追溯信息更友好,可以加上-fno-omit-frame-pointer选项。
本文针对linux x86-64平台,gcc编译器环境实验。
本文实验环境:
[root@yglocal ~]# lsb_release -a
LSB Version:    :core-4.1-amd64:core-4.1-noarch
Distributor ID: CentOS
Description:    CentOS Linux release 8.1.1911 (Core)
Release:        8.1.1911
Codename:       Core
[root@yglocal ~]# uname -r
4.18.0-147.el8.x86_64
[root@yglocal ~]# gcc --version
gcc (GCC) 8.3.1 20190507 (Red Hat 8.3.1-4)
Copyright (C) 2018 Free Software Foundation, Inc.
This is free software; see the source for copying conditions.  There is NO
warranty; not even for MERCHANTABILITY or FITNESS FOR A PARTICULAR PURPOSE
在centos上使用ASan,编译会报如下错误(gcc 4.8.5):
[root@localhost test]# gcc -g -O2 -fsanitize=address -fno-omit-frame-pointer hello.c
/usr/bin/ld: cannot find /usr/lib64/libasan.so.0.0.0
collect2: error: ld returned 1 exit status
安装libasan即可:
[root@localhost test]# yum install libasan
注:ubuntu x86-64系统只需gcc版本高于4.8即可;但是在rhel/centos上使用ASan功能,除了gcc版本大于4.8之外,还需要安装libasan。
下面针对内存的几种c/c++常见内存错误,编写例子,看下ASan的检测输出情况:
1
堆缓冲区溢出
测试代码:
[root@yglocal asan_test]# vi heap_ovf_test.c


#include <stdio.h>
#include <stdlib.h>
#include <string.h>


int main()
{
        char *heap_buf = (char*)malloc(32*sizeof(char));
        memcpy(heap_buf+30, "overflow", 8);    //在heap_buf的第30个字节开始,拷贝8个字符


        free(heap_buf);


        return 0;
}
编译并运行:
[root@yglocal asan_test]# gcc -fsanitize=address -fno-omit-frame-pointer -o heap_ovf_test heap_ovf_test.c
[root@yglocal asan_test]# ./heap_ovf_test
=================================================================
==40602==ERROR: AddressSanitizer: heap-buffer-overflow on address 0x603000000030 at pc 0x7f3de8f91a1d bp 0x7ffd4b4ebb60 sp 0x7ffd4b4eb308
WRITE of size 8 at 0x603000000030 thread T0
    #0 0x7f3de8f91a1c  (/lib64/libasan.so.5+0x40a1c)
    #1 0x400845 in main (/root/asan_test/heap_ovf_test+0x400845)
    #2 0x7f3de8bb1872 in __libc_start_main (/lib64/libc.so.6+0x23872)
    #3 0x40075d in _start (/root/asan_test/heap_ovf_test+0x40075d)


0x603000000030 is located 0 bytes to the right of 32-byte region [0x603000000010,0x603000000030)
allocated by thread T0 here:
    #0 0x7f3de9040ba8 in __interceptor_malloc (/lib64/libasan.so.5+0xefba8)
    #1 0x400827 in main (/root/asan_test/heap_ovf_test+0x400827)
    #2 0x7f3de8bb1872 in __libc_start_main (/lib64/libc.so.6+0x23872)


SUMMARY: AddressSanitizer: heap-buffer-overflow (/lib64/libasan.so.5+0x40a1c)
Shadow bytes around the buggy address:
  0x0c067fff7fb0: 00 00 00 00 00 00 00 00 00 00 00 00 00 00 00 00
  0x0c067fff7fc0: 00 00 00 00 00 00 00 00 00 00 00 00 00 00 00 00
  0x0c067fff7fd0: 00 00 00 00 00 00 00 00 00 00 00 00 00 00 00 00
  0x0c067fff7fe0: 00 00 00 00 00 00 00 00 00 00 00 00 00 00 00 00
  0x0c067fff7ff0: 00 00 00 00 00 00 00 00 00 00 00 00 00 00 00 00
=>0x0c067fff8000: fa fa 00 00 00 00[fa]fa fa fa fa fa fa fa fa fa
  0x0c067fff8010: fa fa fa fa fa fa fa fa fa fa fa fa fa fa fa fa
  0x0c067fff8020: fa fa fa fa fa fa fa fa fa fa fa fa fa fa fa fa
  0x0c067fff8030: fa fa fa fa fa fa fa fa fa fa fa fa fa fa fa fa
  0x0c067fff8040: fa fa fa fa fa fa fa fa fa fa fa fa fa fa fa fa
  0x0c067fff8050: fa fa fa fa fa fa fa fa fa fa fa fa fa fa fa fa
Shadow byte legend (one shadow byte represents 8 application bytes):
  Addressable:           00
  Partially addressable: 01 02 03 04 05 06 07
  Heap left redzone:       fa
  Freed heap region:       fd
  Stack left redzone:      f1
  Stack mid redzone:       f2
  Stack right redzone:     f3
  Stack after return:      f5
  Stack use after scope:   f8
  Global redzone:          f9
  Global init order:       f6
  Poisoned by user:        f7
  Container overflow:      fc
  Array cookie:            ac
  Intra object redzone:    bb
  ASan internal:           fe
  Left alloca redzone:     ca
  Right alloca redzone:    cb
==40602==ABORTING
[root@yglocal asan_test]#
可以看到asan报错:==40602==ERROR: AddressSanitizer: heap-buffer-overflow on address 0x603000000030 at xxxx,下面也列出了发生heap-buffer-overflow时的调用链及heap buffer在哪里申请的。
2
栈缓冲区溢出
测试代码:
[root@yglocal asan_test]# vi stack_ovf_test.c


#include <stdio.h>
#include <string.h>


int main()
{
        char stack_buf[4] = {0};
        strcpy(stack_buf, "1234");


        return 0;
}
编译并运行:
[root@yglocal asan_test]# ./stack_ovf_test
=================================================================
==38634==ERROR: AddressSanitizer: stack-buffer-overflow on address 0x7ffcf3d8b8d4 at pc 0x7f8714bbaa1d bp 0x7ffcf3d8b8a0 sp 0x7ffcf3d8b048
WRITE of size 5 at 0x7ffcf3d8b8d4 thread T0
    #0 0x7f8714bbaa1c  (/lib64/libasan.so.5+0x40a1c)
    #1 0x400949 in main (/root/asan_test/stack_ovf_test+0x400949)
    #2 0x7f87147da872 in __libc_start_main (/lib64/libc.so.6+0x23872)
    #3 0x4007cd in _start (/root/asan_test/stack_ovf_test+0x4007cd)


Address 0x7ffcf3d8b8d4 is located in stack of thread T0 at offset 36 in frame
    #0 0x400895 in main (/root/asan_test/stack_ovf_test+0x400895)


  This frame has 1 object(s):
    [32, 36) 'stack_buf' <== Memory access at offset 36 overflows this variable
HINT: this may be a false positive if your program uses some custom stack unwind mechanism or swapcontext
      (longjmp and C++ exceptions *are* supported)
SUMMARY: AddressSanitizer: stack-buffer-overflow (/lib64/libasan.so.5+0x40a1c)
Shadow bytes around the buggy address:
  0x10001e7a96c0: 00 00 00 00 00 00 00 00 00 00 00 00 00 00 00 00
  0x10001e7a96d0: 00 00 00 00 00 00 00 00 00 00 00 00 00 00 00 00
  0x10001e7a96e0: 00 00 00 00 00 00 00 00 00 00 00 00 00 00 00 00
  0x10001e7a96f0: 00 00 00 00 00 00 00 00 00 00 00 00 00 00 00 00
  0x10001e7a9700: 00 00 00 00 00 00 00 00 00 00 00 00 00 00 00 00
=>0x10001e7a9710: 00 00 00 00 00 00 f1 f1 f1 f1[04]f2 f2 f2 f3 f3
  0x10001e7a9720: f3 f3 00 00 00 00 00 00 00 00 00 00 00 00 00 00
  0x10001e7a9730: 00 00 00 00 00 00 00 00 00 00 00 00 00 00 00 00
  0x10001e7a9740: 00 00 00 00 00 00 00 00 00 00 00 00 00 00 00 00
  0x10001e7a9750: 00 00 00 00 00 00 00 00 00 00 00 00 00 00 00 00
  0x10001e7a9760: 00 00 00 00 00 00 00 00 00 00 00 00 00 00 00 00
......
可以看到asan报错:==38634==ERROR: AddressSanitizer: stack-buffer-overflow on address 0x7ffcf3d8b8d4 at xxx,发生stack buffer overflow时函数的调用链信息。
3
使用悬空指针
测试代码:
[root@yglocal asan_test]# vi dangling_pointer_test.c


#include <stdio.h>
#include <stdlib.h>
#include <string.h>


int main()
{
        char *p = (char*)malloc(32*sizeof(char));
        free(p);


        int a = p[1];


        return 0;
}
编译并运行:
[root@yglocal asan_test]# gcc -fsanitize=address -fno-omit-frame-pointer -o dangling_pointer_test dangling_pointer_test.c
[root@yglocal asan_test]# ./dangling_pointer_test
=================================================================
==83532==ERROR: AddressSanitizer: heap-use-after-free on address 0x603000000011 at pc 0x0000004007c4 bp 0x7ffd7f562760 sp 0x7ffd7f562750
READ of size 1 at 0x603000000011 thread T0
    #0 0x4007c3 in main (/root/asan_test/dangling_pointer_test+0x4007c3)
    #1 0x7f56196cd872 in __libc_start_main (/lib64/libc.so.6+0x23872)
    #2 0x4006ad in _start (/root/asan_test/dangling_pointer_test+0x4006ad)


0x603000000011 is located 1 bytes inside of 32-byte region [0x603000000010,0x603000000030)
freed by thread T0 here:
    #0 0x7f5619b5c7e0 in __interceptor_free (/lib64/libasan.so.5+0xef7e0)
    #1 0x400787 in main (/root/asan_test/dangling_pointer_test+0x400787)
    #2 0x7f56196cd872 in __libc_start_main (/lib64/libc.so.6+0x23872)


previously allocated by thread T0 here:
    #0 0x7f5619b5cba8 in __interceptor_malloc (/lib64/libasan.so.5+0xefba8)
    #1 0x400777 in main (/root/asan_test/dangling_pointer_test+0x400777)
    #2 0x7f56196cd872 in __libc_start_main (/lib64/libc.so.6+0x23872)


SUMMARY: AddressSanitizer: heap-use-after-free (/root/asan_test/dangling_pointer_test+0x4007c3) in main
Shadow bytes around the buggy address:
  0x0c067fff7fb0: 00 00 00 00 00 00 00 00 00 00 00 00 00 00 00 00
  0x0c067fff7fc0: 00 00 00 00 00 00 00 00 00 00 00 00 00 00 00 00
  0x0c067fff7fd0: 00 00 00 00 00 00 00 00 00 00 00 00 00 00 00 00
  0x0c067fff7fe0: 00 00 00 00 00 00 00 00 00 00 00 00 00 00 00 00
  0x0c067fff7ff0: 00 00 00 00 00 00 00 00 00 00 00 00 00 00 00 00
=>0x0c067fff8000: fa fa[fd]fd fd fd fa fa fa fa fa fa fa fa fa fa
  0x0c067fff8010: fa fa fa fa fa fa fa fa fa fa fa fa fa fa fa fa
  0x0c067fff8020: fa fa fa fa fa fa fa fa fa fa fa fa fa fa fa fa
  0x0c067fff8030: fa fa fa fa fa fa fa fa fa fa fa fa fa fa fa fa
  0x0c067fff8040: fa fa fa fa fa fa fa fa fa fa fa fa fa fa fa fa
  0x0c067fff8050: fa fa fa fa fa fa fa fa fa fa fa fa fa fa fa fa
Shadow byte legend (one shadow byte represents 8 application bytes):
......
4
使用栈上返回的变量
[root@yglocal asan_test]# vi use-after-return.c


#include <stdio.h>
#include <stdlib.h>
#include <string.h>
int *ptr;
void get_pointer()
{
        int local[10];
        ptr = &local[0];
        return;
}


int main()
{
        get_pointer();


        printf("%d\n", *ptr);


        return 0;
}
运行并编译:
[root@yglocal asan_test]# gcc -fsanitize=address -fno-omit-frame-pointer -o use_after_return use-after-return.c
[root@yglocal asan_test]# ASAN_OPTIONS=detect_stack_use_after_return=1 ./use_after_return
=================================================================
==108419==ERROR: AddressSanitizer: stack-use-after-return on address 0x7fa2de200020 at pc 0x0000004009a2 bp 0x7ffccaef23c0 sp 0x7ffccaef23b0
READ of size 4 at 0x7fa2de200020 thread T0
    #0 0x4009a1 in main (/root/asan_test/use_after_return+0x4009a1)
    #1 0x7fa2e264d872 in __libc_start_main (/lib64/libc.so.6+0x23872)
    #2 0x4007cd in _start (/root/asan_test/use_after_return+0x4007cd)


Address 0x7fa2de200020 is located in stack of thread T0 at offset 32 in frame
    #0 0x400895 in get_pointer (/root/asan_test/use_after_return+0x400895)


  This frame has 1 object(s):
    [32, 72) 'local' <== Memory access at offset 32 is inside this variable
HINT: this may be a false positive if your program uses some custom stack unwind mechanism or swapcontext
      (longjmp and C++ exceptions *are* supported)
SUMMARY: AddressSanitizer: stack-use-after-return (/root/asan_test/use_after_return+0x4009a1) in main
Shadow bytes around the buggy address:
  0x0ff4dbc37fb0: 00 00 00 00 00 00 00 00 00 00 00 00 00 00 00 00
  0x0ff4dbc37fc0: 00 00 00 00 00 00 00 00 00 00 00 00 00 00 00 00
  0x0ff4dbc37fd0: 00 00 00 00 00 00 00 00 00 00 00 00 00 00 00 00
  0x0ff4dbc37fe0: 00 00 00 00 00 00 00 00 00 00 00 00 00 00 00 00
  0x0ff4dbc37ff0: 00 00 00 00 00 00 00 00 00 00 00 00 00 00 00 00
=>0x0ff4dbc38000: f5 f5 f5 f5[f5]f5 f5 f5 f5 f5 f5 f5 f5 f5 f5 f5
  0x0ff4dbc38010: 00 00 00 00 00 00 00 00 00 00 00 00 00 00 00 00
  0x0ff4dbc38020: 00 00 00 00 00 00 00 00 00 00 00 00 00 00 00 00
  0x0ff4dbc38030: 00 00 00 00 00 00 00 00 00 00 00 00 00 00 00 00
  0x0ff4dbc38040: 00 00 00 00 00 00 00 00 00 00 00 00 00 00 00 00
  0x0ff4dbc38050: 00 00 00 00 00 00 00 00 00 00 00 00 00 00 00 00
......
注:运行时,启用ASAN_OPTIONS=detect_stack_use_after_return=1标志,才能检测此种内存错误使用的情况。
5
使用退出作用域的变量
测试代码:
[root@yglocal asan_test]# vi use-after-scope.c
#include <stdio.h>
#include <stdlib.h>
#include <string.h>
int main()
{
int *p;
{
int num = 10;
p = #
}
printf("%d/n", *p);
return 0;
}
编译并运行:
[root@yglocal asan_test]# ./use-after-scope
=================================================================
==45490==ERROR: AddressSanitizer: stack-use-after-scope on address 0x7fffda668b50 at pc 0x0000004009ea bp 0x7fffda668b10 sp 0x7fffda668b00
READ of size 4 at 0x7fffda668b50 thread T0
    #0 0x4009e9 in main (/root/asan_test/use-after-scope+0x4009e9)
    #1 0x7fc2194ca872 in __libc_start_main (/lib64/libc.so.6+0x23872)
    #2 0x40082d in _start (/root/asan_test/use-after-scope+0x40082d)

Address 0x7fffda668b50 is located in stack of thread T0 at offset 32 in frame
    #0 0x4008f5 in main (/root/asan_test/use-after-scope+0x4008f5)

  This frame has 1 object(s):
    [32, 36) 'num' <== Memory access at offset 32 is inside this variable
HINT: this may be a false positive if your program uses some custom stack unwind mechanism or swapcontext
      (longjmp and C++ exceptions *are* supported)
SUMMARY: AddressSanitizer: stack-use-after-scope (/root/asan_test/use-after-scope+0x4009e9) in main
Shadow bytes around the buggy address:
  0x10007b4c5110: 00 00 00 00 00 00 00 00 00 00 00 00 00 00 00 00
  0x10007b4c5120: 00 00 00 00 00 00 00 00 00 00 00 00 00 00 00 00
  0x10007b4c5130: 00 00 00 00 00 00 00 00 00 00 00 00 00 00 00 00
  0x10007b4c5140: 00 00 00 00 00 00 00 00 00 00 00 00 00 00 00 00
  0x10007b4c5150: 00 00 00 00 00 00 00 00 00 00 00 00 00 00 00 00
=>0x10007b4c5160: 00 00 00 00 00 00 f1 f1 f1 f1[f8]f2 f2 f2 f3 f3
  0x10007b4c5170: f3 f3 00 00 00 00 00 00 00 00 00 00 00 00 00 00
  0x10007b4c5180: 00 00 00 00 00 00 00 00 00 00 00 00 00 00 00 00
  0x10007b4c5190: 00 00 00 00 00 00 00 00 00 00 00 00 00 00 00 00
  0x10007b4c51a0: 00 00 00 00 00 00 00 00 00 00 00 00 00 00 00 00
  0x10007b4c51b0: 00 00 00 00 00 00 00 00 00 00 00 00 00 00 00 00
......
[root@yglocal asan_test]#
6
重复释放
[root@yglocal asan_test]# vi invalid_free_test.c

#include <stdio.h>
#include <stdlib.h>

int main()
{
        char *p = (char*)malloc(32*sizeof(char));
        free(p);
        free(p);

        return 0;
}
运行并编译:
[root@yglocal asan_test]# gcc -fsanitize=address -fno-omit-frame-pointer -o invalid_free_test invalid_free_test.c
[root@yglocal asan_test]# ./invalid_free_test
=================================================================
==116778==ERROR: AddressSanitizer: attempting double-free on 0x603000000010 in thread T0:
    #0 0x7fab036ca7e0 in __interceptor_free (/lib64/libasan.so.5+0xef7e0)
    #1 0x400743 in main (/root/asan_test/invalid_free_test+0x400743)
    #2 0x7fab0323b872 in __libc_start_main (/lib64/libc.so.6+0x23872)
    #3 0x40065d in _start (/root/asan_test/invalid_free_test+0x40065d)

0x603000000010 is located 0 bytes inside of 32-byte region [0x603000000010,0x603000000030)
freed by thread T0 here:
    #0 0x7fab036ca7e0 in __interceptor_free (/lib64/libasan.so.5+0xef7e0)
    #1 0x400737 in main (/root/asan_test/invalid_free_test+0x400737)
    #2 0x7fab0323b872 in __libc_start_main (/lib64/libc.so.6+0x23872)

previously allocated by thread T0 here:
    #0 0x7fab036caba8 in __interceptor_malloc (/lib64/libasan.so.5+0xefba8)
    #1 0x400727 in main (/root/asan_test/invalid_free_test+0x400727)
    #2 0x7fab0323b872 in __libc_start_main (/lib64/libc.so.6+0x23872)

SUMMARY: AddressSanitizer: double-free (/lib64/libasan.so.5+0xef7e0) in __interceptor_free
==116778==ABORTING
7
使用退出作用域的内存
测试代码:
[root@yglocal asan_test]# vi use-after-scope.c
#include <stdio.h>
#include <stdlib.h>
int main()
{
int *p;
{
int num = 10;
p = #
}
printf("%d/n", *p);
return 0;
}
编译并运行:
[root@yglocal asan_test]# gcc -fsanitize=address -fno-omit-frame-pointer -o use-after-scope use-after-scope.c
[root@yglocal asan_test]# ./use-after-scope
=================================================================
==118523==ERROR: AddressSanitizer: stack-use-after-scope on address 0x7ffd35fafc60 at pc 0x0000004009ea bp 0x7ffd35fafc20 sp 0x7ffd35fafc10
READ of size 4 at 0x7ffd35fafc60 thread T0
    #0 0x4009e9 in main (/root/asan_test/use-after-scope+0x4009e9)
    #1 0x7f6d2c4ce872 in __libc_start_main (/lib64/libc.so.6+0x23872)
    #2 0x40082d in _start (/root/asan_test/use-after-scope+0x40082d)

Address 0x7ffd35fafc60 is located in stack of thread T0 at offset 32 in frame
    #0 0x4008f5 in main (/root/asan_test/use-after-scope+0x4008f5)

  This frame has 1 object(s):
    [32, 36) 'num' <== Memory access at offset 32 is inside this variable
HINT: this may be a false positive if your program uses some custom stack unwind mechanism or swapcontext
      (longjmp and C++ exceptions *are* supported)
SUMMARY: AddressSanitizer: stack-use-after-scope (/root/asan_test/use-after-scope+0x4009e9) in main
Shadow bytes around the buggy address:
  0x100026bedf30: 00 00 00 00 00 00 00 00 00 00 00 00 00 00 00 00
  0x100026bedf40: 00 00 00 00 00 00 00 00 00 00 00 00 00 00 00 00
  0x100026bedf50: 00 00 00 00 00 00 00 00 00 00 00 00 00 00 00 00
  0x100026bedf60: 00 00 00 00 00 00 00 00 00 00 00 00 00 00 00 00
  0x100026bedf70: 00 00 00 00 00 00 00 00 00 00 00 00 00 00 00 00
=>0x100026bedf80: 00 00 00 00 00 00 00 00 f1 f1 f1 f1[f8]f2 f2 f2
  0x100026bedf90: f3 f3 f3 f3 00 00 00 00 00 00 00 00 00 00 00 00
  0x100026bedfa0: 00 00 00 00 00 00 00 00 00 00 00 00 00 00 00 00
  0x100026bedfb0: 00 00 00 00 00 00 00 00 00 00 00 00 00 00 00 00
  0x100026bedfc0: 00 00 00 00 00 00 00 00 00 00 00 00 00 00 00 00
  0x100026bedfd0: 00 00 00 00 00 00 00 00 00 00 00 00 00 00 00 00
......
8
内存泄露检测
测试代码:
[root@yglocal asan_test]# vi memory_leak_test.c


#include <stdio.h>
#include <stdlib.h>
#include <string.h>

char* get_systeminfo()
{
        char *p_system = (char*)malloc(38*sizeof(char));
        strcpy(p_system, "Linux version 4.18.0-147.el8.x86_64");
        return p_system;
}

int main()
{
        printf("system info:%s", get_systeminfo());
        return 0;
}
编译并运行:
[root@yglocal asan_test]# gcc -fsanitize=address -fno-omit-frame-pointer -o memory_leak_test memory_leak_test.c
[root@yglocal asan_test]# ASAN_OPTIONS=detect_leaks=1  ./memory_leak_test

=================================================================
==122316==ERROR: LeakSanitizer: detected memory leaks

Direct leak of 38 byte(s) in 1 object(s) allocated from:
    #0 0x7fde593f3ba8 in __interceptor_malloc (/lib64/libasan.so.5+0xefba8)
    #1 0x400827 in get_systeminfo (/root/asan_test/memory_leak_test+0x400827)
    #2 0x400855 in main (/root/asan_test/memory_leak_test+0x400855)
    #3 0x7fde58f64872 in __libc_start_main (/lib64/libc.so.6+0x23872)

SUMMARY: AddressSanitizer: 38 byte(s) leaked in 1 allocation(s).
注:内存泄漏检测时,需带上ASAN_OPTIONS=detect_leaks=1参数启程序。
四
ASan输出格式优化
1
使用ASAN_OPTIONS参数启动程序
ASAN_OPTIONS='stack_trace_format="[frame=%n, function=%f, location=%S]"'参数启动程序
[root@yglocal asan_test]# ASAN_OPTIONS='stack_trace_format="[frame=%n, function=%f, location=%S]"' ./heap_ovf_test
=================================================================
==31061==ERROR: AddressSanitizer: heap-use-after-free on address 0x603000000010 at pc 0x7f181e836796 bp 0x7ffd87d62c30 sp 0x7ffd87d623a8
READ of size 2 at 0x603000000010 thread T0
[frame=0, function=<null>, location=<null>]
[frame=1, function=__interceptor_vprintf, location=<null>]
[frame=2, function=__interceptor_printf, location=<null>]
[frame=3, function=main, location=<null>]
[frame=4, function=__libc_start_main, location=<null>]
[frame=5, function=_start, location=<null>]

0x603000000010 is located 0 bytes inside of 32-byte region [0x603000000010,0x603000000030)
freed by thread T0 here:
[frame=0, function=__interceptor_free, location=<null>]
[frame=1, function=main, location=<null>]
[frame=2, function=__libc_start_main, location=<null>]

previously allocated by thread T0 here:
[frame=0, function=__interceptor_malloc, location=<null>]
[frame=1, function=main, location=<null>]
[frame=2, function=__libc_start_main, location=<null>]

SUMMARY: AddressSanitizer: heap-use-after-free (/lib64/libasan.so.5+0x55795)
Shadow bytes around the buggy address:
  0x0c067fff7fb0: 00 00 00 00 00 00 00 00 00 00 00 00 00 00 00 00
  0x0c067fff7fc0: 00 00 00 00 00 00 00 00 00 00 00 00 00 00 00 00
  0x0c067fff7fd0: 00 00 00 00 00 00 00 00 00 00 00 00 00 00 00 00
  0x0c067fff7fe0: 00 00 00 00 00 00 00 00 00 00 00 00 00 00 00 00
  0x0c067fff7ff0: 00 00 00 00 00 00 00 00 00 00 00 00 00 00 00 00
=>0x0c067fff8000: fa fa[fd]fd fd fd fa fa fa fa fa fa fa fa fa fa
  0x0c067fff8010: fa fa fa fa fa fa fa fa fa fa fa fa fa fa fa fa
  0x0c067fff8020: fa fa fa fa fa fa fa fa fa fa fa fa fa fa fa fa
  0x0c067fff8030: fa fa fa fa fa fa fa fa fa fa fa fa fa fa fa fa
  0x0c067fff8040: fa fa fa fa fa fa fa fa fa fa fa fa fa fa fa fa
  0x0c067fff8050: fa fa fa fa fa fa fa fa fa fa fa fa fa fa fa fa
Shadow byte legend (one shadow byte represents 8 application bytes):
  Addressable:           00
  Partially addressable: 01 02 03 04 05 06 07
  Heap left redzone:       fa
  Freed heap region:       fd
  Stack left redzone:      f1
  Stack mid redzone:       f2
  Stack right redzone:     f3
  Stack after return:      f5
  Stack use after scope:   f8
  Global redzone:          f9
  Global init order:       f6
  Poisoned by user:        f7
  Container overflow:      fc
  Array cookie:            ac
  Intra object redzone:    bb
  ASan internal:           fe
  Left alloca redzone:     ca
  Right alloca redzone:    cb
==31061==ABORTING
2
使用asan_symbolize.py脚本
输出的调用链中信息更精确,可以对应到代码文件的具体某一行:
[root@yglocal asan_test]# gcc -fsanitize=address -fno-omit-frame-pointer -g -o heap_ovf_test heap_ovf_test.c
[root@yglocal asan_test]# ./heap_ovf_test 2>&1 | ./asan_symbolize.py
=================================================================
==66336==ERROR: AddressSanitizer: heap-buffer-overflow on address 0x603000000030 at pc 0x7f0e8b19ea1d bp 0x7ffc0764d8a0 sp 0x7ffc0764d048
WRITE of size 8 at 0x603000000030 thread T0
    #0 0x7f0e8b19ea1c in __interceptor_strpbrk ??:?
    #1 0x400845 in main /root/asan_test/heap_ovf_test.c:9
    #1 0x7f0e8adbe872 in __libc_start_main ??:?
    #2 0x40075d in _start ??:?

0x603000000030 is located 0 bytes to the right of 32-byte region [0x603000000010,0x603000000030)
allocated by thread T0 here:
    #0 0x7f0e8b24dba8 in malloc ??:?
    #1 0x400827 in main /root/asan_test/heap_ovf_test.c:8
    #1 0x7f0e8adbe872 in __libc_start_main ??:?

SUMMARY: AddressSanitizer: heap-buffer-overflow (/lib64/libasan.so.5+0x40a1c)
Shadow bytes around the buggy address:
  0x0c067fff7fb0: 00 00 00 00 00 00 00 00 00 00 00 00 00 00 00 00
  0x0c067fff7fc0: 00 00 00 00 00 00 00 00 00 00 00 00 00 00 00 00
  0x0c067fff7fd0: 00 00 00 00 00 00 00 00 00 00 00 00 00 00 00 00
  0x0c067fff7fe0: 00 00 00 00 00 00 00 00 00 00 00 00 00 00 00 00
  0x0c067fff7ff0: 00 00 00 00 00 00 00 00 00 00 00 00 00 00 00 00
=>0x0c067fff8000: fa fa 00 00 00 00[fa]fa fa fa fa fa fa fa fa fa
  0x0c067fff8010: fa fa fa fa fa fa fa fa fa fa fa fa fa fa fa fa
  0x0c067fff8020: fa fa fa fa fa fa fa fa fa fa fa fa fa fa fa fa
  0x0c067fff8030: fa fa fa fa fa fa fa fa fa fa fa fa fa fa fa fa
  0x0c067fff8040: fa fa fa fa fa fa fa fa fa fa fa fa fa fa fa fa
  0x0c067fff8050: fa fa fa fa fa fa fa fa fa fa fa fa fa fa fa fa
Shadow byte legend (one shadow byte represents 8 application bytes):
  Addressable:           00
  Partially addressable: 01 02 03 04 05 06 07
  Heap left redzone:       fa
  Freed heap region:       fd
  Stack left redzone:      f1
  Stack mid redzone:       f2
  Stack right redzone:     f3
  Stack after return:      f5
  Stack use after scope:   f8
  Global redzone:          f9
  Global init order:       f6
  Poisoned by user:        f7
  Container overflow:      fc
  Array cookie:            ac
  Intra object redzone:    bb
  ASan internal:           fe
  Left alloca redzone:     ca
  Right alloca redzone:    cb
==66336==ABORTING
五
更多配置参数
1
编译参数
2
运行时参数
查看看所有的运行时参数,可以用ASAN_OPTIONS=help=1启动程序,就会输出所有支持的参数标志:
[root@yglocal asan_test]# ASAN_OPTIONS=help=1 ./use-after-scope
Available flags for AddressSanitizer:
        ......
        debug
                - If set, prints some debugging information and does additional checks.
        check_initialization_order
               - If set, attempts to catch initialization order issues.
        replace_str
                - If set, uses custom wrappers and replacements for libc string functions to find more errors.
        replace_intrin
                - If set, uses custom wrappers for memset/memcpy/memmove intrinsics.
        detect_stack_use_after_return
                - Enables stack-use-after-return checking at run-time.
        ......
                - Number of seconds to sleep after AddressSanitizer is initialized. Useful for debugging purposes (e.g. when one needs to attach gdb).
        check_malloc_usable_size
                - Allows the users to work around the bug in Nvidia drivers prior to 295.*.
        unmap_shadow_on_exit
                - If set, explicitly unmaps the (huge) shadow at exit.
        protect_shadow_gap
                - If set, mprotect the shadow gap
        print_stats
                - Print various statistics after printing an error message or if atexit=1.
        print_legend
                - Print the legend for the shadow bytes.
        print_scariness
                - Print the scariness score. Experimental.
        ......
                - If true, ASan tweaks a bunch of other flags (quarantine, redzone, heap poisoning) to reduce memory consumption as much as possible, and restores them to original values when the first instrumented module is loaded into the process. This is mainly intended to be used on Android.
        detect_invalid_pointer_pairs
                - If >= 2, detect operations like <, <=, >, >= and - on invalid pointer pairs (e.g. when pointers belong to different objects); If == 1, detect invalid operations only when both pointers are non-null.
        detect_container_overflow
                - If true, honor the container overflow annotations. See https://github.com/google/sanitizers/wiki/AddressSanitizerContainerOverflow
        detect_odr_violation
                - If >=2, detect violation of One-Definition-Rule (ODR); If ==1, detect ODR-violation only if the two variables have different sizes
        suppressions
                - Suppressions file name.
        halt_on_error
                - Crash the program after printing the first error report (WARNING: USE AT YOUR OWN RISK!)
        use_odr_indicator
                - Use special ODR indicator symbol for ODR violation detection
        allocator_frees_and_returns_null_on_realloc_zero
                - realloc(p, 0) is equivalent to free(p) by default (Same as the POSIX standard). If set to false, realloc(p, 0) will return a pointer to an allocated space which can not be used.
        verify_asan_link_order
                - Check position of ASan runtime in library list (needs to be disabled when other library has to be preloaded system-wide)
        symbolize
                - If set, use the online symbolizer from common sanitizer runtime to turn virtual addresses to file/line locations.
        external_symbolizer_path
                - Path to external symbolizer. If empty, the tool will search $PATH for the symbolizer.
        allow_addr2line
                - If set, allows online symbolizer to run addr2line binary to symbolize stack traces (addr2line will only be used if llvm-symbolizer binary is unavailable.
        strip_path_prefix
                - Strips this prefix from file paths in error reports.
        ......
更详细的使用可以查看参考链接相关页面。
参考链接:https://github.com/google/sanitizers/wiki/AddressSanitizer
--- EOF ---