Pc端的基本Echarts
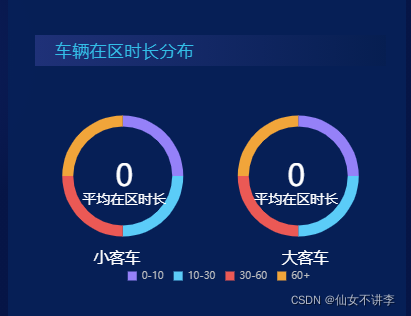
双环传态图组件
<template>
<div class="park-body">
<div class="park-body-title" v-if="piedoubbleData.title">
<p>{{ piedoubbleData.title }}</p>
</div>
<div
ref="piedoubleChart"
:class="className"
:style="{ height: height, width: width, margin: margin }"
/>
<div class="staytime">
<span>{{ piedoubbleData.cartypename[0] }}</span>
<span>{{ piedoubbleData.cartypename[1] }}</span>
</div>
</div>
</template>
<script>
export default {
name: 'plexChart',
props: {
className: {
type: String,
default: 'chart',
},
margin: {
type: String,
default: '0px',
},
width: {
type: String,
default: '100%',
},
height: {
type: String,
default: '220px',
},
piedoubbleData: {
type: Object,
required: true,
},
},
data() {
return {
chart: null,
}
},
watch: {
piedoubbleData: {
deep: true,
handler(val) {
this.setOptions(val, this.piedoubbleData)
},
},
},
mounted() {
this.$nextTick(() => {
this.initChart()
})
},
beforeDestroy() {
if (!this.chart) {
return
}
this.chart.dispose()
this.chart = null
},
methods: {
initChart() {
this.chart = this.$echarts.init(this.$refs.piedoubleChart, 'macarons')
this.setOptions(this.piedoubbleData)
},
setOptions({ names, carSeriesData, busSeriesData, avgBus, avgCar } = {}) {
this.chart.setOption({
legend: {
orient: 'horizontal',
left: '25%',
bottom: '0%',
icon: 'rect',
itemWidth: 9,
itemHeight: 9,
data: names,
textStyle: {
color: '#BDBEBF',
fontSize: 10,
},
},
grid: {
show: false,
left: 'left',
},
title: [
{
text: '{a|' + avgCar + '}\n{b|平均在区时长}',
textStyle: {
rich: {
a: {
color: '#FFFFFF',
fontSize: 30,
},
b: {
color: '#FFFFFF',
fontSize: 14,
},
},
},
textAlign: 'center',
left: '24%',
top: '42%',
},
{
text: '{a|' + avgBus + '}\n{b|平均在区时长}',
textStyle: {
rich: {
a: {
color: '#FFFFFF',
fontSize: 30,
},
b: {
color: '#FFFFFF',
fontSize: 14,
},
},
},
textAlign: 'center',
left: '73%',
top: '42%',
},
],
series: [
{
name: '大客车',
color: ['#9581F8', '#5BCCF8', '#EB5955', '#F1A53A'],
type: 'pie',
center: ['25%', '50%'],
radius: ['45%', '55%'],
avoidLabelOverlap: true,
legendHoverLink: true,
label: {
show: false,
},
labelLine: {
show: false,
},
data: carSeriesData,
},
{
name: '小客车',
color: ['#9581F8', '#5BCCF8', '#EB5955', '#F1A53A'],
type: 'pie',
center: ['75%', '50%'],
radius: ['45%', '55%'],
avoidLabelOverlap: true,
legendHoverLink: true,
label: {
show: false,
},
labelLine: {
show: false,
},
data: busSeriesData,
},
],
tooltip: {
show: true,
formatter: function(params) {
return names[params.dataIndex] + '分钟:' + params.value
},
},
animationDuration: 2000,
})
},
},
}
</script>
<style scoped lang="scss">
.park-body {
width: 100%;
.staytime {
display: flex;
align-items: center;
justify-content: space-between;
margin-top: -40px;
span {
margin: 0 60px;
font-size: 16px;
}
}
}
</style>
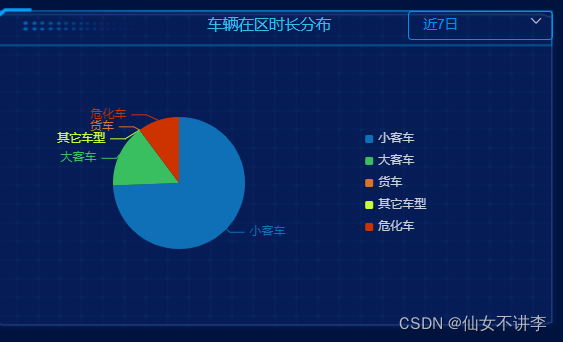
饼状图组件
<template>
<div>
<div
ref="consumePerChart"
:class="className"
:style="{ height: height, width: width, margin: margin }"
/>
</div>
</template>
<script>
export default {
name: 'ConsumePerChart',
components: {},
props: {
className: {
type: String,
default: 'chart',
},
margin: {
type: String,
default: '0px',
},
width: {
type: String,
default: '100%',
},
height: {
type: String,
default: '220px',
},
consumePerData: {
type: Array,
required: true,
},
},
data() {
return {
chart: null,
}
},
watch: {
consumePerData: {
deep: true,
handler(val) {
this.setOptions(val)
},
},
},
mounted() {
this.$nextTick(() => {
this.initChart()
})
},
beforeDestroy() {
if (!this.chart) {
return
}
this.chart.dispose()
this.chart = null
},
methods: {
initChart() {
this.chart = this.$echarts.init(this.$refs.consumePerChart, 'macarons')
this.setOptions(this.consumePerData)
},
setOptions(consumePerData) {
var colorList = ['#0F70B7', '#3ABF60', '#DA732C', '#CCFF33', '#CC3300']
this.chart.setOption({
legend: [
{
selectedMode: false,
orient: 'vertical',
align: 'left',
right: '8%',
bottom: '10%',
itemHeight: 8,
itemWidth: 8,
data: consumePerData,
textStyle: {
fontSize: 12,
padding: [0, 0, 0, 0],
color: '#cad0d7',
},
},
],
tooltip: {
trigger: 'item',
},
series: [
{
data: consumePerData,
hoverAnimation: false,
itemStyle: {
show: false,
normal: {
color: function(params) {
return colorList[params.dataIndex]
},
},
},
labelLine: {
normal: {
length: 5,
},
},
name: '车辆在区时长',
type: 'pie',
radius: '60%',
center: ['40%', '65%'],
},
],
})
},
},
}
</script>
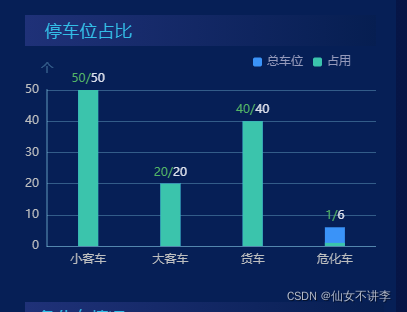
堆叠图组件
<template>
<div class="park-body">
<div class="park-body-title" v-if="plexData.title">
<p>{{ plexData.title }}</p>
</div>
<div
ref="plexChart"
:class="className"
:style="{ height: height, width: width, margin: margin }"
/>
</div>
</template>
<script>
export default {
name: 'plexChart',
props: {
className: {
type: String,
default: 'chart',
},
margin: {
type: String,
default: '0px',
},
width: {
type: String,
default: '100%',
},
height: {
type: String,
default: '220px',
},
plexData: {
type: Object,
required: true,
},
},
data() {
return {
chart: null,
}
},
watch: {
plexData: {
deep: true,
handler(val) {
this.setOptions(val, this.plexData)
},
},
},
mounted() {
this.initChart()
},
beforeDestroy() {
if (!this.chart) {
return
}
this.chart.dispose()
this.chart = null
},
methods: {
initChart() {
this.chart = this.$echarts.init(this.$refs.plexChart, 'macarons')
this.setOptions(this.plexData)
},
setOptions({ xData, numData, totleNumData } = {}) {
this.chart.setOption({
grid: {
bottom: '0%',
top: '20%',
right: '0%',
left: '0%',
containLabel: true,
},
legend: {
selectedMode: false,
orient: 'horizontal',
right: '20',
top: '5',
itemWidth: 9,
itemHeight: 9,
textStyle: {
color: '#959ABB',
fontSize: 12,
},
},
tooltip: {
show: true,
},
xAxis: {
type: 'category',
data: xData,
axisLabel: {
show: true,
color: '#BDBEBF',
},
axisLine: {
show: true,
lineStyle: {
color: 'rgba(154,233,255,0.3)',
width: 1,
},
},
axisTick: {
show: false,
},
splitLine: {
show: false,
},
},
yAxis: {
type: 'value',
name: '个',
axisLabel: {
color: '#BDBEBF',
},
axisLine: {
show: true,
lineStyle: {
color: 'rgba(154,233,255,0.3)',
width: 2,
},
},
axisTick: {
show: false,
},
splitLine: {
show: true,
lineStyle: {
color: 'rgba(154,233,255,0.3)',
width: 1,
},
},
},
series: [
{
name: '总车位',
type: 'bar',
barWidth: 20,
barGap: '-100%',
data: totleNumData,
itemStyle: {
normal: {
color: '#3A93F8',
},
},
hoverAnimation: false,
silent: true,
label: {
show: true,
position: 'top',
formatter: function(params) {
return '{a|' + numData[params.dataIndex] + '/}{b|' + params.value + '}'
},
textStyle: {
rich: {
a: {
color: '#52B566',
fontSize: 12,
},
b: {
color: '#DCE0EB',
fontSize: 12,
},
},
},
},
},
{
name: '占用',
type: 'bar',
barWidth: 20,
data: numData,
itemStyle: {
normal: {
color: '#3BC4AC',
},
},
label: {
show: false,
},
},
],
animationDuration: 2000,
})
},
},
}
</script>
<style scoped lang="scss">
.park-body {
width: 100%;
}
</style>
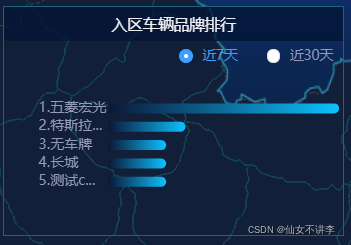
横向排名图
<template>
<div class="park-body">
<div class="park-body-title" v-if="rankData.title">
<p>{{ rankData.title }}</p>
</div>
<div
ref="flowRangkChart"
id="flowRangkChart"
:class="className"
:style="{ height: height, width: width, margin: margin }"
></div>
</div>
</template>
<script>
export default {
name: 'FlowRangkChart',
components: {},
props: {
className: {
type: String,
default: 'chart',
},
margin: {
type: String,
default: '10px',
},
width: {
type: String,
default: '100%',
},
height: {
type: String,
default: '100%',
},
rankData: {
type: Object,
required: true,
},
},
data() {
return {
chart: null,
}
},
watch: {
rankData: {
deep: true,
handler(val) {
this.setOptions(val)
},
},
},
mounted() {
this.initChart()
},
beforeDestroy() {
if (!this.chart) {
return
}
this.chart.dispose()
this.chart = null
},
methods: {
initChart() {
this.chart = this.$echarts.init(this.$refs.flowRangkChart, 'macarons')
this.setOptions(this.rankData)
window.addEventListener('resize', () => {
this.chartPie.resize()
})
},
setOptions({ typeName, countData, colorList } = {}) {
this.chart.setOption({
grid: {
borderWidth: 0,
top: '10%',
left: '22%',
right: '10%',
bottom: '0%',
},
tooltip: {
trigger: 'axis',
axisPointer: {
type: 'none',
},
formatter: function(params) {
var relVal =
"<div style='display:flex;justify-content:space-between;min-width:200px;'><span>" +
params[0].marker +
params[0].name +
'</span><span style="margin-left:20px">' +
params[0].value +
'辆</span></div>'
return relVal
},
},
xAxis: [
{
max: Math.max(...countData),
type: 'value',
show: false,
},
],
yAxis: [
{
inverse: true,
type: 'category',
data: typeName,
splitLine: { show: false },
splitArea: { show: false },
axisTick: {
show: false,
},
axisLine: {
show: false,
},
axisLabel: {
show: true,
color: '#959ABB',
fontSize: 14,
inside: false,
margin: 70,
textStyle: {
align: 'left',
},
formatter: function(params) {
var maxLength = 6
if (params && params.length > maxLength) {
return params.substring(0, maxLength - 1) + '...'
} else {
return params
}
},
},
},
],
color: '#f4a64b',
series: [
{
type: 'bar',
showBackground: true,
roundCap: 12,
backgroundStyle: {
color: 'rgba(8,146,248,0)',
},
barWidth: 10,
label: {
show: false,
position: 'left',
distance: 1,
textStyle: {
color: '#959ABB',
fontSize: 14,
width: '200px',
},
},
itemStyle: {
normal: {
barBorderRadius: [0, 20, 20, 0],
color: new this.$echarts.graphic.LinearGradient(1, 0, 0, 0, colorList),
},
},
data: countData,
},
],
})
},
},
}
</script>
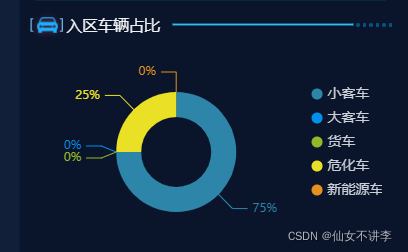
空心圆弧饼状图
<template>
<div
ref="pieChart"
:class="className"
:style="{ height: height, width: width, margin: margin }"
/>
</template>
<script>
export default {
name: 'pieChart',
props: {
className: {
type: String,
default: 'pieChart',
},
margin: {
type: String,
default: '0px',
},
width: {
type: String,
default: '100%',
},
height: {
type: String,
default: '500px',
},
pieData: {
type: Object,
default: () => {},
},
},
data() {
return {
chart: null,
}
},
watch: {
pieData: {
deep: true,
handler(val) {
this.setOptions(val)
},
},
},
mounted() {
this.$nextTick(() => {
this.initChart()
})
},
beforeDestroy() {
if (!this.chart) {
return
}
this.chart.dispose()
this.chart = null
},
methods: {
initChart() {
this.chart = this.$echarts.init(this.$refs.pieChart, 'macarons')
this.setOptions(this.pieData)
},
setOptions({ data, colorList, title, textSize, normalSize, labelLength, xPosition }) {
this.chart.setOption({
title: {
text: title,
textStyle: {
fontSize: textSize,
color: '#CAD0D7',
fontWeight: '400',
},
y: '4%',
x: xPosition || '25%',
},
legend: [
{
icon: 'circle',
selectedMode: false,
orient: 'vertical',
align: 'left',
x: '78%',
y: 'center',
itemHeight: 11,
itemWidth: 11,
data: data,
textStyle: {
fontSize: 14,
padding: [0, 0, 0, 0],
color: '#cad0d7',
},
},
],
series: [
{
type: 'pie',
radius: ['35%', '60%'],
center: ['40%', '55%'],
data: data,
hoverAnimation: false,
label: {
normal: {
fontSize: normalSize,
formatter: '{d}%',
},
},
labelLine: {
normal: {
length: labelLength,
},
},
itemStyle: {
normal: {
color: function(params) {
return colorList[params.dataIndex]
},
},
},
},
],
})
},
},
}
</script>
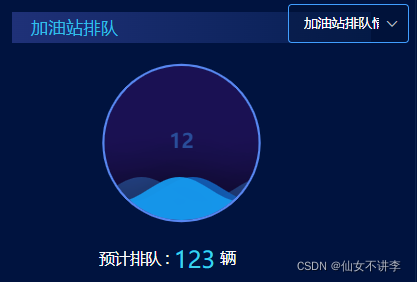
水球波浪图( “echarts-liquidfill”: “^2.0.6”,)
<template>
<div class="park-body">
<div class="park-body-title" v-if="gasData.title">
<p>{{ gasData.title }}</p>
</div>
<div
:class="className"
ref="queueDataChart"
:style="{ height: height, width: width, margin: margin }"
></div>
<div class="prtrol-body-num">
预计排队 :<span>{{ gasData.queueNum }}</span
>辆
</div>
</div>
</template>
<script>
import 'echarts-liquidfill/src/liquidFill.js'
export default {
name: 'FlowRangkChart',
components: {},
props: {
className: {
type: String,
default: 'chart',
},
margin: {
type: String,
default: '-10px',
},
width: {
type: String,
default: '100%',
},
height: {
type: String,
default: '220px',
},
gasData: {
type: Object,
required: true,
},
},
data() {
return {
chart: null,
}
},
watch: {
gasData: {
deep: true,
handler(val) {
this.setOptions(val)
},
},
},
mounted() {
this.$nextTick(() => {
this.initChart()
})
},
beforeDestroy() {
if (!this.chart) {
return
}
this.chart.dispose()
this.chart = null
},
methods: {
initChart() {
this.chart = this.$echarts.init(this.$refs.queueDataChart, 'macarons')
this.setOptions(this.gasData)
},
setOptions({ queuedIndex } = {}) {
this.chart.setOption({
series: [
{
type: 'liquidFill',
radius: '70%',
center: ['50%', '50%'],
data: [queuedIndex, queuedIndex, queuedIndex],
backgroundStyle: {
borderWidth: 1,
color: 'rgb(255,0,255,0.1)',
},
label: {
normal: {
formatter: 12 + '',
textStyle: {
fontSize: 20,
},
},
},
outline: {
show: false,
},
},
{
type: 'pie',
center: ['50%', '50%'],
radius: ['70%', '72%'],
hoverAnimation: false,
data: [
{
name: '',
value: 500,
labelLine: {
show: false,
},
itemStyle: {
color: '#5886f0',
},
emphasis: {
labelLine: {
show: false,
},
itemStyle: {
color: '#5886f0',
},
},
},
],
},
],
tooltip: {
show: true,
},
})
},
},
}
</script>
<style scoped lang="scss">
.prtrol-body-num {
display: flex;
font-size: 16px;
width: 150px;
color: #fbfbfb;
text-align: center;
align-items: center;
margin-left: 90px;
span {
font-size: 24px;
color: #3bd2ef;
margin: 0 5px;
}
}
</style>
使用:
 <gas-line-chart :gas-data="gasLineData"></gas-line-chart>
  gasLineData: {
        title: '加油站排队',
        queuedIndex: 0.2,
        queueNum: '123',
      },
本文内容由网友自发贡献,版权归原作者所有,本站不承担相应法律责任。如您发现有涉嫌抄袭侵权的内容,请联系:hwhale#tublm.com(使用前将#替换为@)