目录
influxdb+grafana安装
influxdb+grafana启动
JMeter性能数据写入influxdb
JMeter-后端监听器
grafana配置
influxdb+grafana安装
yum install influxdb-1.7.0.x86_64.rpm
yum install grafana-7.4.3-1.x86_64.rpm
influxdb+grafana启动
#启动命令

influxd

#守护进程启动命令
nohup influxd &

#启动grafana
systemctl restart grafana-server
启动成功后,发现使用http协议,并且端口:8086
2022-11-07T16:03:57.271232Z info Listening on HTTP {"log_id": "0e0iBjF0000", "service": "httpd", "addr": "[::]:8086", "https": false}
[root@centos7 upload]# influxd

 8888888           .d888 888                   8888888b.  888888b.
   888            d88P"  888                   888  "Y88b 888  "88b
   888            888    888                   888    888 888  .88P
   888   88888b.  888888 888 888  888 888  888 888    888 8888888K.
   888   888 "88b 888    888 888  888  Y8bd8P' 888    888 888  "Y88b
   888   888  888 888    888 888  888   X88K   888    888 888    888
   888   888  888 888    888 Y88b 888 .d8""8b. 888  .d88P 888   d88P
 8888888 888  888 888    888  "Y88888 888  888 8888888P"  8888888P"

2022-11-07T16:03:57.116329Z     info    InfluxDB starting       {"log_id": "0e0iBjF0000", "version": "1.7.0", "branch": "1                                                                                          .7", "commit": "dac4c6f571662c63dc0d73346787b8c7f113222a"}
2022-11-07T16:03:57.116344Z     info    Go runtime      {"log_id": "0e0iBjF0000", "version": "go1.11", "maxprocs": 1}
2022-11-07T16:03:57.270956Z     info    Using data dir  {"log_id": "0e0iBjF0000", "service": "store", "path": "/var/lib/in                                                                                          fluxdb/data"}
2022-11-07T16:03:57.271045Z     info    Compaction settings     {"log_id": "0e0iBjF0000", "service": "store", "max_concurr                                                                                          ent_compactions": 1, "throughput_bytes_per_second": 50331648, "throughput_bytes_per_second_burst": 50331648}
2022-11-07T16:03:57.271055Z     info    Open store (start)      {"log_id": "0e0iBjF0000", "service": "store", "trace_id":                                                                                           "0e0iBjql000", "op_name": "tsdb_open", "op_event": "start"}
2022-11-07T16:03:57.271076Z     info    Open store (end)        {"log_id": "0e0iBjF0000", "service": "store", "trace_id":                                                                                           "0e0iBjql000", "op_name": "tsdb_open", "op_event": "end", "op_elapsed": "0.022ms"}
2022-11-07T16:03:57.271092Z     info    Opened service  {"log_id": "0e0iBjF0000", "service": "subscriber"}
2022-11-07T16:03:57.271097Z     info    Starting monitor service        {"log_id": "0e0iBjF0000", "service": "monitor"}
2022-11-07T16:03:57.271101Z     info    Registered diagnostics client   {"log_id": "0e0iBjF0000", "service": "monitor", "n                                                                                          ame": "build"}
2022-11-07T16:03:57.271105Z     info    Registered diagnostics client   {"log_id": "0e0iBjF0000", "service": "monitor", "n                                                                                          ame": "runtime"}
2022-11-07T16:03:57.271109Z     info    Registered diagnostics client   {"log_id": "0e0iBjF0000", "service": "monitor", "n                                                                                          ame": "network"}
2022-11-07T16:03:57.271115Z     info    Registered diagnostics client   {"log_id": "0e0iBjF0000", "service": "monitor", "n                                                                                          ame": "system"}
2022-11-07T16:03:57.271123Z     info    Starting precreation service    {"log_id": "0e0iBjF0000", "service": "shard-precre                                                                                          ation", "check_interval": "10m", "advance_period": "30m"}
2022-11-07T16:03:57.271129Z     info    Starting snapshot service       {"log_id": "0e0iBjF0000", "service": "snapshot"}
2022-11-07T16:03:57.271134Z     info    Starting continuous query service       {"log_id": "0e0iBjF0000", "service": "cont                                                                                          inuous_querier"}
2022-11-07T16:03:57.271139Z     info    Starting HTTP service   {"log_id": "0e0iBjF0000", "service": "httpd", "authenticat                                                                                          ion": false}
2022-11-07T16:03:57.271144Z     info    opened HTTP access log  {"log_id": "0e0iBjF0000", "service": "httpd", "path": "std                                                                                          err"}
2022-11-07T16:03:57.271232Z     info    Listening on HTTP       {"log_id": "0e0iBjF0000", "service": "httpd", "addr": "[::                                                                                          ]:8086", "https": false}
2022-11-07T16:03:57.271245Z     info    Starting retention policy enforcement service   {"log_id": "0e0iBjF0000", "service                                                                                          ": "retention", "check_interval": "30m"}
2022-11-07T16:03:57.271420Z     info    Listening for signals   {"log_id": "0e0iBjF0000"}
2022-11-07T16:03:57.271688Z     info    Storing statistics      {"log_id": "0e0iBjF0000", "service": "monitor", "db_instan                                                                                          ce": "_internal", "db_rp": "monitor", "interval": "10s"}
2022-11-07T16:03:57.271806Z     info    Sending usage statistics to usage.influxdata.com        {"log_id": "0e0iBjF0000"}
使用nohup命令后,查询一下linux后台是否有influxdb运行起来
[root@centos7 influxdb]# ps -ef |grep influxdb
root      8332  1436  0 00:31 pts/0    00:00:00 grep --color=auto influxdb
连接influxdb数据库命令&查询数据库&创建数据库&查看有哪些表
#连接数据库命令
influx

#查询influxdb下的数据库有哪些
show databases
-----------------
name: databases
name
----
_internal

#创建数据库命令
create database "jmeter"

#使用指定的数据库
> use jmeter
Using database jmeter

#查看当前使用的数据库中的表有哪些
> show measurements
Connected to http://localhost:8086 version 1.7.0
InfluxDB shell version: 1.7.0
Enter an InfluxQL query
检查一下grafana是否有启动起来
[root@centos7 influxdb]# ps -ef |grep grafana
root     16217  1436  0 00:50 pts/0    00:00:00 grep --color=auto grafana
[root@centos7 influxdb]#

[root@centos7 influxdb]# systemctl restart grafana-server

[root@centos7 influxdb]# ps -ef |grep grafana
grafana  16798     1  9 00:51 ?        00:00:00 /usr/sbin/grafana-server --config=/etc/grafana/grafana.ini --pidfile=/var/run/grafana/grafana-server.pid --packaging=rpm cfg:default.paths.logs=/var/log/grafana cfg:default.paths.data=/var/lib/grafana cfg:default.paths.plugins=/var/lib/grafana/plugins cfg:default.paths.provisioning=/etc/grafana/provisioning
root     16829  1436  0 00:51 pts/0    00:00:00 grep --color=auto grafana
JMeter性能数据写入influxdb
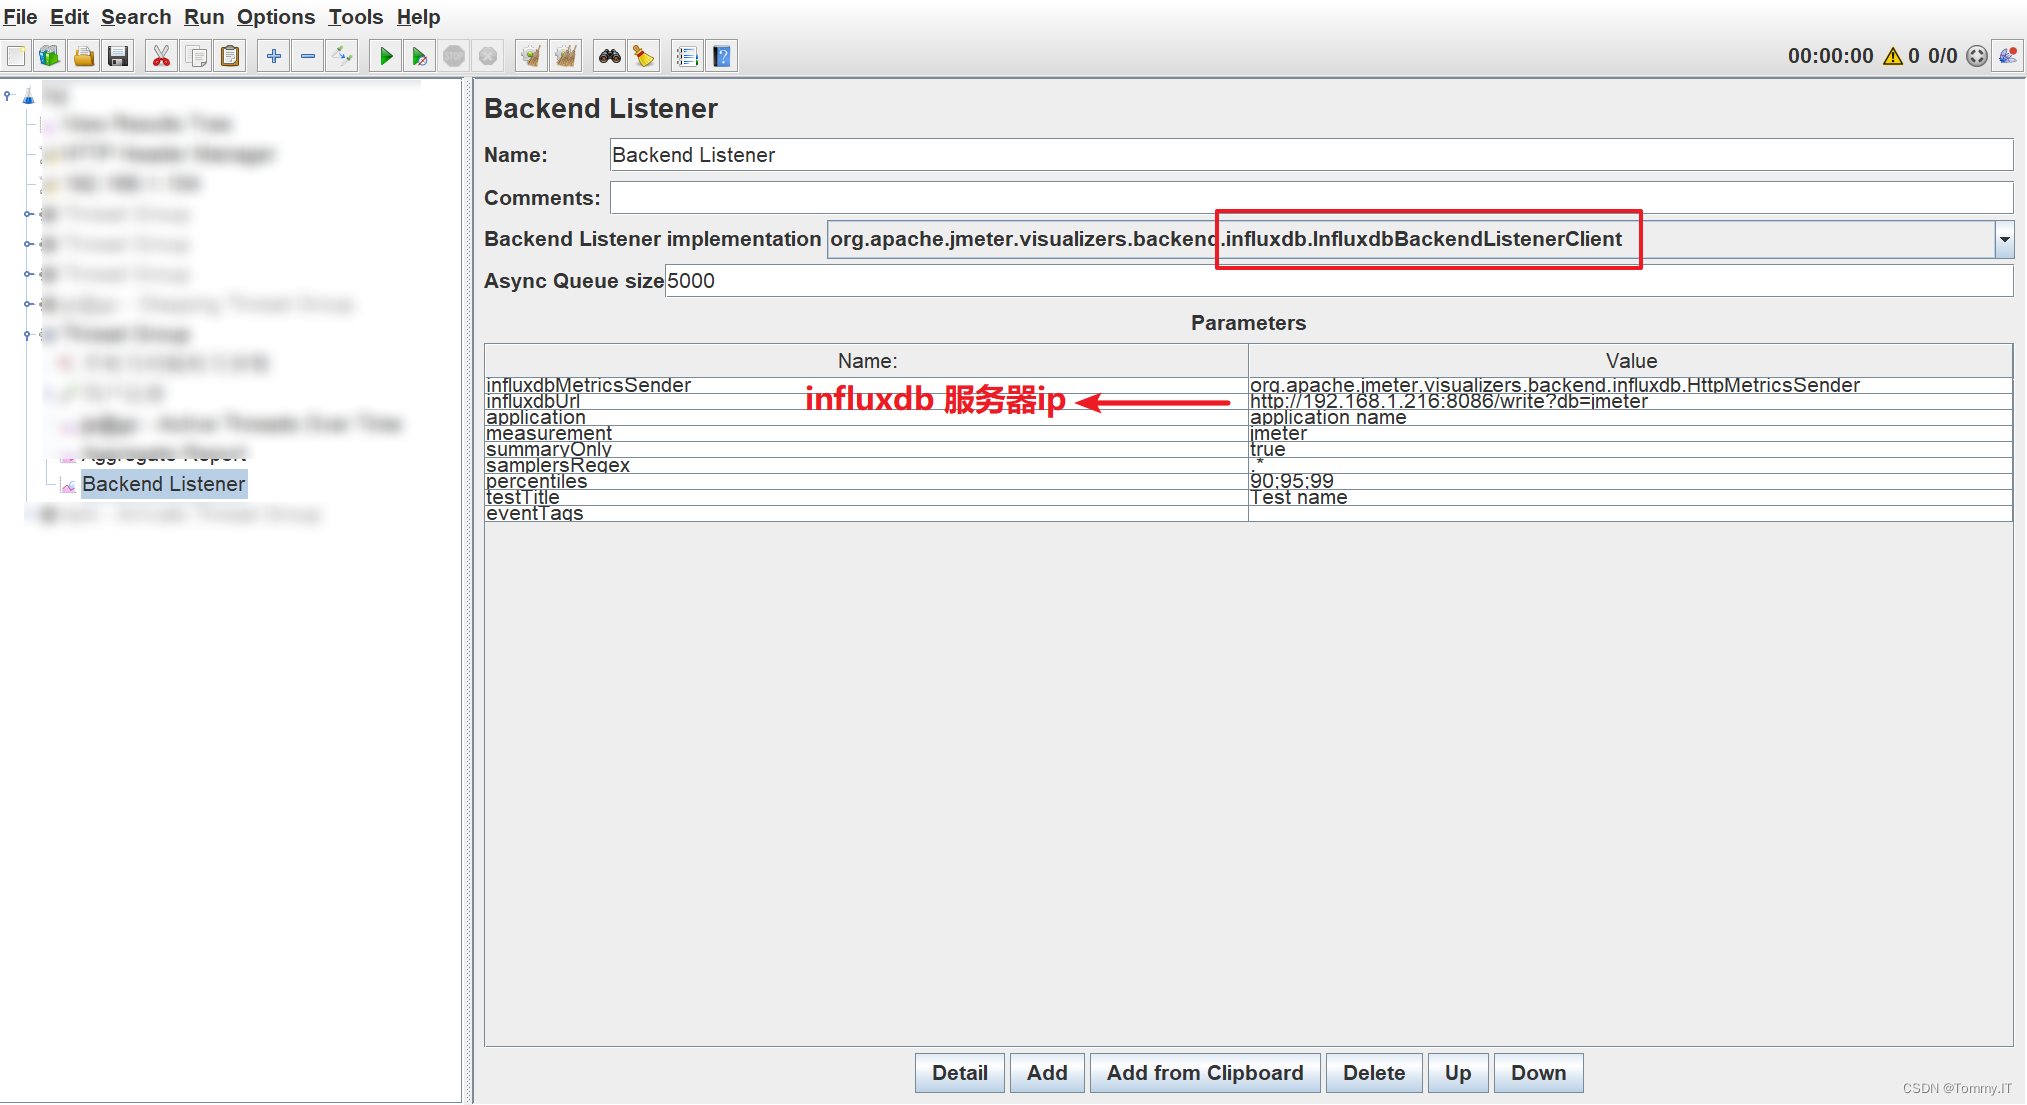
JMeter-后端监听器
| 英文 |
中文 |
路径 |
| Backend Listener |
后端监听器 |
右键一个线程组-Thread Group-Add-Listener-Backend Listener |
Backend Listener implementaition:org.apache.jmeter.visualizers.backend.influxdb.influxdbBackendListenerClient
influxdbUrl:192.168.1.216:8086/write?db=jmeter,db=jmeter 就是influxdb的库名
measurements:jmeter,表的名字,默认
查看influxdb表里面的数据
JMeter测试脚本跑起来,在influxdb服务看看数据里面的数据,原来influxdb的jmeter库里面没有表,当JMeter脚本运行的时候,influxdb会自动创建好表并有数据写入
#查看influxdb数据库
> select * from jmeter
name: jmeter
time application avg count countError endedT hit max maxAT meanAT min minAT pct90.0 pct9 5.0 pct99.0 rb sb startedT statut transaction
---- ----------- --- ----- ---------- ------ --- --- ----- ------ --- ----- ------- ---- --- ------- -- -- -------- ------ -----------
1667840498452000000 application name 0 0 0 0 0 internal
1667840503119000000 application name 85.98113207547169 53 0 53 533 69 78.6 169. 99999999999923 533 17169 19769 all all
1667840503119000000 application name 0 1 1 1 1 internal
1667840508117000000 application name 71.42 70 0 70 87 69 74 76 86.96999999999998 24014 26110 all all
1667840508117000000 application name 0 1 1 1 1 internal
1667840513118000000 application name 71.31 70 0 70 87 68 75 77 86.95999999999998 24984 26110 all all
1667840513118000000 application name 0 1 1 1 1 internal
1667840518118000000 application name 72.06 69 0 69 96 68 78 80.9 4999999999999 96 20788 25737 all all
1667840518118000000 application name 0 1 1 1 1 internal
1667840523117000000 application name 72.25 68 0 68 96 68 79.9 81.9 4999999999999 95.90999999999995 23221 25364 all all
1667840523117000000 application name 0 1 1 1 1 internal
1667840528117000000 application name 71.57 70 0 70 86 68 76 77.9 4999999999999 85.95999999999998 24697 26110 all all
1667840528117000000 application name 0 1 1 1 1 internal
1667840533118000000 application name 71.88 70 0 70 104 68 77 78 103.81999999999991 22440 26110 all all
1667840533118000000 application name 0 1 1 1 1 internal
1667840538119000000 application name 72.21 68 0 68 96 68 79.9 84.8 4999999999997 95.93999999999997 22255 25364 all all
1667840538119000000 application name 0 1 1 1 1 internal
1667840543118000000 application name 72.16 69 0 69 95 68 79 81.9 4999999999999 94.94999999999997 23476 25737 all all
1667840543118000000 application name 0 1 1 1 1 internal
1667840548119000000 application name 70.92 71 0 71 81 68 74 76.9 4999999999999 81 24273 26483 all all
1667840548119000000 application name 0 1 1 1 1 internal
1667840553118000000 application name 72.34 68 0 68 93 68 79.9 85.8 9999999999998 92.99 23857 25364 all all
1667840553118000000 application name 0 1 1 1 1 internal
1667840558119000000 application name 73.06 69 0 69 92 67 82.9 85.8 9999999999998 92 25432 25737 all all
1667840558119000000 application name 0 1 1 1 1 internal
grafana配置
查看grafana日志,发现端口3000,http协议
http://192.168.1.216:3000/login
#grafana日志存放路径
[root@centos7 var]# cd /var/log
[root@centos7 log]# cd grafana

#实时查看grafana日志信息
[root@centos7 grafana]# tail -f grafana.log
t=2022-11-08T00:51:25+0800 lvl=info msg="Executing migration" logger=migrator id="create cache_data table"
t=2022-11-08T00:51:25+0800 lvl=info msg="Executing migration" logger=migrator id="add unique index cache_data.cache_key"
t=2022-11-08T00:51:25+0800 lvl=info msg="Executing migration" logger=migrator id="create short_url table v1"
t=2022-11-08T00:51:25+0800 lvl=info msg="Executing migration" logger=migrator id="add index short_url.org_id-uid"
t=2022-11-08T00:51:25+0800 lvl=info msg="Created default admin" logger=sqlstore user=admin
t=2022-11-08T00:51:25+0800 lvl=info msg="Created default organization" logger=sqlstore
t=2022-11-08T00:51:25+0800 lvl=info msg="Starting plugin search" logger=plugins
t=2022-11-08T00:51:25+0800 lvl=info msg="Registering plugin" logger=plugins id=input
t=2022-11-08T00:51:25+0800 lvl=info msg="External plugins directory created" logger=plugins directory=/var/lib/grafana/plu                                                                                          gins
t=2022-11-08T00:51:25+0800 lvl=info msg="HTTP Server Listen" logger=http.server address=[::]:3000 protocol=http subUrl= so                                                                                          cket=
成功打开grafana首页,提示一下如果进入不了,要关闭linux的防火墙
/usr/lib/systemd/system/firewalld.service; disabled
Active: inactive (dead)
[root@centos7 grafana]# systemctl status firewalld
● firewalld.service - firewalld - dynamic firewall daemon
   Loaded: loaded (/usr/lib/systemd/system/firewalld.service; disabled; vendor preset: enabled)
   Active: inactive (dead)
     Docs: man:firewalld(1)
[root@centos7 grafana]#
成功打开grafana首页

grafana登录成功
grafana添加第一个数据源

使用influxdb的数据

配置influxdb连接池选项
Query Language:InfluxQL
URL:http://192.168.1.216:8086
Database:jmeter
其他选项保持默认,点击save&test,有显示绿色的条条(Data source is working)就可以了


配置grafana输出的模板
查找模板:Grafana: The open observability platform | Grafana Labs
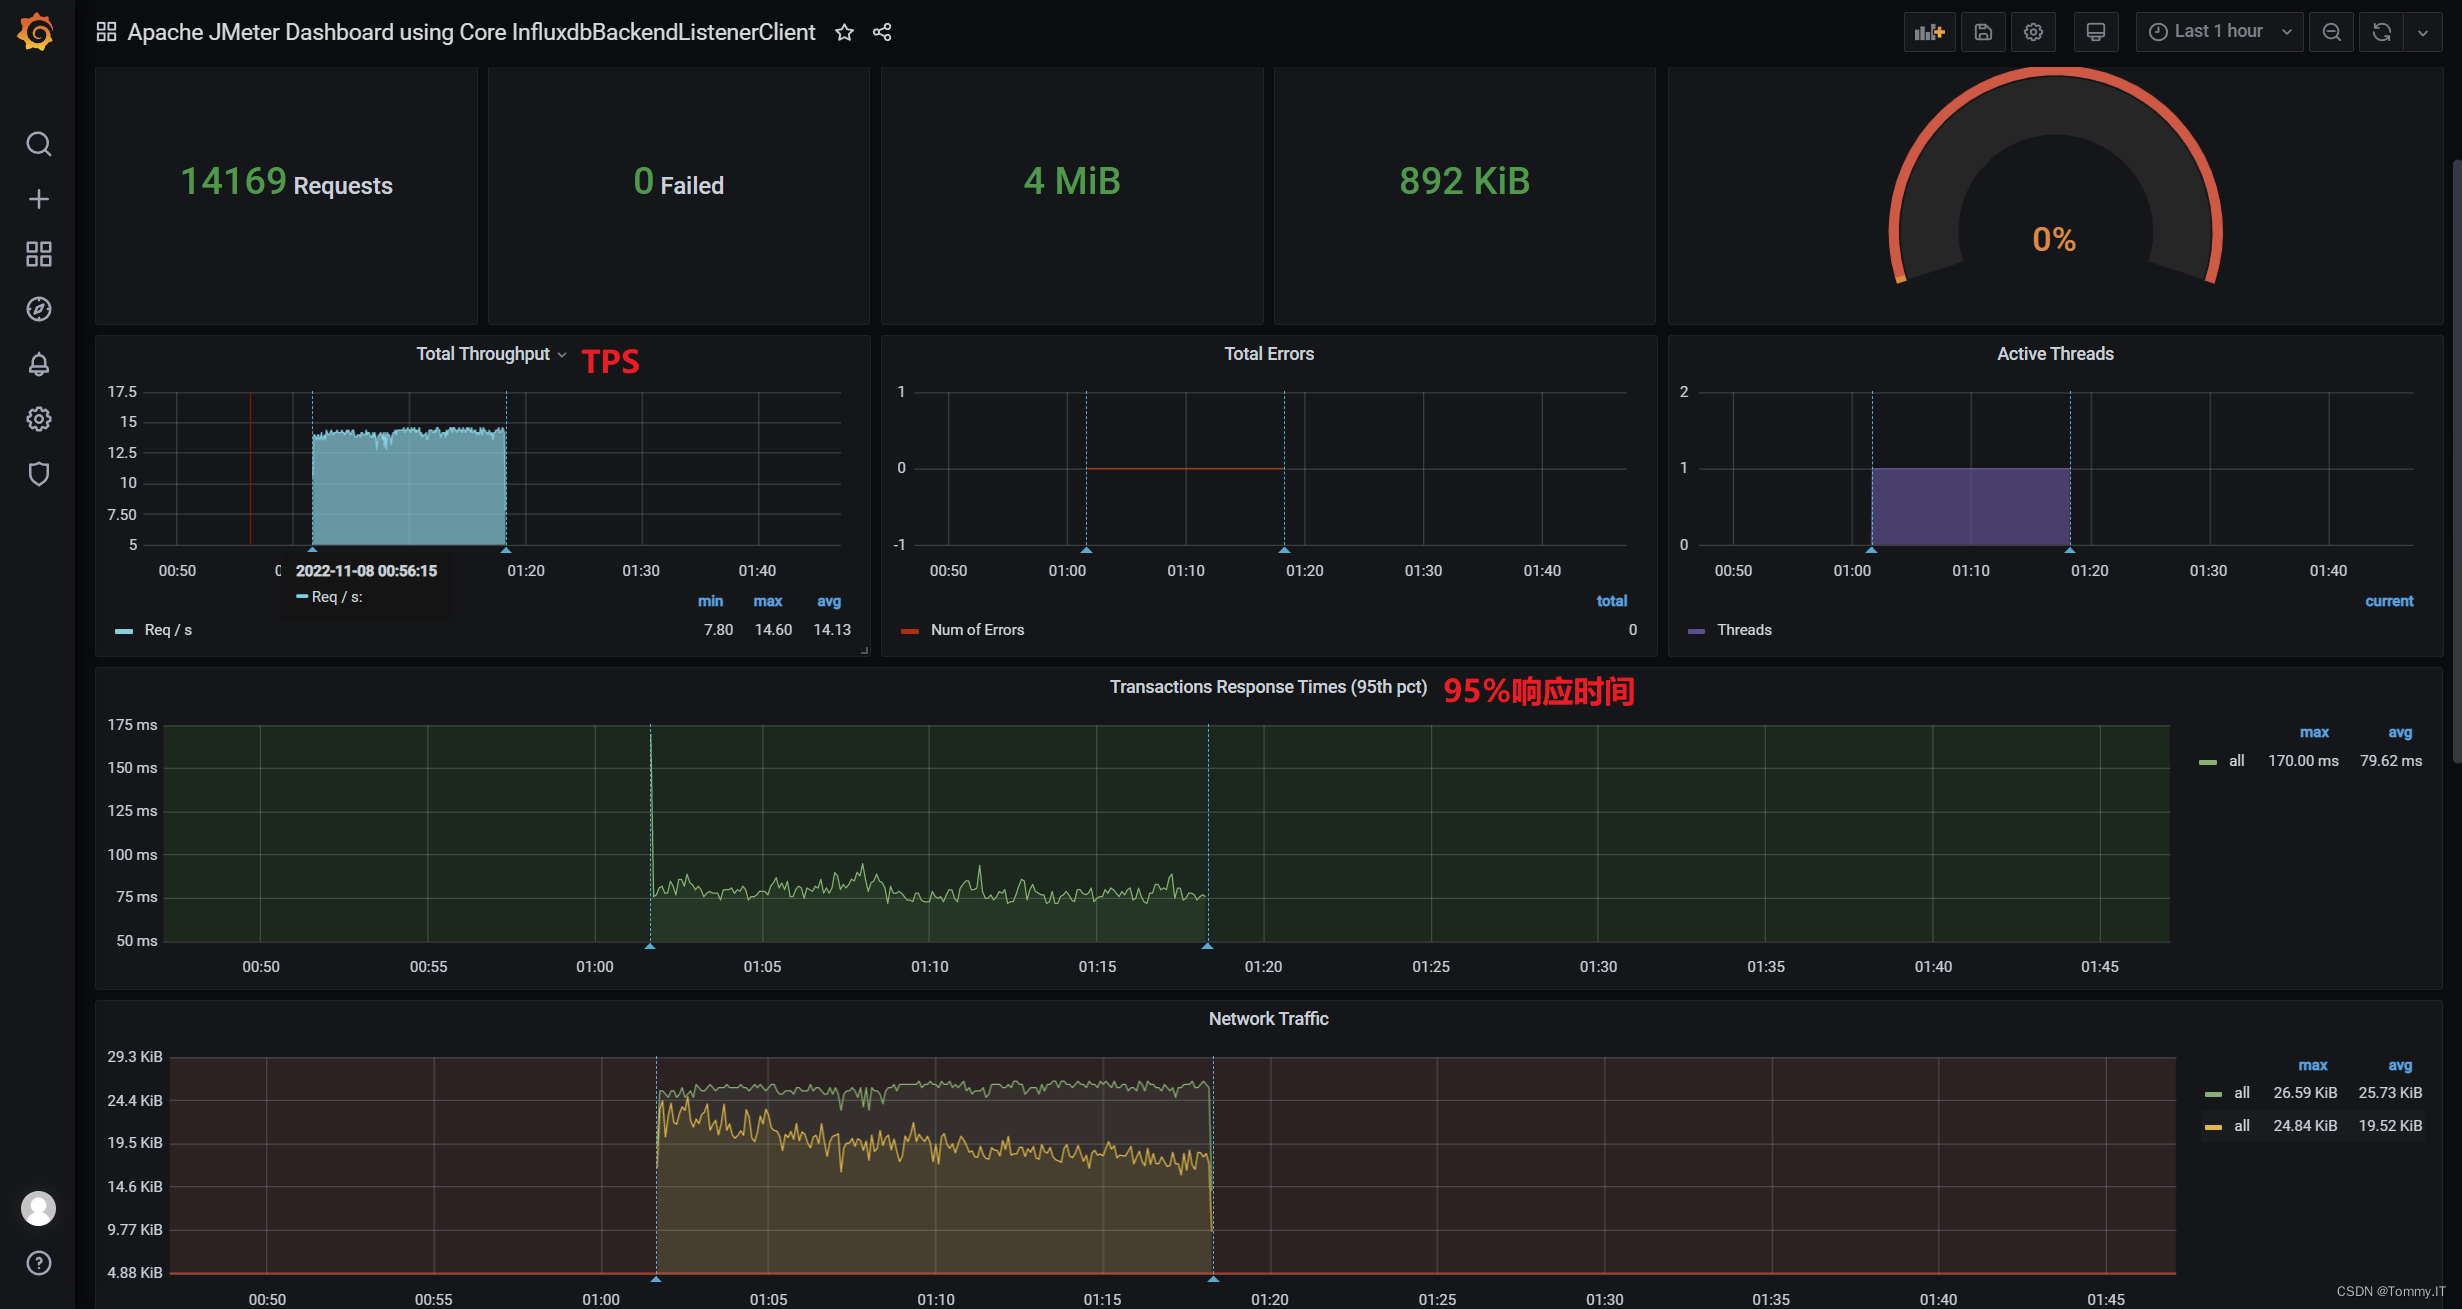
模板ID:5496(Apache JMeter Dashboard using Core InfluxdbBackendListenerClient)点击load

grafana influxdb模板id:5496,可以下载为json,在grafana里面再导入也可以
添加模板页面:数据库名称:influxdb,其他默认,点击import

选择数据面板上面的自动刷新时间,或查看某时间段的数据

grafana数据面板