wxPython是Python语言的一套优秀的GUI图形库。允许Python程序员很方便的创建完整的、功能键全的GUI用户界面。 wxPython是作为优秀的跨平台GUI库wxWidgets的Python封装和Python模块的方式提供给用户的。
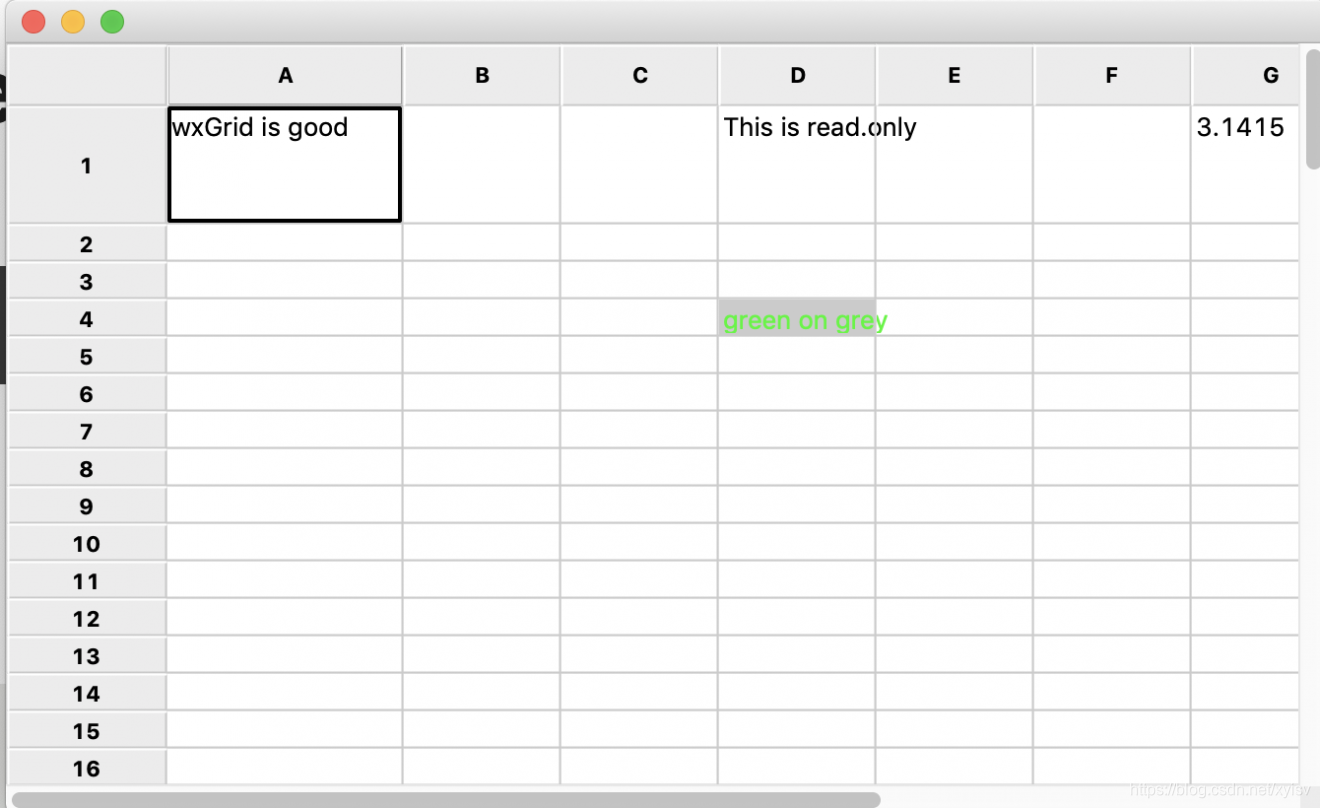
利用wx.grid命令可以画出类似于Excel一样的表格。
grid.SetCellValue用来个表格中的元素赋值。
import wx
import wx.grid


class GridFrame(wx.Frame):
    def __init__(self, parent):
        wx.Frame.__init__(self, parent)

        # Create a wxGrid object
        grid = wx.grid.Grid(self, -1)

        # Then we call CreateGrid to set the dimensions of the grid
        # (100 rows and 10 columns in this example)
        grid.CreateGrid(100, 10)

        # We can set the sizes of individual rows and columns
        # in pixels
        grid.SetRowSize(0, 60)
        grid.SetColSize(0, 120)

        # And set grid cell contents as strings
        grid.SetCellValue(0, 0, 'wxGrid is good')

        # We can specify that some cells are read.only
        grid.SetCellValue(0, 3, 'This is read.only')
        grid.SetReadOnly(0, 3)

        # Colours can be specified for grid cell contents
        grid.SetCellValue(3, 3, 'green on grey')
        grid.SetCellTextColour(3, 3, wx.GREEN)
        grid.SetCellBackgroundColour(3, 3, wx.LIGHT_GREY)

        # We can specify the some cells will store numeric
        # values rather than strings. Here we set grid column 5
        # to hold floating point values displayed with width of 6
        # and precision of 2
        grid.SetColFormatFloat(5, 6, 2)
        grid.SetCellValue(0, 6, '3.1415')

        self.Show()


if __name__ == '__main__':

    app = wx.App(0)
    frame = GridFrame(None)
    app.MainLoop()
本文内容由网友自发贡献,版权归原作者所有,本站不承担相应法律责任。如您发现有涉嫌抄袭侵权的内容,请联系:hwhale#tublm.com(使用前将#替换为@)