Wound induction in the chicken CAM
Chick embryos were cultured for 10 days and CAMs were inflicted by parallel scalpel superficial cuts of 1 cm area, followed with a subsequent scarping off of the epithelium of the injured chorioallantoic membrane. The wound area was then covered with 1.5 cm square nylon grid (figure 1A). As seen in figure 1B, significant GT was formed and grew through the nylon grid in response to injury. This GT contained a significant amount of blood vessels with abnormal morphology (tortuous blood vessels). Newly formed blood vessels within the CAM became functional since injection of Indian ink clearly evidenced newly perfused blood vessels in the GT (figure 1C).
Figure 1
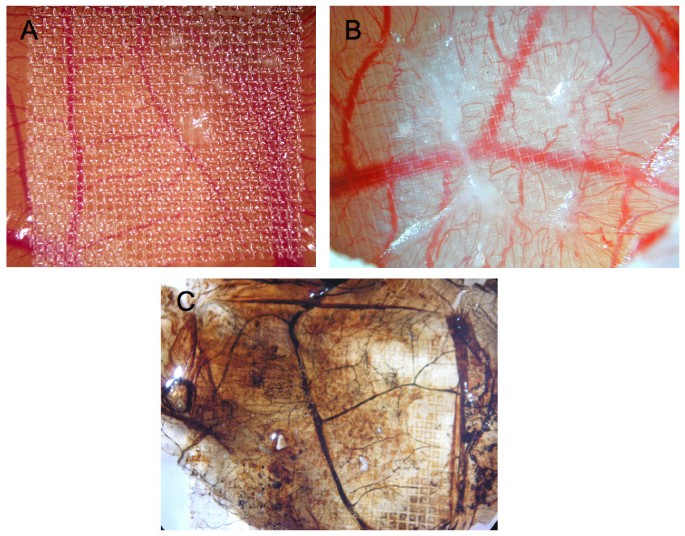
Wound Model of the chicken chorioallantoic membrane. Panels A and B of this figure display granulation tissue 6 days after injury (B is a larger magnification of A). In panel C, also showing granulation tissue 6 days after injury, Indian ink was injected to visualize perfused blood vessels (vessels are now black).
The CAM wound model has been established to analyze GT formation and the role of invading fibroblasts and blood vessels in this process [10]. It has been found that tissue tension generated by activated fibroblasts or myofibroblasts during wound contraction, mediated and directed translocation of the vasculature. This vasculature can be expanded secondarily by elongation and vessel enlargement, and finally, through splitting and sprouting. To verify the presence of myofibroblasts in our experimental set up, we performed immunohistology using anti-α2-somooth muscle actin antibodies. The invasion of α2-smooth muscle (α2-SM) actin positive myofibroblasts and of blood vessels in the wounded area was clearly visible and is depicted in figure 2.
Figure 2
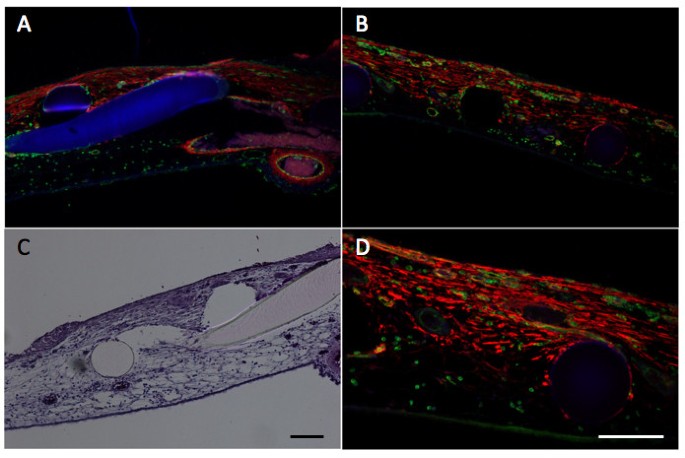
Histology and immunohistology in the wound model.Wounding is performed as indicated in Methods and analyzed by histology and immunohistology. Panel A and B, immunohistological analysis of α2-smooth muscle actin (anti-α2-SM antibody) in red, vessels are stained in green (SNA-isolectin) and nuclei in blue (Dapi) of two different areas of the wounded CAM (10× magnification). Panel C, Hematoxylin-eosin staining (10× magnification. Panel D is a higher magnification (20× magnification) of B. Scale bars, 100 μm. The figure clearly shows the infiltration of a2-SM positive myofibroblasts and of blood vessels in the wounded area. The grid is visible in blue (A), or as black (B,D) and white holes (C) or in rosa (C).
Other chick wound models that have been proposed such as epithelial regeneration models at the surface of the embryo such as at the wing bud or the midbrain region [8, 13, 14]. These models have helped to characterize some of the morphological and molecular events occurring during embryonic tissue repair involving actin cable assembly and the Rho kinases[8, 14]. Tissue wound contraction is present in this model to some extent, however without the presence of α2-SM positive myofibroblasts[8]. Another model is characterized by the removal of only the peridermal layer. Wound closure in this model is essentially driven by the conversion of the basal layer, from monolayer to multilayer [15].
The advantage of our model is that it clearly distinguishes between preexisting and newly formed tissue and vasculature and that an ingrowth of α2-SM actin positive myofibroblasts is observed. Furthermore, recruitment and translocation of the vasculature in the wound area can be clearly envisioned. This allows us to perform transcriptomic analysis after wounding to establish which genes are important players in this process.
Gene signatures in wound tissue by molecular profiling
We therefore extracted RNA from eggs 6 days post-wounding. We also extracted RNA from areas where no injury was inflicted to the CAM from the same eggs. Thus, each wound had a matched control from the same egg and three eggs were used for hybridization on each chip with their own controls (6 samples in total). Data were normalized using the robust multi-averaging method, part of the Affymetrix library in the statistical programming language R. Hierarchical clustering, performed on the three wounded and non-wounded samples, indicated separate clustering of wounded and non-wound CAM tissue (figure 3A). This indicates good quality of the samples collected and of hybridizations. We observed a total of 282 genes up-regulated and 44 genes down-regulated, applying a FDR < 5% and a fold change > 2 (figure 3B).
Figure 3
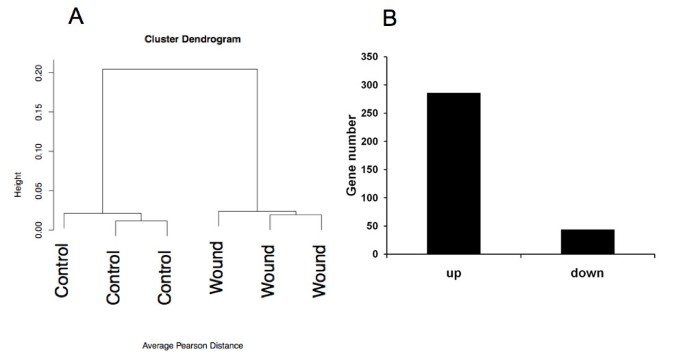
Global analysis of the transcriptomic data. Panel A displays hierarchical clustering of the wounds versus the control microarray results. In panel B, the quantitative representation of up and down-regulated genes in granulation tissue in comparison with control tissue is displayed.
Up-regulation as high as 79 fold was observed. Among the most up-regulated genes, we observed: fatty acid binding protein 4 FABP4 (79 fold), retinol binding protein 7 (RBP7) (74 fold), transthyretin (TTR) (37fold), osteopontin (SPP1) (30 fold), neutrophile cytosolic factor (NCF2) (25 fold), chemokine ah221 (LOC417536) (10 fold) and cysteine-rich secretory protein (CRISP3 (8 fold)) (Table 1). Among the most down-regulated genes, we observed: inter-alpha (globulin) inhibitor H5 (ITIH5) (0.11 fol