   1
   2
   3
   4
   5
   6
   7
   8
   9
  10
  11
  12
  13
  14
  15
  16
  17
  18
  19
  20
  21
  22
  23
  24
  25
  26
  27
  28
  29
  30
  31
  32
  33
  34
  35
  36
  37
  38
  39
  40
  41
  42
  43
  44
  45
  46
  47
  48
  49
  50
  51
  52
  53
  54
  55
  56
  57
  58
  59
  60
  61
  62
  63
  64
  65
  66
  67
  68
  69
  70
  71
  72
  73
  74
  75
  76
  77
  78
  79
  80
  81
  82
  83
  84
  85
  86
  87
  88
  89
  90
  91
  92
  93
  94
  95
  96
  97
  98
  99
100 |
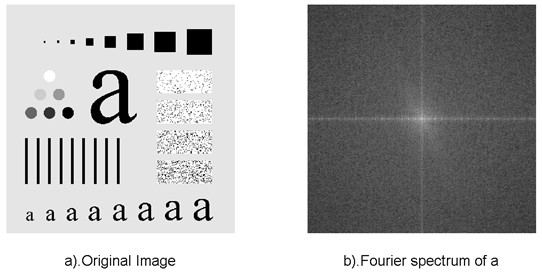
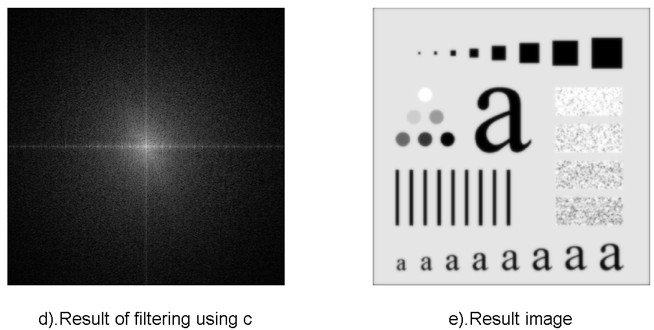
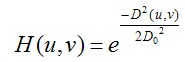
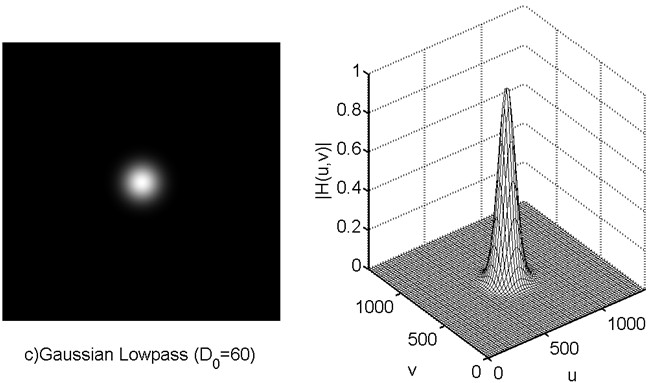
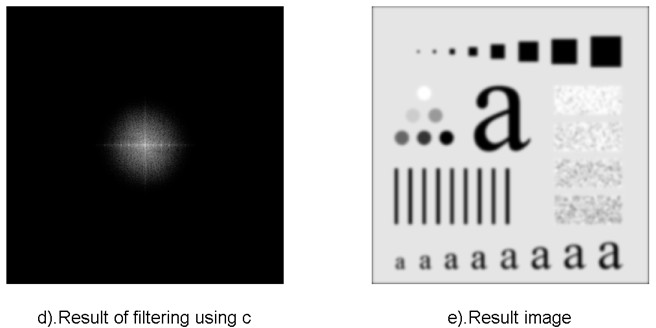
close all; clear all; %% ---------Butterworth Lowpass Filters (Fre. Domain)------------ f = imread('characters_test_pattern.tif'); f = mat2gray(f,[0 255]); [M,N] = size(f); P = 2*M; Q = 2*N; fc = zeros(M,N); for x = 1:1:M for y = 1:1:N fc(x,y) = f(x,y) * (-1)^(x+y); end end F = fft2(fc,P,Q); H_1 = zeros(P,Q); H_2 = zeros(P,Q); for x = (-P/2):1:(P/2)-1 for y = (-Q/2):1:(Q/2)-1 D = (x^2 + y^2)^(0.5); D_0 = 100; H_1(x+(P/2)+1,y+(Q/2)+1) = 1/(1+(D/D_0)^2); H_2(x+(P/2)+1,y+(Q/2)+1) = 1/(1+(D/D_0)^6); end end G_1 = H_1 .* F; G_2 = H_2 .* F; g_1 = real(ifft2(G_1)); g_1 = g_1(1:1:M,1:1:N); g_2 = real(ifft2(G_2)); g_2 = g_2(1:1:M,1:1:N); for x = 1:1:M for y = 1:1:N g_1(x,y) = g_1(x,y) * (-1)^(x+y); g_2(x,y) = g_2(x,y) * (-1)^(x+y); end end %% -----show------- figure(); subplot(1,2,1); imshow(f,[0 1]); xlabel('a).Original Image'); subplot(1,2,2); imshow(log(1 + abs(F)),[ ]); xlabel('b).Fourier spectrum of a'); figure(); subplot(1,2,1); imshow(H_1,[0 1]); xlabel('c)Butterworth Lowpass (D_{0}=100,n=1)'); subplot(1,2,2); h = mesh(1:20:P,1:20:Q,H_1(1:20:P,1:20:Q)); set(h,'EdgeColor','k'); axis([0 P 0 Q 0 1]); xlabel('u');ylabel('v'); zlabel('|H(u,v)|'); figure(); subplot(1,2,1); imshow(log(1 + abs(G_1)),[ ]); xlabel('d).Result of filtering using c'); subplot(1,2,2); imshow(g_1,[0 1]); xlabel('e).Result image'); figure(); subplot(1,2,1); imshow(H_2,[0 1]); xlabel('f).Butterworth Lowpass (D_{0}=100,n=3)'); subplot(1,2,2); h = mesh(1:20:P,1:20:Q,H_2(1:20:P,1:20:Q)); set(h,'EdgeColor','k'); axis([0 P 0 Q 0 1]); xlabel('u');ylabel('v'); zlabel('|H(u,v)|'); figure(); subplot(1,2,1); imshow(log(1 + abs(G_2)),[ ]); xlabel('g).Result of filtering using e'); subplot(1,2,2); imshow(g_2,[0 1]); xlabel('h).Result image'); |
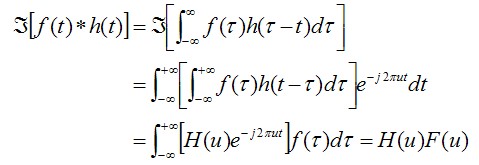
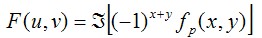
 与
与 卷积的傅里叶变换所得到的结果,是函数
 与
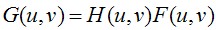
与 的乘积。再将其总结得简单易懂一些,有如下结论。
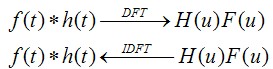


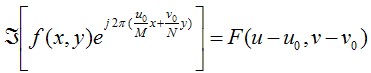
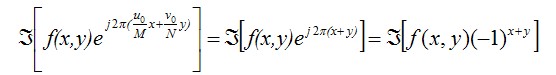
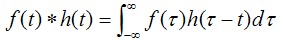
 带入上式,我们可以得到如下式子。