示例来自《Phython机器学习基础教程》
(Introduction to Machine Learning with Python)
[德] Andreas C.Müller [美] Sarah Guido 著 张亮(hysic)译
书上示例代码
import pandas as pd
import mglearn
然而在copy下来在pycharm里运行时发现了各种错误
01
首先是在进行import mglearn时出现的future warning
\anaconda\lib\site-packages\sklearn\externals\six.py:31: FutureWarning: The module is deprecated in version 0.21 and will be removed in version 0.23 since we've dropped support for Python 2.7. Please rely on the official version of six (https://pypi.org/project/six/).
  "(https://pypi.org/project/six/).", FutureWarning)
\anaconda\lib\site-packages\sklearn\externals\joblib\__init__.py:15: FutureWarning: sklearn.externals.joblib is deprecated in 0.21 and will be removed in 0.23. Please import this functionality directly from joblib, which can be installed with: pip install joblib. If this warning is raised when loading pickled models, you may need to re-serialize those models with scikit-learn 0.21+.
  warnings.warn(msg, category=FutureWarning)
反正大意是说“版本将会有变动你这个代码可能在新版本python下搞不好啦”之类的,忽视就行。
02
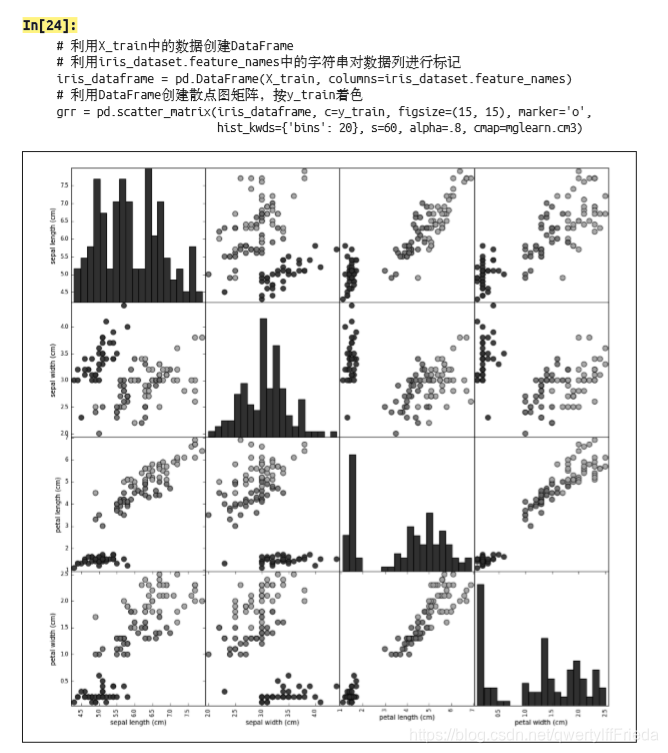
grr = pd.plotting.scatter_matrix(iris_dataFrame, c=y_train, figsize=(15, 15), marker=‘o’,
hist_kwds={‘bins’: 20}, s=60, alpha=.8, cmap=mglearn.cm3)
貌似2019年以后,pandas中的pd.scatter_matrix()调用不可行,变成了pd.plotting.scatter_matrix()来调用
03
如何显示??
为啥我什么都搞好了就是没有图呢?
最后发现需要一个plt.show()
plt又是什么?
需要导入一个包import matplotlib as plt
完整代码
import pandas as pd
import matplotlib.pyplot as plt
import mglearn
from sklearn.model_selection import train_test_split
from sklearn.datasets import load_iris
iris_dataset = load_iris()
'''
Target:
[0 0 0 0 0 0 0 0 0 0 0 0 0 0 0 0 0 0 0 0 0 0 0 0 0 0 0 0 0 0 0 0 0 0 0 0 0
0 0 0 0 0 0 0 0 0 0 0 0 0 1 1 1 1 1 1 1 1 1 1 1 1 1 1 1 1 1 1 1 1 1 1 1 1
1 1 1 1 1 1 1 1 1 1 1 1 1 1 1 1 1 1 1 1 1 1 1 1 1 1 2 2 2 2 2 2 2 2 2 2 2
2 2 2 2 2 2 2 2 2 2 2 2 2 2 2 2 2 2 2 2 2 2 2 2 2 2 2 2 2 2 2 2 2 2 2 2 2
2 2]
'''
X_train, X_test, y_train, y_test = train_test_split(
iris_dataset['data'],iris_dataset['target'], random_state=0
)
iris_dataFrame = pd.DataFrame(X_train, columns=iris_dataset.feature_names)
display(iris_dataFrame)
grr = pd.plotting.scatter_matrix(iris_dataFrame, c=y_train, figsize=(15, 15), marker='o',
hist_kwds={'bins': 20}, s=60, alpha=.8, cmap=mglearn.cm3)
plt.show()
from sklearn.neighbors import KNeighborsClassifier
knn = KNeighborsClassifier(n_neighbors=1)
knn.fit(X_train,y_train)
import numpy as np
X_new = np.array([[5, 2.9, 1, 0.2]])
print("X_new.shape: {}".format(X_new.shape))
'''X_new.shape: (1, 4) '''
prediction = knn.predict(X_new)
print("Prediction: \n{}".format(prediction))
print("Prediction target name :\n {}".format(iris_dataset['target_names'][prediction]))
'''
Prediction:
[0]
Prediction target name :
['setosa']
# 预测值为0 ,对应种类为setosa
'''
y_pre = knn.predict(X_test)
corr_rate = np.mean(y_pre == y_test)
print("Test set score : {:.2f}".format(corr_rate))
'''
Test set score : 0.97
'''
本文内容由网友自发贡献,版权归原作者所有,本站不承担相应法律责任。如您发现有涉嫌抄袭侵权的内容,请联系:hwhale#tublm.com(使用前将#替换为@)