isolation forest在MATLAB和python上的简单应用
1 问题描述
数据中的异常值的检测
异常点,也称为离群点。离群点检测算法主要看到了isolation forest算法和local outlier factor(LOF)算法。
LOF算法的具体原理在 LOF离群因子检测算法及python3实现 中讲得很清楚,简单来说就是如果节点距离它周围k个节点的距离很远,他就有可能是离群点。
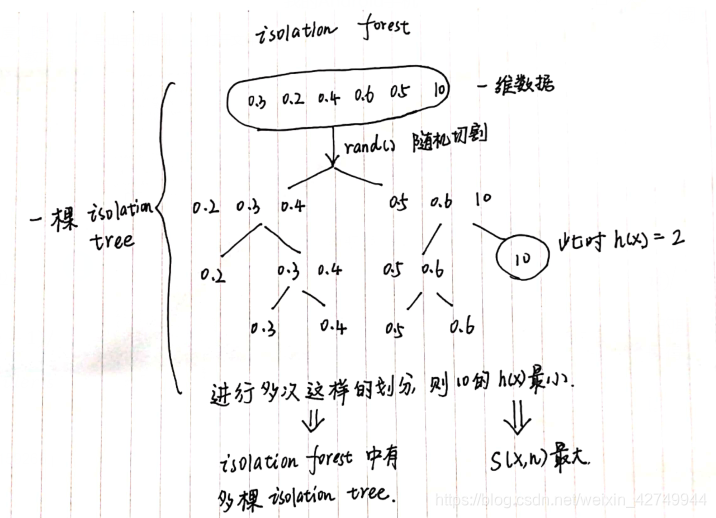
isolation forest算法主要看了 iForest (Isolation Forest)孤立森林 异常检测 入门篇 和 Python机器学习笔记:异常点检测算法——Isolation Forest 两篇文章,简单来说,isolation forest就是把随机选择一个维度,随机生成一个阈值将数据分成两组,一直分下去直到每个组只有一个数据,异常值会比较早被分完。
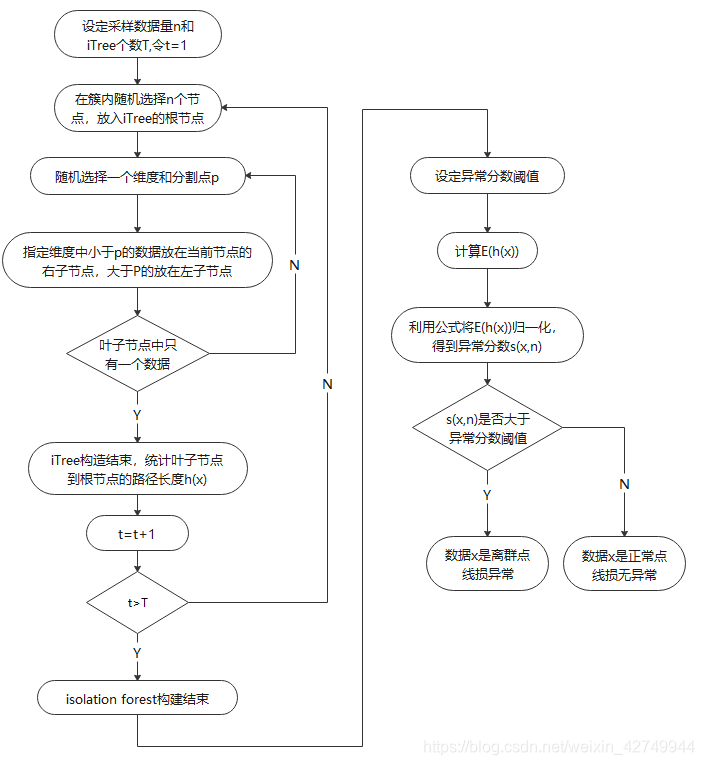
2 isolation forest

其中,E(h(x))是节点x在多棵孤立树上的路径长度h(x)的期望值。c(n)根据二叉搜索树的失败查找的平均搜索长度得到。
s(x,n)就是节点x的异常分数,越大越有可能是异常点。
3 MATLAB实现isolation forest
iForest (Isolation Forest)孤立森林 异常检测 入门篇的作者提供了MATLAB语言实现的iForest算法。
输入的数据data=load(‘breastw_683.csv’)最后一列为标签。
Score为节点异常分数,但没有经过归一化,可以在MATLAB里对score进行归一化。
score = mapminmax(Score',0,1)';
4 python实现isolation fores
在网上看到了很多讲sklearn中的isolation和LOF算法的文章,但不太懂python的我都看不懂,这里列出我用到的几个功能。
很多例子为了展示这一算法,首先用numpy生成数据,在里面添加异常,再异常检测。我的数据都是用MATLAB生成的,存在csv里。
// 孤立森林
import numpy as np
from sklearn.ensemble import IsolationFores
import matplotlib.pyplot as plt

#data前两列是数据,第三列是标签
data = np.loadtxt(open("data_919.csv","rb"),delimiter=",",skiprows=0)
#clf就是分类器,采样值设为256,异常概率为0.01
clf = IsolationForest(max_samples=256,contamination=0.01)
#训练分类器
clf.fit(data[:,0:2])
#计算异常分数
score = clf.score_samples(data[:,0:2])
#-------------------------------------结束!!!!!


#----------------画图表示结果---------------------------------------------------------
plt.figure()
#xx,yy就是一些模拟的数据,Z是模拟数据放入分类器里得到的异常分数,contourf就是画等高线图

xx, yy = np.meshgrid(np.linspace(2,10,70),np.linspace(-0.2, 2.7,50))
Z = clf.decision_function(np.c_[xx.ravel(), yy.ravel()])
Z = Z.reshape(xx.shape)
plt.contourf(xx, yy, Z, camp=plt.cm.Blues_r)

#前14个节点是异常值
#r1画被检测出来的异常值,b1画标签为0的值也就是普通点,b2画异常点

r1 = plt.scatter(data[np.argsort(-score)[0:14],0,],data[np.argsort(-score)[0:14],1],
                 c='white',s=100, edgecolor='red')

b1 = plt.scatter(data[np.argwhere(ADLabel==0),0],data[np.argwhere(ADLabel==0),1],
                 c='white',s=20, edgecolor='k')

b2 = plt.scatter(data[np.argwhere(ADLabel==1),0],data[np.argwhere(ADLabel==1),1],
                 c='red',s=20, edgecolor='k')

plt.legend([b1, b2, r1],
           ["regular observations", "abnormal observations","detected outlier"],
           loc="upper left",fontsize=fs-2)

plt.title('Isolation Tree')
plt.xlabel('Gen  power')
plt.ylabel('Line  Loss')
plt.savefig('isolation forest.png', dpi=200,bbox_inches = 'tight')#指定分辨率
plt.show()

5 遇到的问题
异常分类的结果用什么指标评价?
PR、ROC、AUC等分类的指标不是很合适