前言
最近要把饼图改成3d的,原来的echart图做不了,这里推荐一下highcharts
链接:传送门
使用
文档
配置项文档
安装
npm install --save highcharts
使用
在main.js里注册
// 引入charts
import highcharts from 'highcharts';
// 使用3d图还需要引入下面的
import highcharts3d from 'highcharts/highcharts-3d';
// 调用3d图表
highcharts3d(highcharts);
实例
<template>
    <div class="pie" id="3dpie" :options="chartOptions">
    </div>
</template>

<script>
import highChart from 'highcharts';
export default {
    data() {
        return {
            chartOptions: {
                chart: {
                    type: 'pie',
                    options3d: {
                        enabled: true,
                        alpha: 45,
                        beta: 0
                    }
                },
                title: {
                    text: '2014年某网站不同浏览器访问量占比'
                },
                tooltip: {
                    pointFormat: '{series.name}: <b>{point.percentage:.1f}%</b>'
                },
                plotOptions: {
                    pie: {
                        allowPointSelect: true,
                        cursor: 'pointer',
                        depth: 35,
                        dataLabels: {
                            enabled: true,
                            format: '{point.name}'
                        }
                    }
                },
                series: [{
                    type: 'pie',
                    name: '浏览器占比',
                    data: [
                        ['Firefox', 45.0],
                        ['IE', 26.8],
                        {
                            name: 'Chrome',
                            y: 12.8,
                            sliced: true,
                            selected: true
                        },
                        ['Safari', 8.5],
                        ['Opera', 6.2],
                        ['Others', 0.7]
                    ]
                }]
            }
        };
    },
    mounted() {
        highChart.chart('3dpie',this.chartOptions);
    },
    methods: {

    }
};
</script>

<style scoped lang="scss">
.pie{
    width: 100%;
    height: 90%;
    background: #09184F;
}
</style>
效果图:

如果需要从后台获取数据可以这样
<template>
    <div class="pie" id="3dpie" :options="chartOptions">
    </div>
</template>

<script>
import highChart from 'highcharts';
export default {
    data() {
        return {
            chartOptions: {
                chart: {
                    type: 'pie',
                    options3d: {
                        enabled: true,
                        alpha: 45,
                        beta: 0
                    }
                },
                title: '',
                plotOptions: {
                    pie: {
                        allowPointSelect: true,
                        cursor: 'pointer',
                        depth: 35,
                        dataLabels: {
                            enabled: true,
                            format: '{point.name}'
                        }
                    }
                },
                series: [{
                    type: 'pie',
                    data: []
                }]
            }
        };
    },
    mounted() {
        this.init();
    },
    methods: {
        // 初始化饼图
        init() {
            this.$http.post(url,params)
                .then(({data: d}) => {
                    if(d.code == 0) {
                        let res = d.data || [];
                        this.chartOptions.series[0].data = res.map(e => {
                            return [e.inspectionItemName,e.totalNum];
                        });
                        highChart.chart('3dpie',this.chartOptions);
                    }
                });
            window.addEventListener('resize', function() {
                highChart.resize();
            });
        }
    }
};
</script>

<style scoped lang="scss">
.pie{
    width: 100%;
    height: 90%;
    background: #09184F;
}
</style>
其他内容
修改背景色
chart:{
  backgroundColor: '#09184F'
}
tooltip格式化
tooltip: {
     formatter() {
         console.log(this);
         return `
          <div>
          类型: ${this.key}
          <br />
          值:${this.percentage}
          </div>
         `;
     }
 },
当鼠标移入后,会打印出this,看看自己需要什么值,其他属性自行查看文档
去掉右下角的链接
credits: {
     enabled: false
 },
修改label样式
pie: {
     allowPointSelect: true,
     cursor: 'pointer',
     depth: 35,
     dataLabels: {
         enabled: true,
         formatter() {
             console.log(this.point);
             return this.point.name;
         }
     }
 }

修改颜色
chartOptions对象里有一个colors属性,该属性是个数组,用于自定义颜色
colors: ['#3E6FF6','#2BFFDF','#1B2B53','#FFB139','#434348','#7CB5EC','#F7A35C'],
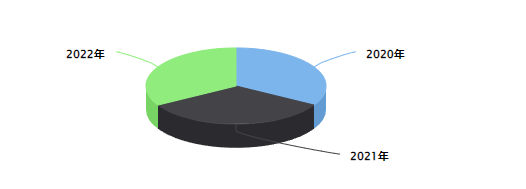
观看饼图的角度
chart: {
    type: 'pie',
    options3d: {
        enabled: true,
        //设置观看的角度
        alpha: 65,
        beta: 0
    }
},
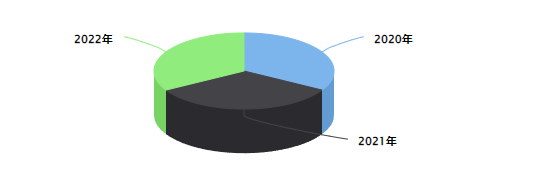
饼图的厚度
plotOptions: {
     pie: {
         allowPointSelect: true,
         cursor: 'pointer',
         //设置饼图厚度
         depth: 65,
         dataLabels: {
             enabled: true,
             format: '{point.name}'
         }
     }
 },
饼图大小
plotOptions: {
     pie: {
         allowPointSelect: true,
         cursor: 'pointer',
         depth: 65,
         dataLabels: {
             enabled: true,
             format: '{point.name}'
         },
         //饼图大小
         size: 300
     }
 },

显示图例
plotOptions: {
     pie: {
         allowPointSelect: true,
         cursor: 'pointer',
         depth: 65,
         dataLabels: {
             enabled: true,
             format: '{point.name}'
         },
         size: 300,
         //显示图例
         showInLegend: true
     }
 },
图例的其他配置看legend选项