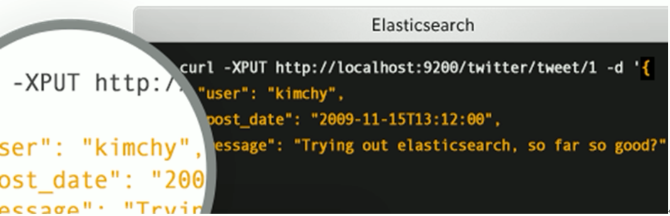
https://www.elastic.co/cn/what-is/elk-stack
通俗来讲, ELK 是由 Elasticsearch、 Logstash、 Kibana 三个开源软件的组成的一个组合体, ELK 是 elastic 公司研发的一套完整的日志收集、 分析和展示的企业级解决方案, 在这三个软件当中, 每个软件用于完成不同的功能, ELK 又称为 ELK stack, 官方域名为 elastic.co, ELK stack 的主要优点有如下几个:
是一个高度可扩展的开源全文搜索和分析引擎, 它可实现数据的实时全文搜索搜索、支持分布式可实现高可用、提供 API 接口,可以处理大规模日志数据,比如 Nginx、 Tomcat、系统日志等功能。
Elasticsearch 使用 Java 语言开发,是建立在全文搜索引擎 Apache Lucene 基础之上的搜索引擎, https://lucene.apache.org/。
Elasticsearch 的特点
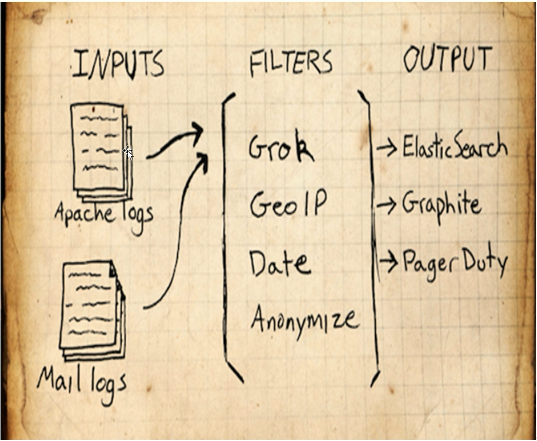
Logstash 是一个具有实时传输能力的数据收集引擎, 其可以通过插件实现日志收集和转发,支持日志过滤,支持普通 log、自定义 json 格式的日志解析,最终把经过处理的日志发送给 elasticsearch。
Kibana 为 elasticsearch 提供一个查看数据的 web 界面,其主要是通过elasticsearch 的 API 接口进行数据查找,并进行前端数据可视化的展现,另外还可以针对特定格式的数据生成相应的表格、柱状图、饼图等。
ELK 组件在海量日志系统的运维中,可用于解决以下主要问题
分布式日志数据统一收集,实现集中式查询和管理
故障排查
安全信息和事件管理
报表功能
ELK 组件在大数据运维系统中,主要可解决的问题如下
使用场景

https://github.com/elastic/elasticsearch #基于 java 开发
最小化安装 Centos 7.x/Ubuntu x86_64 操作系统的虚拟机, vcpu 2, 内存 4G 或更多, 操作系统盘 50G, 主机名设置规则为 linux-hostX.exmaple.com, 其中 host1 和 host2 为elasticsearch 服务器, 为保证效果特额外添加一块单独的数据磁盘大小为 50G 并格式化挂载到/data。
优化系统:(记得关机加磁盘)
[root@es-node1 src]#vim /etc/security/limits.conf
root   soft   core        unlimited
root   hard   core        unlimited
root   soft   nproc       1000000
root   hard   nproc       1000000
root   soft   nofile      1000000
root   hard   nofile      1000000
root   soft   memlock     32000
root   hard   memlock     32000
root   soft   msgqueue    8192000
root   hard   msgqueue    8192000

elasticsearch   soft   core        unlimited
elasticsearch   hard   core        unlimited
elasticsearch   soft   nproc       1000000
elasticsearch   hard   nproc       1000000
elasticsearch   soft   nofile      1000000
elasticsearch   hard   nofile      1000000
elasticsearch   soft   memlock     32000
elasticsearch   hard   memlock     32000
elasticsearch   soft   msgqueue    8192000
elasticsearch   hard   msgqueue    8192000
[root@localhost ~]# hostnamectl set-hostname es-node1.exmaple.com &&
reboot #各服务器配置自己的主机名并重启

[root@es-node1 ~]#mkfs.xfs /dev/sdb
[root@es-node1 ~]#mkdir /data/esdata
#建议使用UUID作为名称替换/dev/sdb去挂载,使用blkid可以查看
[root@es-node1 ~]#echo "/dev/sdb  /data/esdata  xfs  defaults 0 0" >> /etc/fstab
[root@es-node1 ~]#mount -a
[root@es-node1 ~]#df -TH
Filesystem     Type      Size  Used Avail Use% Mounted on
/dev/sdb       xfs       108G  141M  108G   1% /data/esdata
关闭防所有服务器的火墙和 selinux, 包括 web 服务器、 redis 和 logstash 服务器的防火墙和 selinux 全部关闭,此步骤是为了避免出现因为防火墙策略或 selinux 安全权限引起的各种未知问题,以下只显示了 host1 和 host2 的命令, 但是其他服务器都要执行。
[root@es-node1 ~]# systemctl disable firewalld
[root@es-node1 ~]# systemctl disable NetworkManager
[root@es-node1 ~]# sed -i '/SELINUX/s/enforcing/disabled/' /etc/selinux/config
[root@es-node1 ~]# echo "* soft nofile 65536" >> /etc/security/limits.conf
[root@es-node1 ~]# echo "* hard nofile 65536" >> /etc/security/limits.conf
hostX 。 。。。。。
[root@linux-host1 ~]# vim /etc/hosts
192.168.15.11 linux-host1.exmaple.com
192.168.15.12 linux-host2.exmaple.com
192.168.15.13 linux-host3.exmaple.com
192.168.15.14 linux-host4.exmaple.com
192.168.15.15 linux-host5.exmaple.com
192.168.15.16 linux-host6.exmaple.com
[root@linux-host1 ~]# wget -O /etc/yum.repos.d/epel.repo
http://mirrors.aliyun.com/repo/epel-7.repo
[root@linux-host1 ~]# yum install -y net-tools vim lrzsz tree screen lsof tcpdump wget
ntpdate
[root@linux-host1 ~]# cp /usr/share/zoneinfo/Asia/Shanghai /etc/localtime
[root@linux-host1 ~]# echo "*/5 * * * * ntpdate time1.aliyun.com &> /dev/null &&
hwclock -w" >> /var/spool/cron/root
[root@linux-host1 ~]# systemctl restart crond
[root@linux-host1 ~]# reboot #重启检查各项配置是否生效,没有问题的话给虚拟机做快照以方便后期还原
https://github.com/elastic #github 地址
版本选择:(注意没有3和4)
0.x 1.x 2.x 5.x 6.x 7.x
因为 elasticsearch 服务运行需要 java 环境,因此两台 elasticsearch 服务器需要
安装 java 环境,可以使用以下方式安装
方式一 直接使用 yum 安装 openjdk
[root@linux-host1 ~]# yum install java-1.8.0*
方式二 本地安装在 oracle 官网下载 rpm 安装包
[root@linux-host1 ~]# yum localinstall jdk-8u92-linux-x64.rpm
方式三 下载二进制包自定义 profile 环境变量
下 载 地 址 http://www.oracle.com/technetwork/java/javase/downloads/jdk8-downloads-2133151.html
[root@linux-host1 ~]# tar xvf jdk-8u121-linux-x64.tar.gz -C /usr/local/
[root@linux-host1 ~]# ln -sv /usr/local/jdk1.8.0_121 /usr/local/jdk
[root@linux-host1 ~]# ln -sv /usr/local/jdk/bin/java /usr/bin/
[root@linux-host1 ~]# vim /etc/profile
export HISTTIMEFORMAT="%F %T `whoami` "
export JAVA_HOME=/usr/local/jdk
export
CLASSPATH=.:$JAVA_HOME/jre/lib/rt.jar:$JAVA_HOME/lib/dt.jar:$JAVA_HOME/lib/tools.jar
export PATH=$PATH:$JAVA_HOME/bin
[root@linux-host1 ~]# source /etc/profile
[root@linux-host1 ~]# java -version
java version "1.8.0_121" #确认可以出现当前的 java 版本号
Java(TM) SE Runtime Environment (build 1.8.0_121-b13)
Java HotSpot(TM) 64-Bit Server VM (build 25.121-b13, mixed mode)
下载地址 https://www.elastic.co/downloads/elasticsearch, 当前最新版本 5.3.0
[root@linux-host1 ~]# yum –y localinstall elasticsearch-5.3.0.rpm

本试验用了另一种方式:
[root@es-node1 ~]#cd /usr/local/src/
[root@es-node1 src]#ll
total 17416
drwxr-xr-x  2 root root     4096 Sep 28 09:47 ./
drwxr-xr-x 10 root root     4096 Feb  4  2020 ../
-rw-r--r--  1 root root 17825792 Sep 28 09:45 elasticsearch-7.6.2-amd64.deb
[root@es-node1 src]#dpkg -i elasticsearch-7.6.2-amd64.deb
https://www.ibm.com/support/knowledgecenter/zh/SSFPJS_8.5.6/com.ibm.wbpm.main.doc/topics/rfps_esearch_configoptions.html
[root@linux-host1 ~]# grep "^[a-Z]" /etc/elasticsearch/elasticsearch.yml
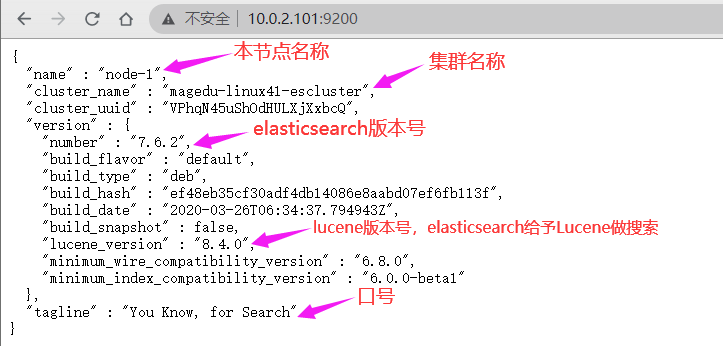
cluster.name: magedu-linux41-escluster #ELK 的集群名称,名称相同即属于是同一个集群
node.name: node-1 #当前节点在集群内的节点名称
path.data: /data/esdata/data #ES 数据保存目录
path.logs: /data/esdata/logs #ES 日志保存目
bootstrap.memory_lock: true #服务启动的时候锁定足够的内存, 防止数据写入swap,默认是一个G,
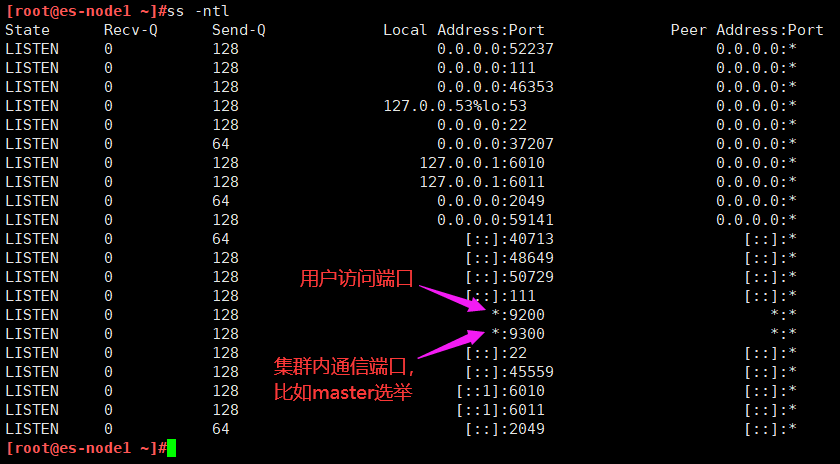
network.host: 0.0.0.0 #监听 IP
http.port: 9200 #监听端口
#集群中 node 节点发现列表
discovery.seed_hosts: ["10.0.2.101","10.0.2.102","10.0.2.103"]
#集群初始化那些节点可以被选举为 master
cluster.initial_master_nodes: ["172.31.6.104","172.31.6.105","172.31.6.106"]
#2.x 5.x 6.x 配置节点发现列表
discovery.zen.ping.unicast.hosts: ["192.168.15.11", "192.168.15.12"]
#一个集群中的 N 个节点启动后,才允许进行数据恢复处理,默认是 1
gateway.recover_after_nodes: 2
# 设置是否可以通过正则或者_all 删除或者关闭索引库,默认 true 表示必须需要显式指定索引库名称, 生产环境建议设置为 true,删除索引库的时候必须指定,否则可能会误删索引库中的索引库。
action.destructive_requires_name: true
实验最终配置如下:
[root@es-node1 ~]#grep "^[a-Z]" /etc/elasticsearch/elasticsearch.yml
cluster.name: magedu-linux41-escluster
node.name: node-1
path.data: /data/esdata/data
path.logs: /data/esdata/logs
network.host: 0.0.0.0
http.port: 9200
discovery.seed_hosts: ["10.0.2.101","10.0.2.102","10.0.2.103"]
cluster.initial_master_nodes: ["10.0.2.101","10.0.2.102","10.0.2.103"]
gateway.recover_after_nodes: 2
action.destructive_requires_name: true
内存锁定的配置参数
https://discuss.elastic.co/t/memory-lock-not-working/70576
[root@linux-host1 ~]# vim /usr/lib/systemd/system/elasticsearch.service #修改内存
限制
LimitMEMLOCK=infinity #无限制使用内存,新版本已经不需要再修改此文件

[root@es-node1 ~]# vim /etc/elasticsearch/jvm.options
22 -Xms2g
23 -Xmx2g #最小和最大内存限制,为什么最小和最大设置一样大?
https://www.elastic.co/guide/en/elasticsearch/reference/current/heap-size.html
#官方配置文档最大建议 30G 以内。
#将以上配置文件 scp 到 host2 并修改自己的 node 名称
[root@es-node1 ~]#scp /etc/elasticsearch/elasticsearch.yml 10.0.2.102:/etc/elasticsearch/
[root@es-node2 ~]# grep "^[a-Z]" /etc/elasticsearch/elasticsearch.yml
cluster.name: magedu-linux41-escluster
node.name: node-2 #与 host1 不能相同
path.data: /data/esdata/data
path.logs: /data/esdata/logs
network.host: 0.0.0.0
http.port: 9200
discovery.seed_hosts: ["10.0.2.101","10.0.2.102","10.0.2.103"]
cluster.initial_master_nodes: ["10.0.2.101","10.0.2.102","10.0.2.103"]
gateway.recover_after_nodes: 2
action.destructive_requires_name: true
各服务器创建数据和日志目录并修改目录权限为 elasticsearch
[root@es-node1 ~]#ll /data/esdata/
total 4
drwxr-xr-x 2 root root    6 Sep 28 10:20 ./
drwxr-xr-x 4 root root 4096 Sep 28 10:22 ../
[root@es-node1 ~]#chown elasticsearch.elasticsearch /data/esdata/ -R
[root@es-node1 ~]#ll /data/esdata/
total 4
drwxr-xr-x 2 elasticsearch elasticsearch    6 Sep 28 10:20 ./
drwxr-xr-x 4 root          root          4096 Sep 28 10:22 ../
[root@es-node1 ~]#systemctl start elasticsearch
[root@es-node1 ~]#tail -f /data/esdata/logs/magedu-linux41-escluster.log
插件是为了完成不同的功能,官方提供了一些插件但大部分是收费的,另外也有一些开发爱好者提供的插件,可以实现对 elasticsearch 集群的状态监控与管理配置等功能。
在 elasticsearch 5.x 版本以后不再支持直接安装 head 插件, 而是需要通过启动一个服务方式, git 地址 https://github.com/mobz/elasticsearch-head
[root@linux-host1 ~]# yum install -y npm
#NPM 的全称是 Node Package Manager,是随同 NodeJS 一起安装的包管理和分发工具,它很方便让 JavaScript 开发者下载、安装、上传以及管理已经安装的包。
[root@linux-host1 ~]# cd /usr/local/src/
[root@linux-host1 src]#git clone git://github.com/mobz/elasticsearch-head.git
[root@linux-host1 src]# cd elasticsearch-head/
[root@linux-host1 elasticsearch-head]# yum install npm -y
[root@linux-host1 elasticsearch-head]# npm install grunt -save
[root@linux-host2 elasticsearch-head]# ll node_modules/grunt #确认生成文件
[root@linux-host1 elasticsearch-head]# npm install #执行安装
[root@linux-host1 elasticsearch-head]# npm run start & #后台启动服务
开启跨域访问支持, 然后重启 elasticsearch 服务
[root@es-node1 ~]# vim /etc/elasticsearch/elasticsearch.yml
http.cors.enabled: true #开启支持跨域访问
http.cors.allow-origin: "*" #指定允许访问范围
[root@es-node1 ~]#systemctl restart elasticsearch.service
#先安装docker
[root@es-node1 ~]#vim docker-install.sh
# step 1: 安装必要的一些系统工具
sudo apt-get update
sudo apt-get -y install apt-transport-https ca-certificates curl software-properties-common
# step 2: 安装GPG证书
curl -fsSL https://mirrors.aliyun.com/docker-ce/linux/ubuntu/gpg | sudo apt-key add -
# Step 3: 写入软件源信息
sudo add-apt-repository "deb [arch=amd64] https://mirrors.aliyun.com/docker-ce/linux/ubuntu $(lsb_release -cs) stable"
# Step 4: 更新并安装Docker-CE
sudo apt-get -y update
sudo apt-get -y install docker-ce
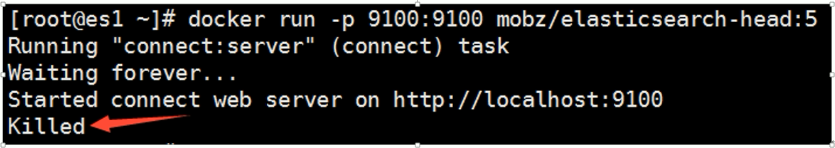
[root@es-node1 ~]#docker run -d -p 9100:9100 mobz/elasticsearch-head:5
#如果下载较慢,就从阿里云拉镜像,修改文件如下
[root@es-node1 ~]#cat /etc/docker/daemon.json
{
"registry-mirrors": ["https://hpqoo1ip.mirror.aliyuncs.com"]
}
[root@es-node1 ~]#systemctl daemon-reload
[root@es-node1 ~]#systemctl restart docker.service
然后重新连接
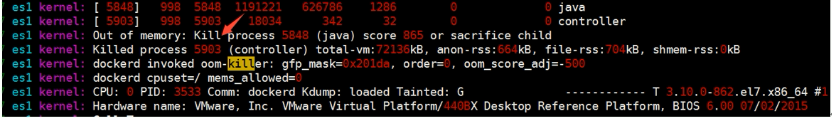
由于宿主机内存不足, 系统内核会将占用内存最大的进程强制 kill 掉,以保证系统的正常运行以及其他服务的正常运行。
Master 的职责
统计各 node 节点状态信息、集群状态信息统计、索引的创建和删除、 索引分配的管理、关闭 node 节点等
Slave 的职责 从 master 同步数据、等待机会成为 Master
[root@linux-host2 ~]# docker save docker.io/mobz/elasticsearch-head >
/opt/elasticsearch-head-docker.tar.gz #导出镜像
[root@linux-host1 src]# docker load < /opt/elasticsearch-head-docker.tar.gz #导入
[root@linux-host1 src]# docker images#验证
REPOSITORY TAG IMAGE ID
CREATED SIZE
docker.io/mobz/elasticsearch-head 5 b19a5c98e43b
4 months ago 823.9 MB
[root@linux-host1 src]# docker run -d -p 9100:9100 --name elastic
docker.io/mobz/elasticsearch-head:5 #从本地 docker images 启动容器
Git 地址为 https://github.com/lmenezes/elasticsearch-kopf, 但是目前还不支持 5.x版本的 elasticsearch,但是可以安装在 elasticsearc 1.x 或 2.x 的版本安装。不建议使用
新开源的 elasticsearch 集群 web 管理程序, 需要 java1.8 或者更高版本,
https://github.com/lmenezes/cerebro
#tar xvf cerebro-0.8.5.tgz
#cd cerebro-0.8.5/
#pwd
/usr/local/src/cerebro-0.8.5

#vim conf/application.conf
hosts = [
  {
	host = "http://172.31.0.201:9200"
	name = "magedu"
  #headers-whitelist = [ "x-proxy-user", "x-proxy-roles", "X-Forwarded-For" ]
  }

#./bin/cerebro
本实验在10.0.2.109使用此插件
[root@elk-web3 ~]#cd /apps
#先装java环境
[root@elk-web3 apps]#apt install -y openjdk-8-jdk
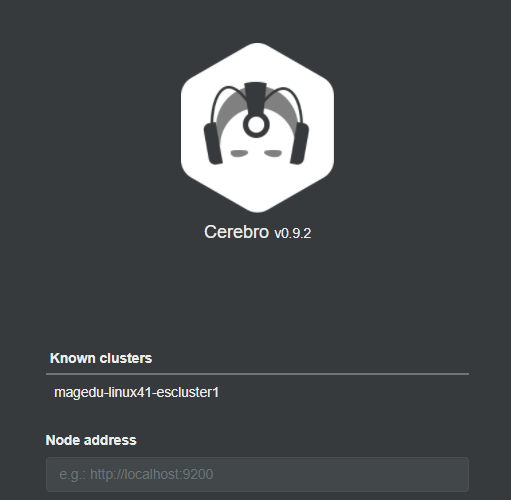
[root@elk-web3 apps]#wget https://github.com/lmenezes/cerebro/releases/download/v0.9.2/cerebro-0.9.2.tgz
[root@elk-web3 apps]#tar xvf cerebro-0.9.2.tgz
[root@elk-web3 apps]#cd cerebro-0.9.2/
[root@elk-web3 cerebro-0.9.2]#vim conf/application.conf
hosts = [
{
host = "http://10.0.2.101:9200"
name = "magedu-linux41-escluster1"
# headers-whitelist = [ "x-proxy-user", "x-proxy-roles", "X-Forwarded-For" ]
#}
# Example of host with authentication
#{
# host = "http://some-authenticated-host:9200"
# name = "Secured Cluster"
# auth = {
# username = "username"
# password = "secret-password"
# }
}
]
#开启插件
[root@elk-web3 cerebro-0.9.2]#./bin/cerebro
[info] play.api.Play - Application started (Prod) (no global state)
[info] p.c.s.AkkaHttpServer - Listening for HTTP on /0:0:0:0:0:0:0:0:9000
浏览器访问10.0.2.109:9000
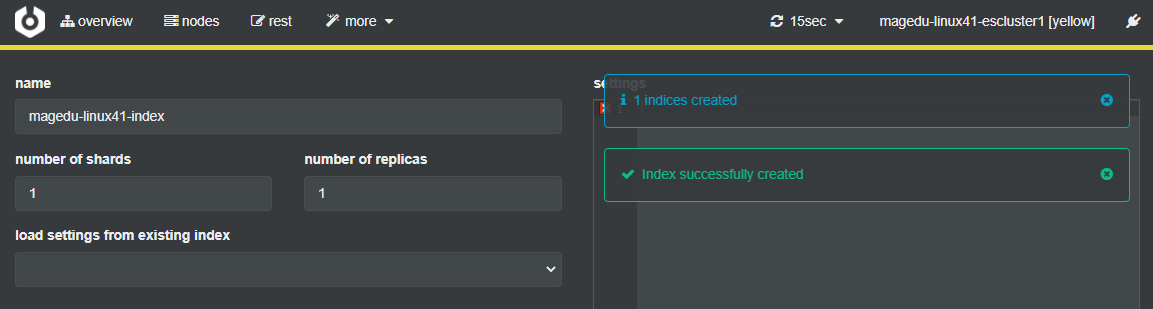
#创建 index
More-create index
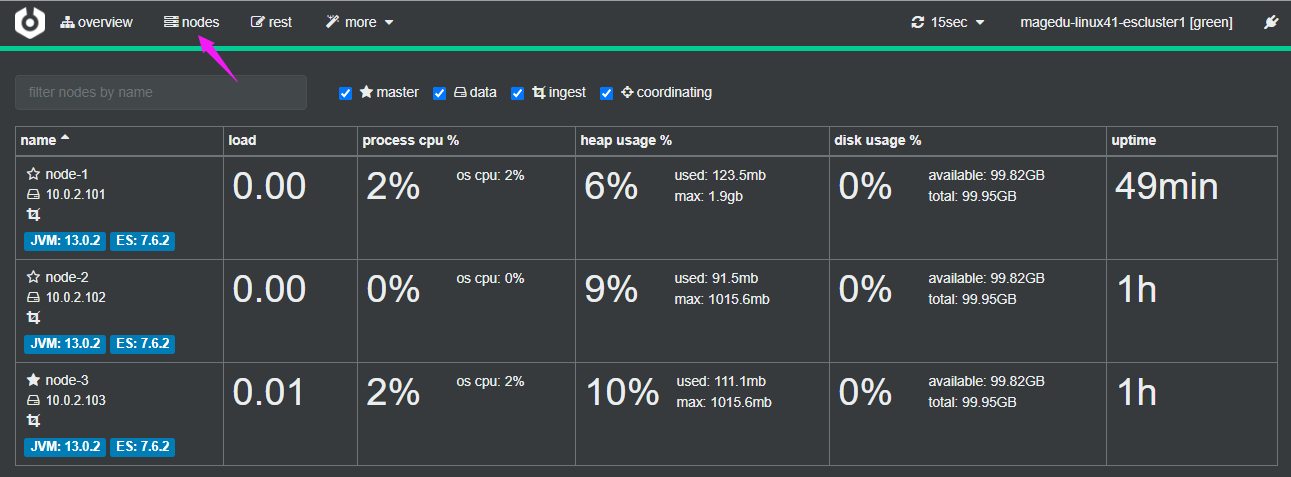
节点信息统计
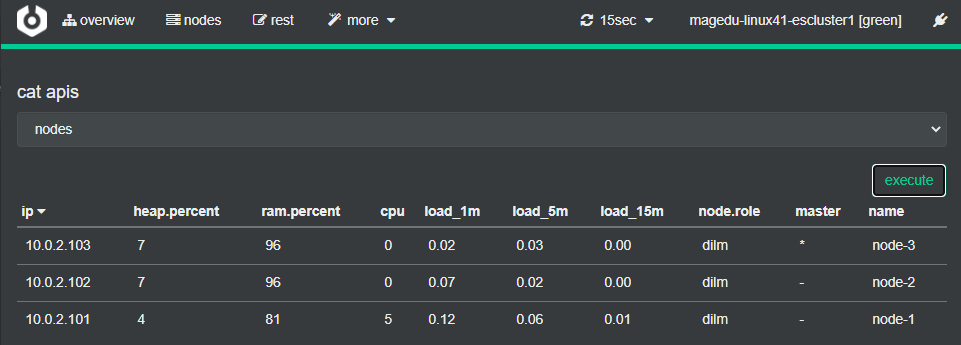
API 使用
More–cat apis
https://www.elastic.co/guide/cn/elasticsearch/guide/current/_cluster_health.html
curl -sXGET http://10.0.2.101:9200/_cluster/health?pretty=true
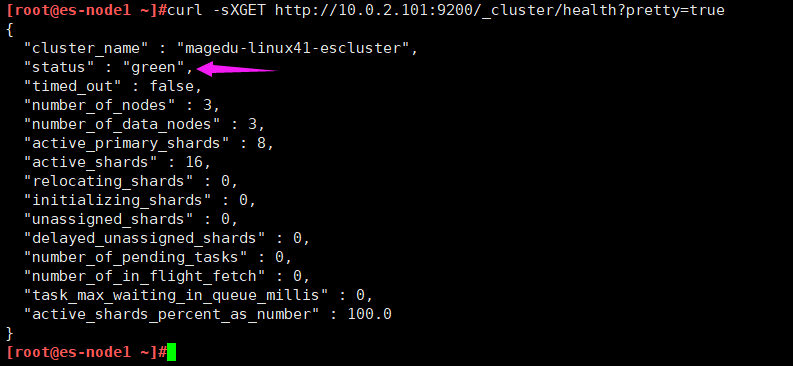
#获取到的是一个 json 格式的返回值,那就可以通过 python 对其中的信息进行分析,例如对 status 进行分析,如果等于 green(绿色)就是运行在正常,等于yellow(黄色)表示副本分片丢失, red(红色)表示主分片丢失1.5.2 python 脚本
[root@linux-host1 ~]# cat els-cluster-monitor.py

#注意:脚本里的地址最好写成负载均衡(VIP)的地址,万一102挂了,则脚本不能使用
[root@elk-web3 ~]#cat monitor_es.py
#!/usr/bin/env python
#coding:utf-8
#Author Zhang Jie

import smtplib
from email.mime.text import MIMEText
from email.utils import formataddr
import subprocess
body = ""
false="false"
obj = subprocess.Popen(("curl -sXGET http://10.0.2.102:9200/_cluster/health?pretty=true"),shell=True,stdout=subprocess.PIPE)
data = obj.stdout.read()
data1 = eval(data)
status = data1.get("status")
if status == "green":
	print("50")
else:
	print("100")
[root@elk-web3 ~]#python3 monitor_es.py
50
停止 ES 集群中每个节点再次进行测试
#systemctl stop elasticsearch

[root@linux-host1 ~]# python els-cluster-monitor.py
100
Logstash 是一个开源的数据收集引擎, 可以水平伸缩, 而且 logstash 整个 ELK当中拥有最多插件的一个组件, 其可以接收来自不同来源的数据并统一输出到指定的且可以是多个不同目的地。
https://github.com/elastic/logstash
https://baike.baidu.com/item/Ruby/11419 #基于 ruby 开发
关闭防火墙和 selinux,并且安装 java 环境
[root@linux-host3 ~]# systemctl stop firewalld
[root@linux-host3 ~]# systemctl disable firewalld
[root@linux-host3 ~]# sed -i '/SELINUX/s/enforcing/disabled/' /etc/selinux/config

[root@elk-web1 ~]#apt install openjdk-8-jdk -y
[root@elk-web1 ~]#java -version
openjdk version "1.8.0_265"
OpenJDK Runtime Environment (build 1.8.0_265-8u265-b01-0ubuntu2~18.04-b01)
OpenJDK 64-Bit Server VM (build 25.265-b01, mixed mode)
[root@elk-web1 ~]#reboot
[root@elk-web1 ~]#dpkg -i logstash-7.6.2.deb
[root@linux-host3 ~]# chown logstash.logstash /usr/share/logstash/data/queue –R
#权限更改为 logstash 用户和组,否则启动的时候日志报错
[root@elk-web1 ~]#/usr/share/logstash/bin/logstash -e 'input { stdin{} } output { stdout { codec => rubydebug } }' #标准输入和输出
hello
{
    "@timestamp" => 2020-09-28T13:41:33.302Z, #当前事件的发生时间,
    "@version" => "1", #事件版本号, 一个事件就是一个 ruby 对象
    "host" => "elk-web1.cuiqinghe.com", #标记事件发生在哪里
    "message" => "hello" #消息的具体内容
}
[root@elk-web1 ~]#/usr/share/logstash/bin/logstash -e 'input { stdin{} } output { file { path => "/tmp/log-%{+YYYY.MM.dd}messages.log"}}'
msg1
[INFO ] 2020-09-28 13:51:41.168 [[main]>worker0] file - Opening file {:path=>"/tmp/log-2020.09.28messages.log"}
[root@elk-web1 ~]#tail -f /tmp/log-2020.09.28messages.log #打开文件验证2.2.3 测试输出到 elasticsearch
{"@version":"1","@timestamp":"2020-09-28T13:51:40.480Z","host":"elk-web1.cuiqinghe.com","message":"msg1"}
[root@elk-web1 ~]# /usr/share/logstash/bin/logstash -e 'input { stdin{} } output { elasticsearch {hosts => ["10.0.2.102:9200"] index => "magedu-linux41-logstash-test-%{+YYYY.MM.dd}" }}'
#写到文件里
[root@elk-web1 ~]#cat /etc/logstash/conf.d/linux41-log-es.conf
input {
stdin {}
}
output {
elasticsearch {
hosts => ["10.0.2.101"]
index => "magedu-linux41-logstash-testindex"
}
file {
path => "/tmp/magedu-linux41-logstash-testindex.log"
}
}
#进行测试
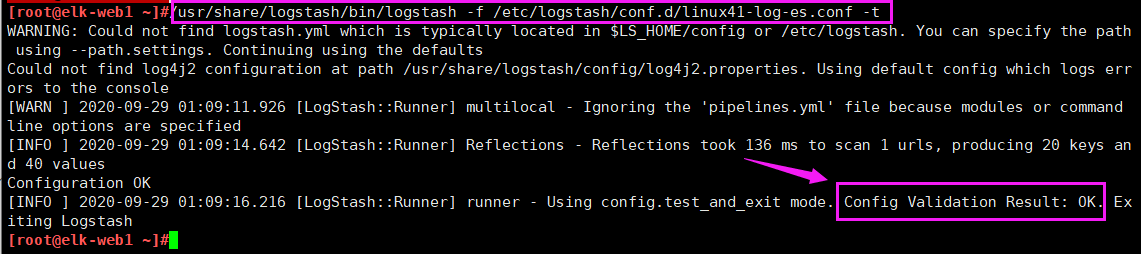
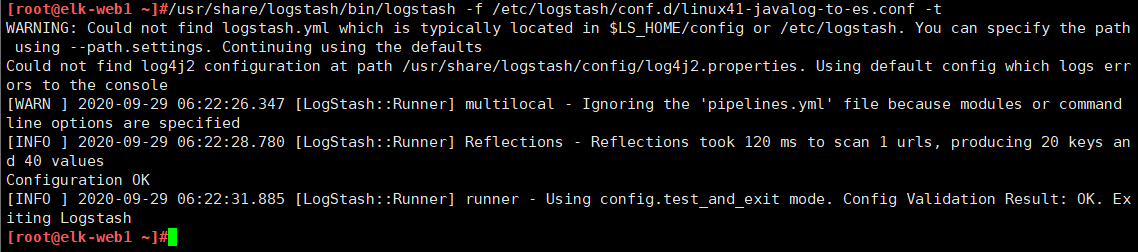
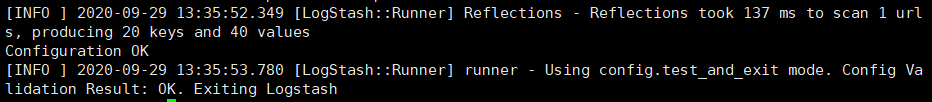
[root@elk-web1 ~]#/usr/share/logstash/bin/logstash -f /etc/logstash/conf.d/linux41-log-es.conf -t
WARNING: Could not find logstash.yml which is typically located in $LS_HOME/config or /etc/logstash. You can specify the path using --path.settings. Continuing using the defaults
Could not find log4j2 configuration at path /usr/share/logstash/config/log4j2.properties. Using default config which logs errors to the console
[WARN ] 2020-09-28 14:20:36.064 [LogStash::Runner] multilocal - Ignoring the 'pipelines.yml' file because modules or command line options are specified
[INFO ] 2020-09-28 14:20:38.576 [LogStash::Runner] Reflections - Reflections took 103 ms to scan 1 urls, producing 20 keys and 40 values
Configuration OK
[INFO ] 2020-09-28 14:20:39.632 [LogStash::Runner] runner - Using config.test_and_exit mode. Config Validation Result: OK. Exiting Logstash
[root@linux-host1 ~]# ll /elk/data/nodes/0/indices/ #5.x 版本以后不再显示原名称
total 0
drwxr-xr-x 8 elasticsearch elasticsearch 59 Apr 19 19:08 JbnPSBGxQ_WbxT8jF5-TLw
drwxr-xr-x 8 elasticsearch elasticsearch 59 Apr 19 20:18 kZk1UbsjTliYfooevuQVdQ
drwxr-xr-x 4 elasticsearch elasticsearch 27 Apr 19 19:24 m6EiWqngS0C1bspg8JtmBg
drwxr-xr-x 8 elasticsearch elasticsearch 59 Apr 20 08:49 YhtJ1dEXSOa0YEKhe6HW8w
#早期的 elasticsearch, 如 1.X 和 2.X 直接显示 index 的名称
Kibana 是一款开源的数据分析和可视化平台,它是 Elastic Stack 成员之一,设计用于和 Elasticsearch 协作,可以使用 Kibana 对 Elasticsearch 索引中的数据进行搜索、查看、交互操作,您可以很方便的利用图表、表格及地图对数据进行多元化的分析和呈现。
https://github.com/elastic/kibana
https://typescript.bootcss.com/ #目前基于 TypeScript 语言开发
Kibana 可以使大数据通俗易懂。它很简单,基于浏览器的界面便于您快速创建和分享动态数据仪表板来追踪 Elasticsearch 的实时数据变化。
可以通过 rpm 包或者二进制的方式进行安装
[root@es-node1 src]#dpkg -i kibana-7.6.2-amd64.deb
[root@es-node1 ~]#grep -n "^[a-Z]" /etc/kibana/kibana.yml
2:server.port: 5601 #监听端口
7:server.host: "0.0.0.0" #监听地址
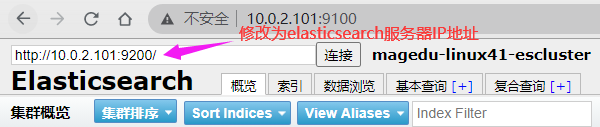
28:elasticsearch.hosts: ["http://10.0.2.101:9200"]
114:i18n.locale: "zh-CN" #支持中文
21:elasticsearch.url: http://192.168.15.11:9200 #elasticsearch 服务器地址
[root@es-node1 ~]#systemctl restart kibana.service
[root@es-node1 ~]#systemctl enable kibana.service
[root@es-node1 ~]#ss -tnl | grep 5601
LISTEN   0         128                 0.0.0.0:5601             0.0.0.0:*
http://192.168.15.11:5601/status
[root@elk-web1 ~]#cat /etc/logstash/conf.d/linux41-log-es.conf
input {
  file {
    path => "/var/log/syslog"
    start_position => "beginning"
  }
}

output {
  elasticsearch {
    hosts => ["10.0.2.101"]
    index => "magedu-linux41-logstash-testindex"
  }
  file {
    path => "/tmp/magedu-linux41-logstash-testindex.log-{+%YYYY.MM.dd}"
  }
}

[root@elk-web1 ~]#vim /etc/systemd/system/logstash.service  #把属主属组改为root
[root@elk-web1 ~]#systemctl daemon-reload
[root@elk-web1 ~]#systemctl restart logstash.service
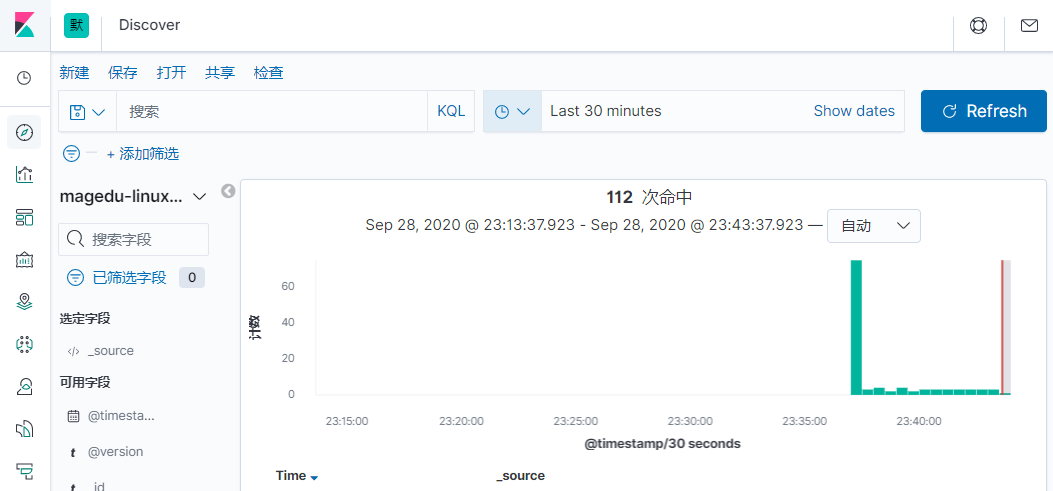
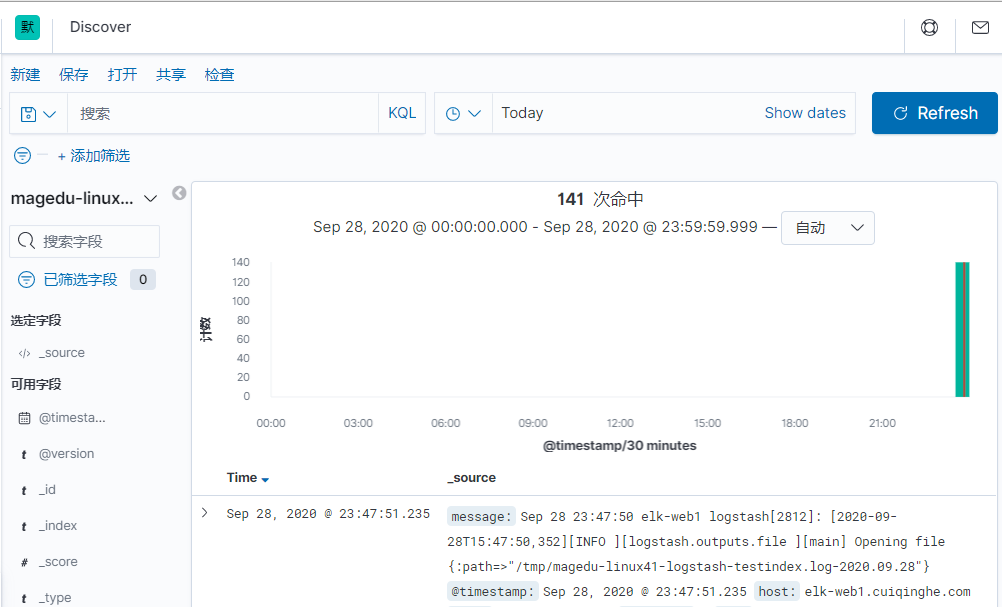
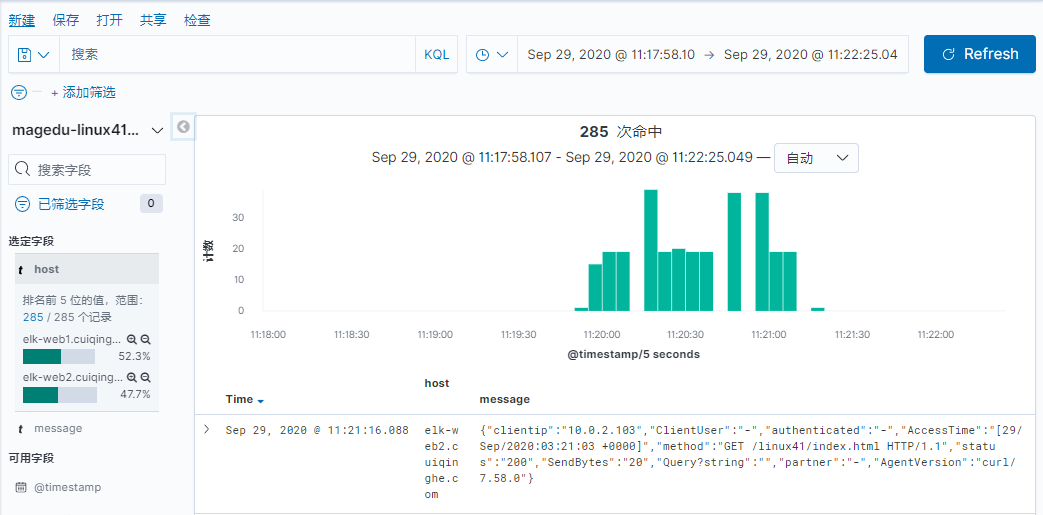
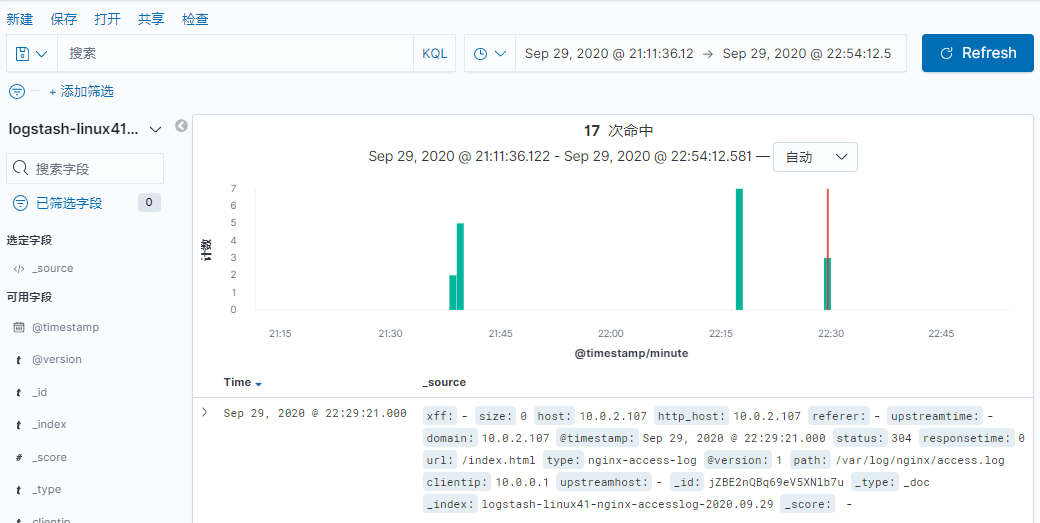
如果默认没有显示柱状的图,可能是最近没有写入新的数据,可以查看较长日期当中的数据或者通过 logstash 新写入数据即可
修改hosts文件
[root@elk-web1 ~]#cat /etc/hosts
10.0.2.107 elk-web1.cuiqinghe.net
前提需要 logstash 用户对被收集的日志文件有读的权限并对写入的文件有写权限。
[root@linux-host3 ~]# cat /etc/logstash/conf.d/system-log.conf
input {
file {
type => "messagelog"
path => "/var/log/messages"
start_position => "beginning" #第一次从头收集,之后从新添加的日志收集
}
}
#本实验使用的配置
[root@elk-web1 ~]#vim /etc/logstash/conf.d/linux41-log-es.conf
output {
file {
path => "/tmp/%{type}.%{+yyyy.MM.dd}"
}
}
input {
file {
path => "/var/log/syslog"
start_position => "beginning"
}
}
output {
elasticsearch {
hosts => ["10.0.2.101"]
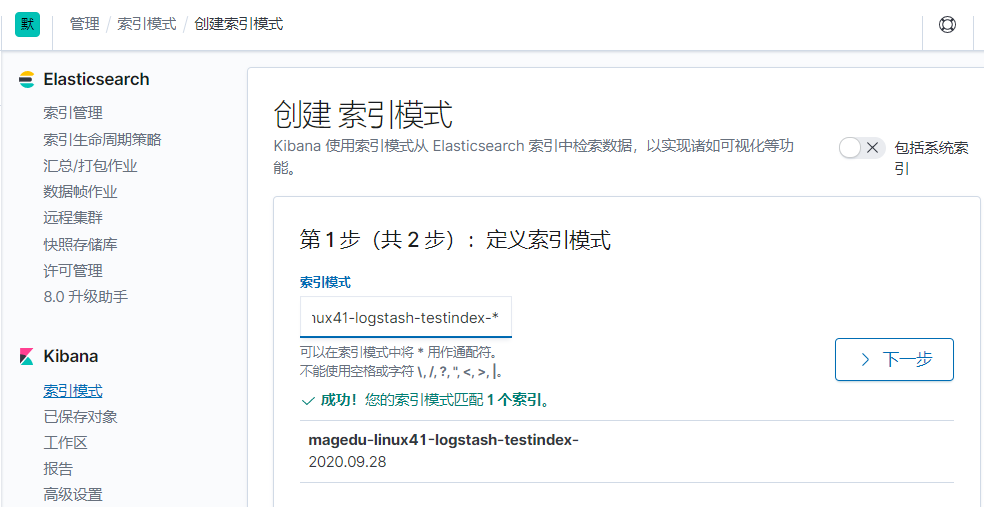
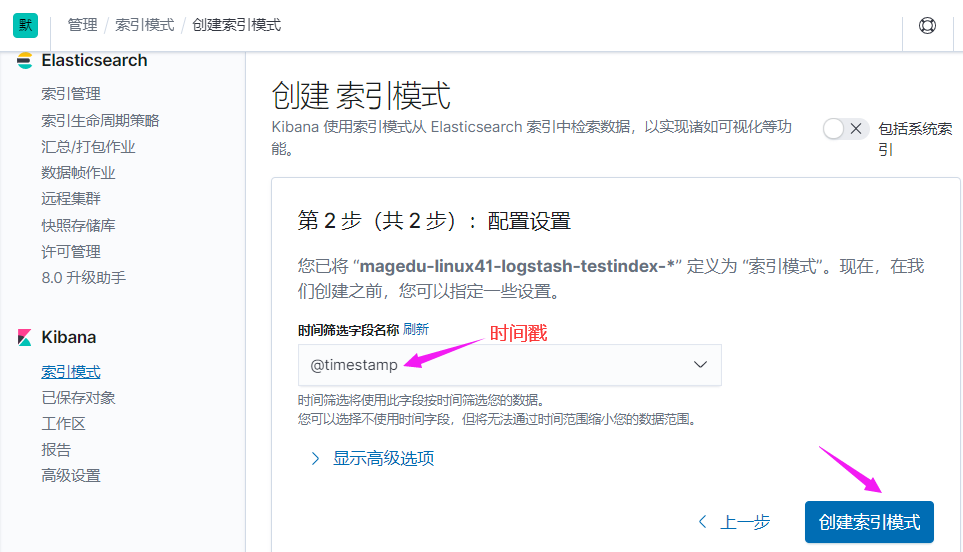
index => "magedu-linux41-logstash-testindex-%{+YYYY.MM.dd}"
}
file {
path => "/tmp/magedu-linux41-logstash-testindex.log-%{+YYYY.MM.dd}"
}
}
[root@elk-web1 ~]#/usr/share/logstash/bin/logstash -f /etc/logstash/conf.d/linux41-log-es.conf -t
[root@elk-web1 ~]#echo "test" >> /var/log/syslog
[root@elk-web1 ~]#tail -f /tmp/magedu-linux41-logstash-testindex.log-2020.09.29 #验证是否生成文件
{"host":"elk-web1.cuiqinghe.com","message":"Sep 29 09:11:47 elk-web1 logstash[2945]: [2020-09-29T01:11:47,579][INFO ][logstash.outputs.file    ][main] Opening file {:path=>\"/tmp/magedu-linux41-logstash-testindex.log-2020.09.29\"}","@timestamp":"2020-09-29T01:11:48.468Z","@version":"1","path":"/var/log/syslog"}
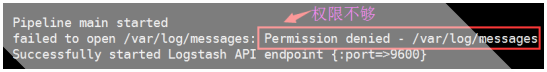
方法一:改权限
[root@linux-host2 ~]# chmod 644 /var/log/messages

方法二:改service文件,用root启动

[root@linux-host3 logstash]# cat /etc/logstash/conf.d/system-log.conf
input {
  file {
    path => "/var/log/messages" #日志路径
    type => "systemlog" #事件的唯一类型
    start_position => "beginning" #第一次收集日志的位置
    stat_interval => "3" #日志收集的间隔时间
  }
  file {
    path => "/var/log/secure"
    type => "securelog"
    start_position => "beginning"
    stat_interval => "3"
  }
}
output {
  if [type] == "systemlog" {
    elasticsearch {
      hosts => ["192.168.15.11:9200"]
      index => "system-log-%{+YYYY.MM.dd}"
    }}
  if [type] == "securelog" {
    elasticsearch {
      hosts => ["192.168.15.11:9200"]
      index => "secury-log-%{+YYYY.MM.dd}"
    }}
}
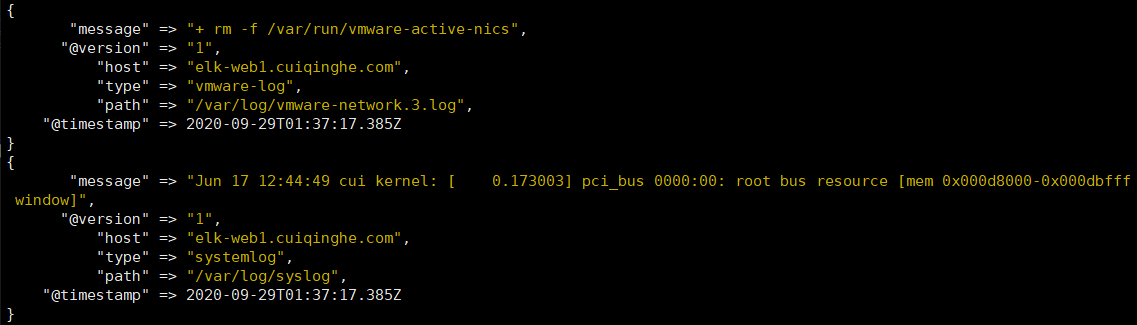
本实验配置如下:
[root@elk-web1 ~]#cat /etc/logstash/conf.d/linux41-log-es.conf
input {
file {
path => "/var/log/syslog"
start_position => "beginning"
stat_interval => "3"
type => "systemlog"
}
file {
path => "/var/log/vmware-network*"
start_position => "beginning"
stat_interval => "3"
type => "vmware-log"
}
}
output {
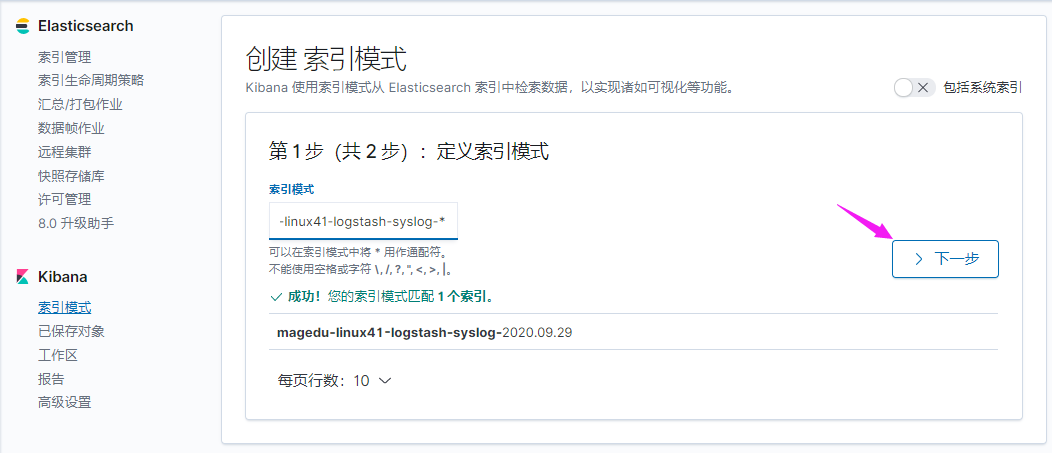
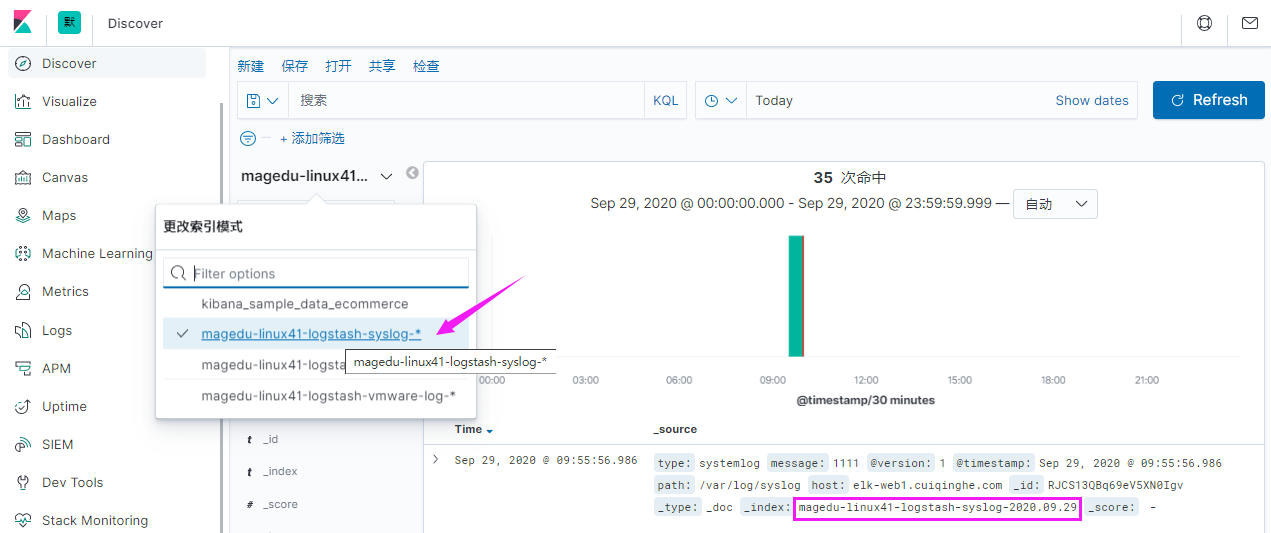
if [type] == "systemlog" {
elasticsearch {
hosts => ["10.0.2.101"]
index => "magedu-linux41-logstash-syslog-%{+YYYY.MM.dd}"
}}
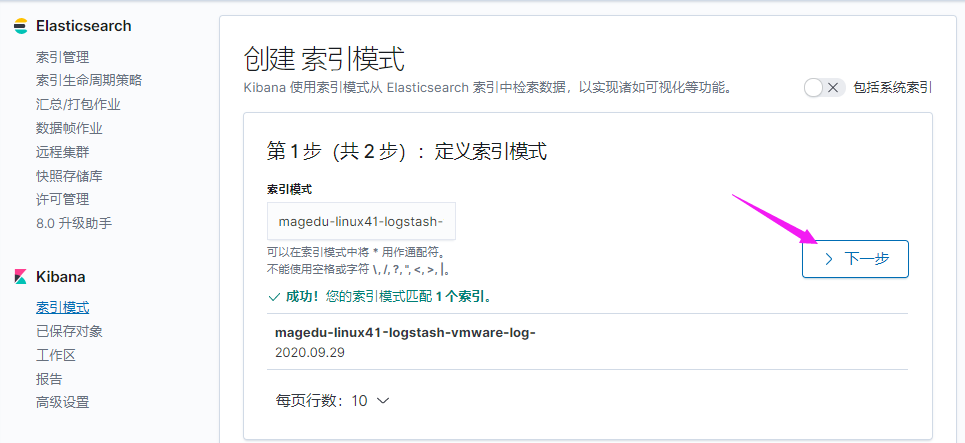
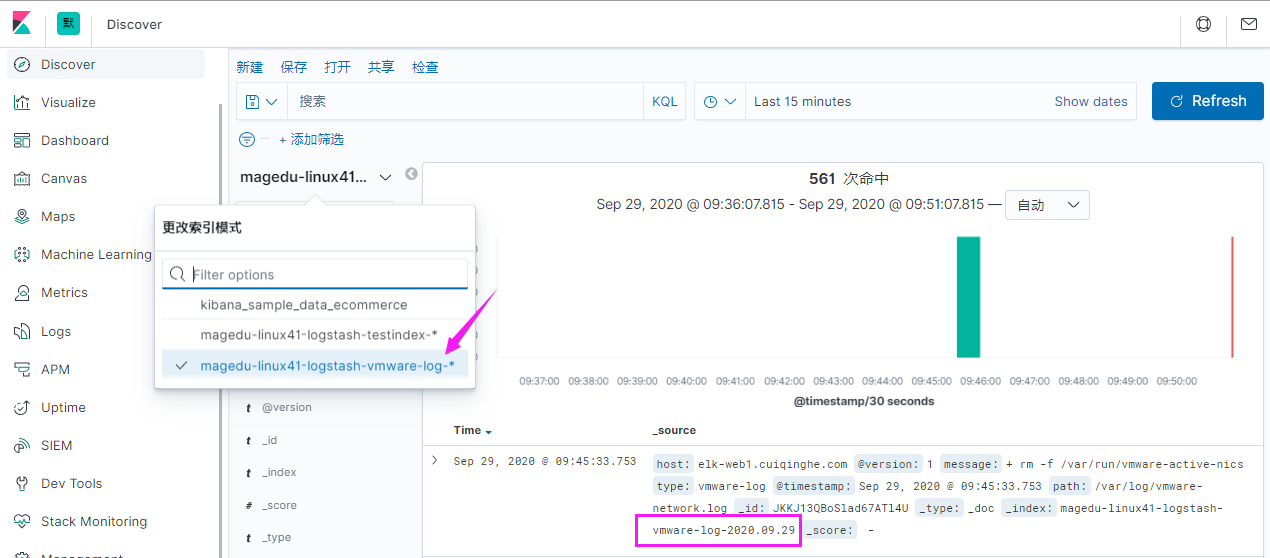
if [type] == "vmware-log" {
elasticsearch {
hosts => ["10.0.2.102"]
index => "magedu-linux41-logstash-vmware-log-%{+YYYY.MM.dd}"
}}
}
#建议先在屏幕上做输出测试
output {
  stdout {
    codec => "rubydebug"
  }
}
[root@linux-host3 ~]# chmod 644 /var/log/secure
[root@linux-host3 ~]# chmod 644 /var/log/messages
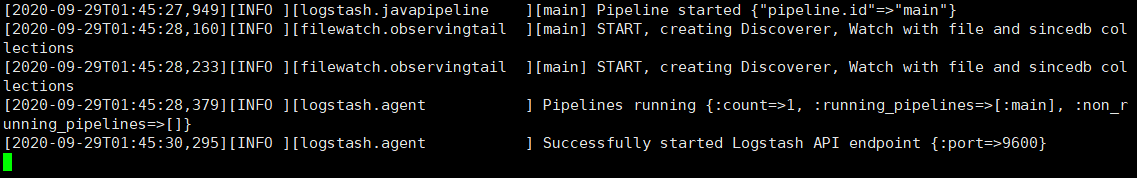
[root@elk-web1 ~]#systemctl restart logstash.service
#查看启动日志
[root@elk-web1 ~]#tail -f /var/log/logstash/logstash-plain.log
[root@elk-web1 ~]#echo "1111" >> /var/log/syslog
[root@elk-web1 ~]#echo "2222" >> /var/log/vmware-network.3.log
收集 Tomcat 服务器的访问日志以及 Tomcat 错误日志进行实时统计,在 kibana页面进行搜索展现,每台 Tomcat 服务器要安装 logstash 负责收集日志,然后将日志转发给 elasticsearch 进行分析,在通过 kibana 在前端展现,配置过程如下
需要安装 java 环境,并自定义一个 web 界面进行测试。
[root@linux-host6 ~]# yum install jdk-8u121-linux-x64.rpm
[root@elk-web1 ~]#mkdir /apps
[root@elk-web1 ~]#cd /apps
[root@elk-web1 apps]#tar xvf apache-tomcat-8.5.57.tar.gz
[root@linux-host6 src]# ln -sv /usr/local/src/apache-tomcat-8.0.38 /usr/local/tomcat
‘ /usr/local/tomcat’ -> ‘/usr/local/src/apache-tomcat-8.0.38’
[root@elk-web1 apps]#cd apache-tomcat-8.5.57/webapps/
[root@elk-web1 webapps]#mkdir linux41
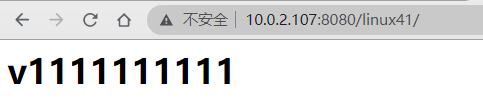
[root@elk-web1 webapps]#vim linux41/index.html
<h1>v1111111111<h1>
[root@elk-web1 apache-tomcat-8.5.57]#/apps/apache-tomcat-8.5.57/bin/catalina.sh start
[root@linux-host6 webapps]# ss -tnl | grep 8080
LISTEN 0 100 :::8080 :::*
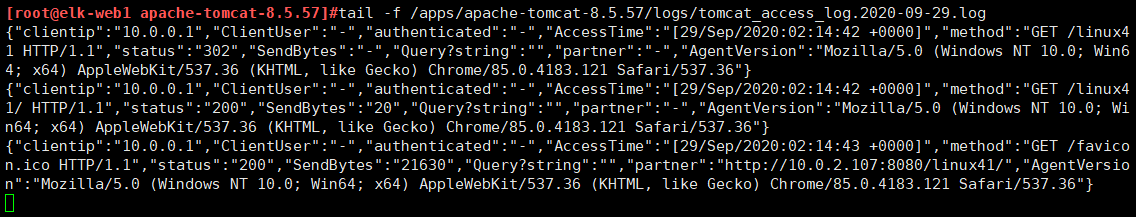
[root@elk-web1 apache-tomcat-8.5.57]#vim conf/server.xml
<Valve className="org.apache.catalina.valves.AccessLogValve" directory="logs"
prefix="tomcat_access_log" suffix=".log"
pattern="{"clientip":"%h","ClientUser":"%l","authenticated":"%u","AccessTime":"%t","method":"%r","status":"%s","SendBytes":"%b","Query?string":"%q","partner":"%{Referer}i","AgentVersion":"%{User-Agent}i"}"/>
[root@linux-host6 tomcat]# ./bin/catalina.sh stop
[root@linux-host6 tomcat]# rm -rf logs/* #删除或清空之前的访问日志
[root@elk-web1 apache-tomcat-8.5.57]#/apps/apache-tomcat-8.5.57/bin/catalina.sh start #启动并访问 tomcat 界面
[root@elk-web1 apache-tomcat-8.5.57]#tail -f /apps/apache-tomcat-8.5.57/logs/tomcat_access_log.2020-09-29.log
http://www.kjson.com/

Python 脚本解析
[root@elk-web1 logs]#cat log.py
#!/usr/bin/env python
#coding:utf-8#Author:Zhang ShiJie
status_200= []
status_404= []
with open("tomcat_access_log.2020-09-29.log") as f:
    for line in f.readlines():
        line = eval(line)
        print (line.get("clientip"))
        if line.get("status") == "200":
            status_200.append(line.get)
        elif line.get("status") == "404":
            status_404.append(line.get)
        else:
            print("状态码 ERROR")
f.close()
print ("状态码 200 的有--:",len(status_200))
print ("状态码 404 的有--:",len(status_404))
需要部署 tomcat 并安装配置 logstash
[root@linux-host6 ~]# yum install logstash-5.3.0.rpm -y
[root@linux-host6 ~]# vim /etc/logstash/conf.d/tomcat.conf
[root@linux-host6 ~]# cat /etc/logstash/conf.d/tomcat.conf
input {
  file {
    path => "/usr/local/tomcat/logs/localhost_access_log.*.txt"
    start_position => "end"
    type => "tomct-access-log"
  }
  file {
    path => "/var/log/messages"
    start_position => "end"
    type => "system-log"
  }
}
output {
  if [type] == "tomct-access-log" {
    elasticsearch {
      hosts => ["192.168.15.11:9200"]
      index => "logstash-tomcat-1516-access-%{+YYYY.MM.dd}"
      codec => "json"
  }}
  if [type] == "system-log" {
    elasticsearch {
      hosts => ["192.168.15.12:9200"] #写入到不通的 ES 服务器
      index => "system-log-1516-%{+YYYY.MM.dd}"
  }}
}
[root@elk-web1 logs]#systemctl restart logstash.service #更改完配置文件重启 logstash
[root@elk-web1 logs]#tail -f /var/log/logstash/logstash-plain.log #验证日志

#若不是root启动,就改权限
[root@linux-host6 ~]# chmod 644 /var/log/messages #修改权限
[root@linux-host6 ~]# systemctl restart logstash #再次重启 logstash
[root@linux-host6 ~]# echo "2017-02-21" >> /var/log/messages

[root@linux-host3 ~]# yum install httpd-tools –y

[root@linux-host3 ~]# ab -n1000 -c100 http://192.168.15.16:8080/webdir/
#两个web服务器跑了同一个服务
#先在107打包
[root@elk-web1 apps]#mv apache-tomcat-8.5.57.tar.gz /tmp/
[root@elk-web1 apps]#tar czvf apache-tomcat-8.5.57.tar.gz apache-tomcat-8.5.57/
[root@elk-web1 apps]#scp apache-tomcat-8.5.57.tar.gz 10.0.2.108:/apps
[root@elk-web1 ~]#scp logstash-7.6.2.deb 10.0.2.108:/usr/local/src
[root@elk-web1 ~]#scp /etc/logstash/conf.d/linux41-log-es.conf 10.0.2.108:/etc/logstash/conf.d/linux41-log-es.conf

#108解压
[root@elk-web2 apps]#tar xvf apache-tomcat-8.5.57.tar.gz
[root@elk-web2 ~]#cd /usr/local/src/
[root@elk-web2 src]#ll
total 169496
drwxr-xr-x  2 root root      4096 Sep 29 11:10 ./
drwxr-xr-x 10 root root      4096 Feb  4  2020 ../
-rw-r--r--  1 root root 173554630 Sep 29 11:10 logstash-7.6.2.deb
[root@elk-web2 src]#dpkg -i logstash-7.6.2.deb
#启动用户和组改为root
[root@elk-web2 ~]#vim /etc/systemd/system/logstash.service
[root@elk-web2 ~]#systemctl daemon-reload
[root@elk-web2 ~]#systemctl restart logstash.service
[root@elk-web2 ~]#systemctl enable logstash.service

[root@elk-web2 ~]#tail -f /var/log/logstash/logstash-plain.log
使用 codec 的 multiline 插件实现多行匹配,这是一个可以将多行进行合并的插件,而且可以使用 what 指定将匹配到的行与前面的行合并还是和后面的行合并,https://www.elastic.co/guide/en/logstash/current/plugins-codecs-multiline.html
[root@linux-host1 ~]# chown logstash.logstash /usr/share/logstash/data/queue -R
[root@linux-host1 ~]# ll -d /usr/share/logstash/data/queue
drwxr-xr-x 2 logstash logstash 6 Apr 19 20:03 /usr/share/logstash/data/queue
[root@linux-host1 ~]# cat /etc/logstash/conf.d/java.conf
input {
         stdin {
         codec => multiline {
         pattern => "^\[" #当遇到[开头的行时候将多行进行合并
         negate => true #true 为匹配成功进行操作, false 为不成功进行操作
         what => "previous" #与以前的行合并,如果是下面的行合并就是 next
         }}
}
filter { #日志过滤,如果所有的日志都过滤就写这里,如果只针对某一个过滤就写在 input 里面的日志输入里面
}
output {
         stdout {
         codec => rubydebug
}}
本实验配置如下:
[root@elk-web1 ~]#cat /etc/logstash/conf.d/linux41-javalog-to-es.conf
input {
  stdin {
    codec => multiline {
      pattern => "^\["
      negate => "true"
      what => "previous"
    }
  }
}

output{
  stdout {
    codec => "rubydebug"
  }
}
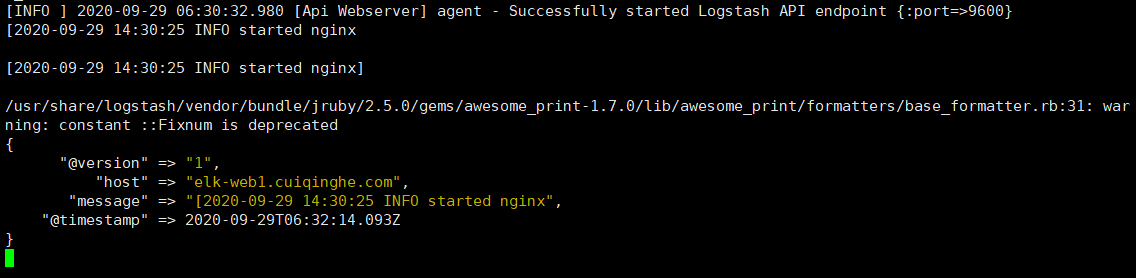
[root@elk-web1 ~]#/usr/share/logstash/bin/logstash -f /etc/logstash/conf.d/linux41-javalog-to-es.conf
[root@linux-host1 ~]# vim /etc/logstash/conf.d/java.conf
input {
  file {
    path => "/var/log/magedu-linux41-escluster.log"
    type => "java-errorlog"
    start_position => "beginning"
    codec => multiline {
    pattern => "^\["
    negate => true
    what => "previous"
  }}
}
output {
  if [type] == "java-errorlog" {
  stdout {
       codec => rubydebug
    }
  file {
     path => "/tmp/m.txt"
  }}
}
[root@linux-host1 ~]# /usr/share/logstash/bin/logstash -f/etc/logstash/conf.d/java.conf -t
更改后的内容如下
[root@linux-host1 ~]# cat /etc/logstash/conf.d/java.conf
input {
  file {
    path => "/var/log/magedu-linux41-escluster.log"
    type => "javalog"
    start_position => "beginning"
    codec => multiline {
    pattern => "^\["
    negate => true
    what => "previous"
  }}
}

output {
  if [type] == "javalog" {
  elasticsearch {
    hosts => ["10.0.2.101:9200"]
    index => "magedu-linux41-java-errorlog-%{+YYYY.MM.dd}"
  }}
}
[root@linux-host1 ~]# systemctl restart logstash
然后重启一下 elasticsearch 服务,目前是为了生成新的日志,以验证 logstash 能否自动收集新生成的日志。
[root@linux-host1 ~]# systemctl restart elasticsearch
[root@linux-host1 ~]# cat /elk/logs/ELK-Cluster.log >> /tmp/1
[root@linux-host1 ~]# cat /tmp/1 >> /elk/logs/ELK-Cluster.log
[root@linux-host1~]# cat
/var/lib/logstash/plugins/inputs/file/.sincedb_1ced15cfacdbb0380466be84d620085
a
134219868 0 2064 29465 #记录了收集文件的 inode 信息[root@linux-host1 ~]# ll -li /elk/logs/ELK-Cluster.log
134219868 -rw-r--r-- 1 elasticsearch elasticsearch 29465 Apr 21 14:33 /elk/logs/ELKCluster.log
[root@linux-host6 ~]# yum install gcc gcc-c++ automake pcre pcre-devel zlip zlib-devel
openssl openssl-devel
[root@linux-host6 ~]# cd /usr/local/src/
[root@linux-host6 src]# wget http://nginx.org/download/nginx-1.10.3.tar.gz
[root@elk-web1 apps]#tar xvf nginx-1.16.1.tar.gz
[root@elk-web1 apps]#cd nginx-1.16.1/
[root@elk-web1 nginx-1.16.1]#./configure --prefix=/apps/nginx
[root@elk-web1 nginx-1.16.1]#make && make install
[root@elk-web1 nginx-1.16.1]# ln -sv /usr/local/nginx-1.10.3 /usr/local/nginx
‘ /usr/local/nginx’ -> ‘/usr/local/nginx-1.10.3’
[root@elk-web1 nginx-1.16.1]# cd /usr/local/nginx
[root@linux-host6 nginx]# vim conf/nginx.conf
48 location /web {
49 root html;
50 index index.html index.htm;
51 }
[root@linux-host6 nginx]# mkdir /usr/local/nginx/html/web
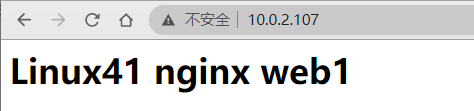
[root@elk-web1 ~]#cat /apps/nginx/html/index.html
<h1>Linux41 nginx web1</h1>
/usr/local/nginx/sbin/nginx -t #测试配置文件语法
/usr/local/nginx/sbin/nginx #启动服务
/usr/local/nginx/sbin/nginx -s reload #重读配置文件
[root@linux-host6 nginx]# /usr/local/nginx/sbin/nginx -t
nginx: the configuration file /usr/local/nginx-1.10.3/conf/nginx.conf syntax is ok
nginx: configuration file /usr/local/nginx-1.10.3/conf/nginx.conf test is successful
[root@linux-host6 nginx]# /usr/local/nginx/sbin/nginx
[root@linux-host6 nginx]# lsof -i:80
COMMAND PID USER FD TYPE DEVICE SIZE/OFF NODE NAME
nginx 17719 root 6u IPv4 90721 0t0 TCP *:http (LISTEN)
nginx 17720 nobody 6u IPv4 90721 0t0 TCP *:http (LISTEN)
[root@linux-host6 nginx]# vim conf/nginx.conf
log_format access_json '{"@timestamp":"$time_iso8601",'
        '"host":"$server_addr",'
        '"clientip":"$remote_addr",'
        '"size":$body_bytes_sent,'
        '"responsetime":$request_time,'
        '"upstreamtime":"$upstream_response_time",'
        '"upstreamhost":"$upstream_addr",'
        '"http_host":"$host",'
        '"url":"$uri",'
        '"domain":"$host",'
        '"xff":"$http_x_forwarded_for",'
        '"referer":"$http_referer",'
        '"status":"$status"}';
    access_log /var/log/nginx/access.log access_json;
[root@elk-web1 ~]#mkdir /var/log/nginx
[root@elk-web1 ~]#/apps/nginx/sbin/nginx -t
nginx: the configuration file /apps/nginx/conf/nginx.conf syntax is ok
nginx: configuration file /apps/nginx/conf/nginx.conf test is successful
[root@elk-web1 ~]#tail /var/log/nginx/access.log -f
{"@timestamp":"2020-09-29T15:19:09+08:00","host":"10.0.2.107","clientip":"10.0.0.1","size":28,"responsetime":0.000,"upstreamtime":"-","upstreamhost":"-","http_host":"10.0.2.107","url":"/index.html","domain":"10.0.2.107","xff":"-","referer":"-","status":"200"}
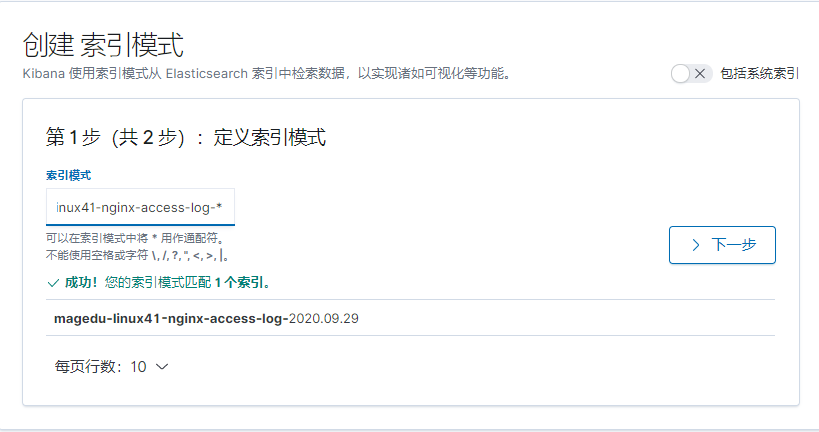
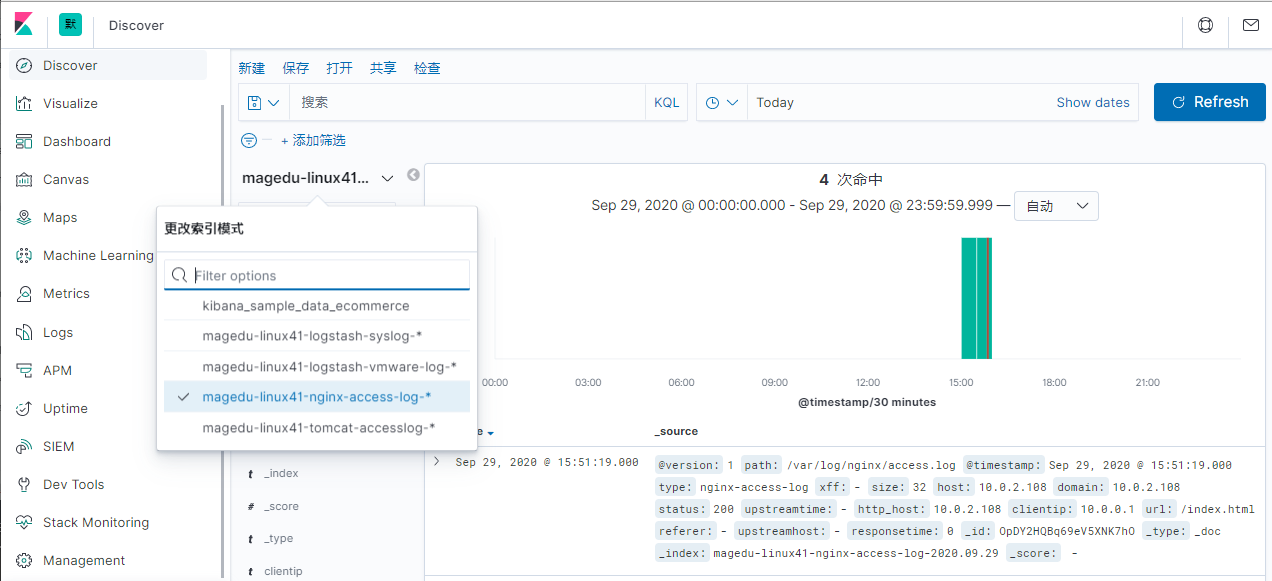
[root@elk-web1 ~]#cat /etc/logstash/conf.d/linux41-nginx-to-es.conf
input {
  file {
    path => "/var/log/nginx/access.log"
    type => "nginx-access-log"
    start_position => "beginning"
    codec => "json"
  }
}

output {
  if [type] == "nginx-access-log" {
  elasticsearch {
    hosts => ["10.0.2.101:9200"]
    index => "magedu-linux41-nginx-access-log-%{+YYYY.MM.dd}"
  }}
}
把web1上的nginx数据拷贝到web2上一份

通过 logstash 的 tcp/udp 插件收集日志, 通常用于在向 elasticsearch 日志补录丢失的部分日志, 可以将丢失的日志写到一个文件,然后通过 TCP 日志收集方式直接发送给 logstash 然后再写入到 elasticsearch 服务器。
https://www.elastic.co/guide/en/logstash/5.6/input-plugins.html
[root@linux-host6 ~]# cat /etc/logstash/conf.d/tcp.conf
input {
  tcp {
    port => 9998
    type => "tcplog"
    mode => "server"
    codec => json
  }
}

output {
  stdout {
    codec => rubydebug
  }
}
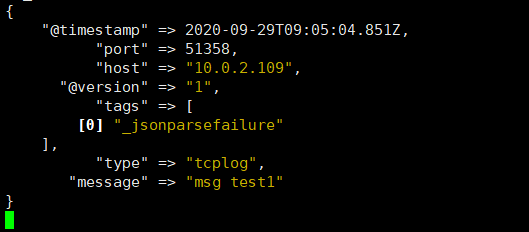
[root@elk-web1 ~]#/usr/share/logstash/bin/logstash -f /etc/logstash/conf.d/linux41-tcp-to-es.conf

NetCat 简称 nc,在网络工具中有“瑞士军刀”美誉,其功能实用, 是一个简单、可靠的网络工具,可通过 TCP 或 UDP 协议传输读写数据, 另外还具有很多其他功能。
[root@linux-host1 ~]# yum instll nc –y
[root@elk-web3 ~]#echo "msg test1" | nc 10.0.2.107 9998
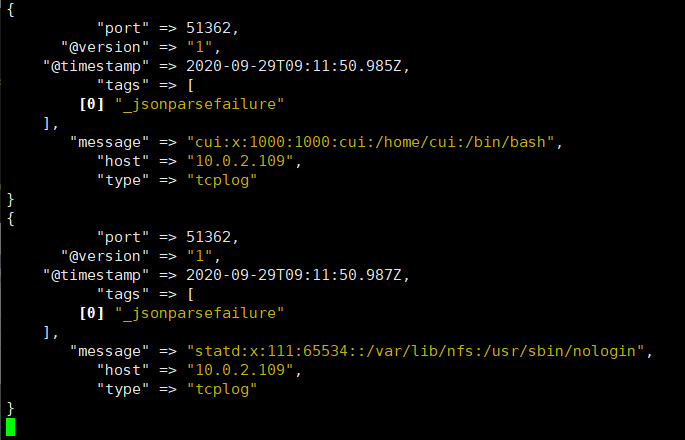
[root@elk-web3 ~]#nc 10.0.2.107 9998 < /etc/passwd
在类 Unix 操作系统中, 块设备有硬盘、内存的硬件,但是还有设备节点并不一定要对应物理设备, 我们把没有这种对应关系的设备是伪设备, 比如/dev/null,/dev/zero, /dev/random 以及/dev/tcp 和/dev/upd 等, Linux 操作系统使用这些伪设备提供了多种不通的功能, tcp 通信只是 dev 下面众多伪设备当中的一种设备。
[root@elk-web3 ~]#echo "伪设备1" > /dev/tcp/10.0.2.107/9998
为什么写不进去

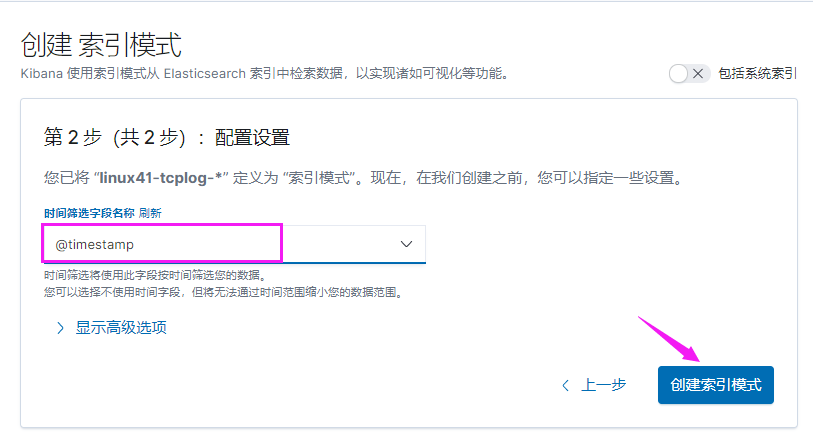
[root@elk-web1 ~]#cat /etc/logstash/conf.d/linux41-tcp-to-es.conf
input {
  tcp {
    port => 9998
    type => "tcp-log"
    mode => "server"
    codec => json
  }
}

output {
  if [type] == "tcp-log" {
    elasticsearch {
      hosts => ["10.0.2.101:9200"]
      index => "linux41-tcplog-%{+YYYY.ww}"
    }
  }
}

[root@elk-web1 ~]#systemctl restart logstash.service
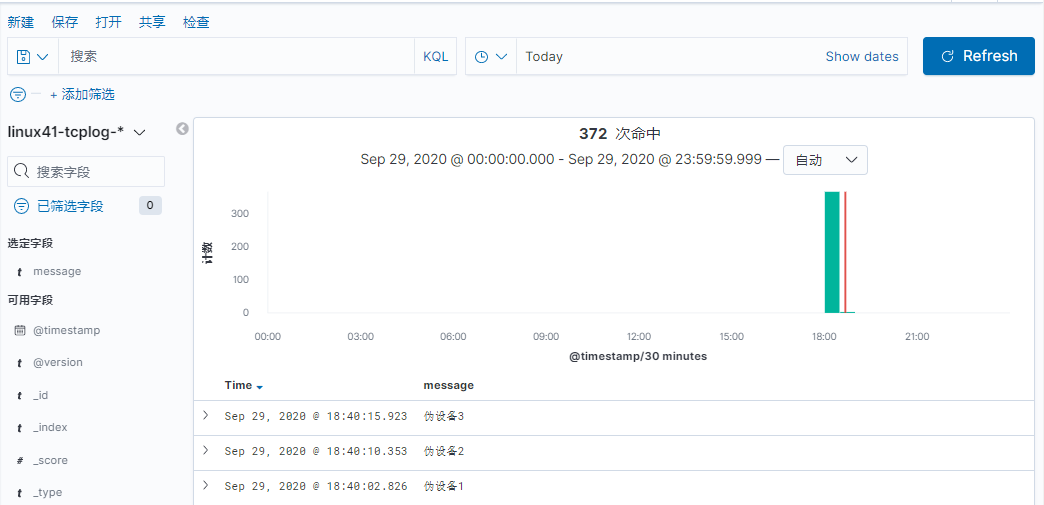
[root@elk-web3 ~]#echo "伪设备1" > /dev/tcp/10.0.2.107/9998
[root@elk-web3 ~]#echo "伪设备2" > /dev/tcp/10.0.2.107/9998
[root@elk-web3 ~]#echo "伪设备3" > /dev/tcp/10.0.2.107/9998

rsyslog 提供高性能,高安全性功能和模块化设计。 虽然它最初是作为常规系统日志开发的,但是 rsyslog 已经发展成为一种瑞士军刀,可以接受来自各种来源的输入,转换它们,并将结果输出到不同的目的地。
当应用有限的处理时, RSYSLOG 每秒可以向本地目的地传送超过一百万条消息。即使有远程目的地和更复杂的处理,性能通常被认为是“惊人的”。
在 centos 6 及之前的版本叫做 syslog, centos 7 开始叫做 rsyslog, 根据官方的介绍, rsyslog(2013 年版本)可以达到每秒转发百万条日志的级别, 官方网址 http://www.rsyslog.com/,确认系统安装的版本命令如下
[root@centos7 ~]#yum list rsyslog
Installed Packages
rsyslog.x86_64                               8.24.0-52.el7_8.2                               updates

[root@centos7 ~]#yum install -y rsyslog
[root@linux-host2 ~]# cd /usr/local/src/
[root@linux-host2 src]# tar xvf haproxy-1.7.5.tar.gz
[root@linux-host2 src]# cd haproxy-1.7.5
[root@linux-host2 haproxy-1.7.5]# yum install gcc pcre pcre-devel openssl
openssl-devel –y
[root@linux-host2 haproxy-1.7.5]# make TARGET=linux2628 USE_PCRE=1
USE_OPENSSL=1 USE_ZLIB=1 PREFIX=/usr/local/haproxy
[root@linux-host2 haproxy-1.7.5]# make install PREFIX=/usr/local/haproxy
[root@linux-host2 haproxy-1.7.5]# /usr/local/haproxy/sbin/haproxy -v #确认版本
HA-Proxy version 1.7.5 2017/04/03
Copyright 2000-2017 Willy Tarreau <willy@haproxy.org
[root@linux-host2 haproxy-1.7.5]# vim /usr/lib/systemd/system/haproxy.service
[Unit]
Description=HAProxy Load Balancer
After=syslog.target network.target
[Service]
EnvironmentFile=/etc/sysconfig/haproxy
ExecStart=/usr/sbin/haproxy-systemd-wrapper -f /etc/haproxy/haproxy.cfg -p
/run/haproxy.pid $OPTIONS
ExecReload=/bin/kill -USR2 $MAINPID
[Install]
WantedBy=multi-user.target
[root@linux-host2 haproxy-1.7.5]# cp /usr/local/src/haproxy-1.7.5/haproxy-systemdwrapper /usr/sbin/
[root@linux-host2 haproxy-1.7.5]# cp /usr/local/src/haproxy-1.7.5/haproxy /usr/sbin/
[root@linux-host2 haproxy-1.7.5]# vim /etc/sysconfig/haproxy #系统级配置文件

# Add extra options to the haproxy daemon here. This can be useful for

# specifying multiple configuration files with multiple -f options.

# See haproxy(1) for a complete list of options.

OPTIONS=""[root@linux-host2 haproxy-1.7.5]# mkdir /etc/haproxy
[root@linux-host2 haproxy-1.7.5]# cat /etc/haproxy/haproxy.cfg
global
maxconn 100000
chroot /usr/local/haproxy
uid 99
gid 99
daemon
nbproc 1
pidfile /usr/local/haproxy/run/haproxy.pid
log 127.0.0.1 local6 info
defaults
option http-keep-alive
option forwardfor
maxconn 100000
mode http
timeout connect 300000ms
timeout client 300000ms
timeout server 300000ms
listen stats
 mode http
 bind 0.0.0.0:9999
 stats enable
 log global
 stats uri /haproxy-status
 stats auth haadmin:123456
#frontend web_port
frontend web_port
bind 0.0.0.0:80
mode http
option httplog
log global
option forwardfor
###################ACL Setting##########################
acl pc hdr_dom(host) -i www.elk.com
acl mobile hdr_dom(host) -i m.elk.com
###################USE ACL##############################
use_backend pc_host if pc
use_backend mobile_host if mobile
########################################################backend pc_host
mode http
option httplog
balance source
server web1 192.168.15.11:80 check inter 2000 rise 3 fall 2 weight 1
backend mobile_host
mode http
option httplog
balance source
server web1 192.168.15.11:80 check inter 2000 rise 3 fall 2 weight 1
或者
frontend kibana_web_port
bind 192.168.15.12:80
mode http
log global #必须开启日志
default_backend kibana_web_http_nodes
backend kibana_web_http_nodes
mode http
#balance source
balance roundrobin
cookie SESSION_COOKIE insert indirect nocache
#option httpchk GET /XXX/XXX.
server 192.168.15.11 192.168.15.11:5601 cookie kafka-web1 check inter
2000 fall 3 rise
5
listen kibana
bind 192.168.7.105:5601
mode tcp
server 192.168.7.101 192.168.7.101:5601 check inter 3s fall 3 rise 5
本实验用yum安装的haproxy来演示
[root@centos7 ~]#yum install -y haproxy

[root@centos7 ~]#vim /etc/haproxy/haproxy.cfg
listen stats
 mode http
 bind 0.0.0.0:9999
 stats enable
 log global
 stats uri /haproxy-status
 stats auth haadmin:123456
[root@linux-host2 ~]# vim /etc/rsyslog.conf
$ModLoad imudp
$UDPServerRun 514
$ModLoad imtcp
$InputTCPServerRun 514 #去掉 15/16/19/20 行前面的注释
local5.* /var/log/haproxy.log #测试可以正常将日志写入本地自定义文件
local5.* @@192.168.15.11:516 #最后面一行添加, local6 对应 haproxy 配置文件定义的 local 级别
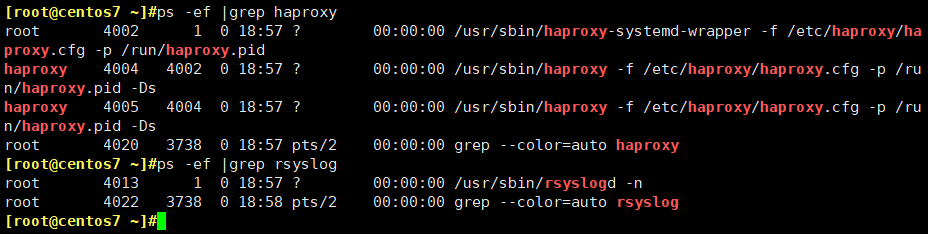
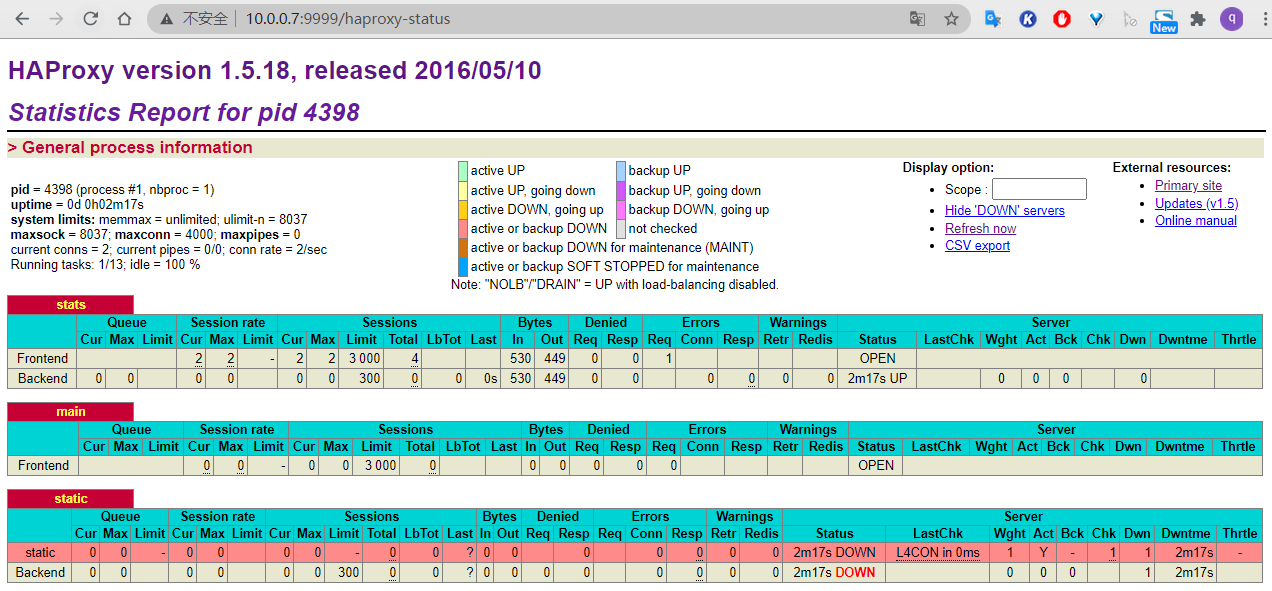
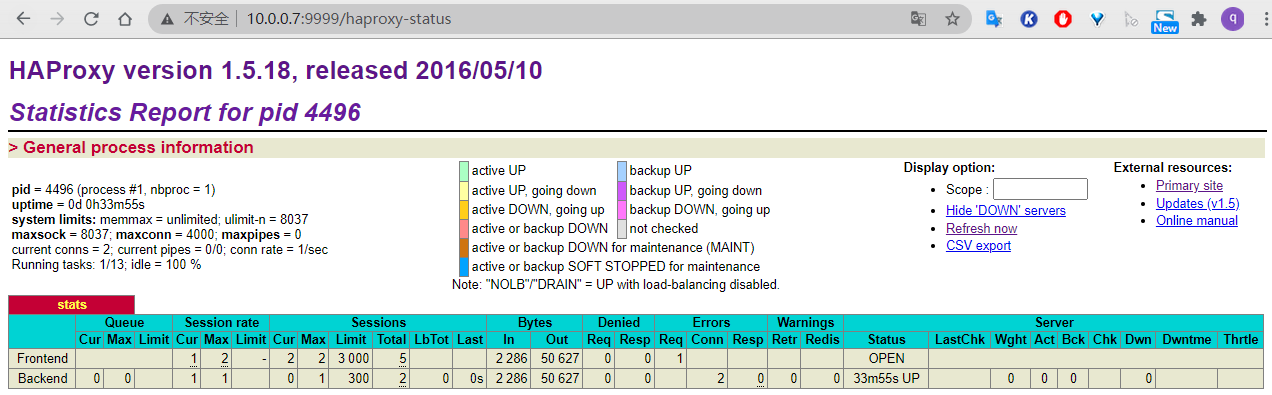
[root@centos7 ~]#systemctl restart haproxy.service
[root@centos7 ~]#systemctl restart rsyslog
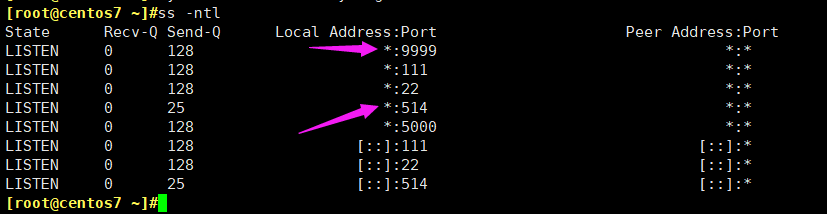
确认服务进程已经存在
C:\Windows\System32\drivers\etc
192.168.15.12 www.elk.com
192.168.15.12 m.elk.com
启动后端 web 服务器的 nginx
[root@linux-host1 ~]# /usr/local/nginx/sbin/nginx
确认可以访问到 nginx 的 web 界面
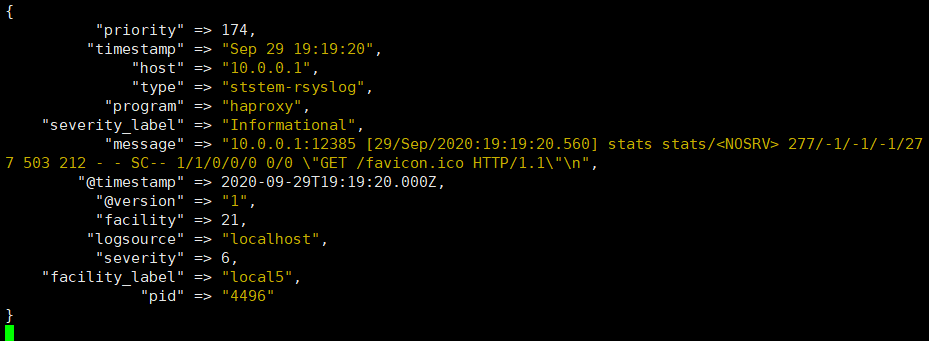
配置 logstash 监听一个本地端口作为日志输入源, haproxy 服务器的 rsyslog 输出 IP 和端口要等同于 logstash 服务器监听的 IP:端口, 本次的配置是在 Host1 上开启 logstash,在 Host2 上收集 haproxy 的访问日志并转发至 Host1 服务器的logstash 进行处理, logstash 的配置文件如下
[root@elk-web1 ~]#vim /etc/logstash/conf.d/linux41-rsyslog-to-es.conf
input{
  syslog {
    type => "ststem-rsyslog"
    port => "514" #监听一个本地的端口
  }
}

output{
  stdout{
    codec => rubydebug
  }
}
[root@linux-host1 conf.d]# /usr/share/logstash/bin/logstash -f
/etc/logstash/conf.d/rsyslog.conf
添加本地解析
[root@linux-host1 ~]# tail –n2 /etc/hosts
192.168.15.12 www.elk.com
192.168.15.12 m.elk.com

[root@linux-host1 ~]# curl http://www.elk.com/nginxweb/index.html
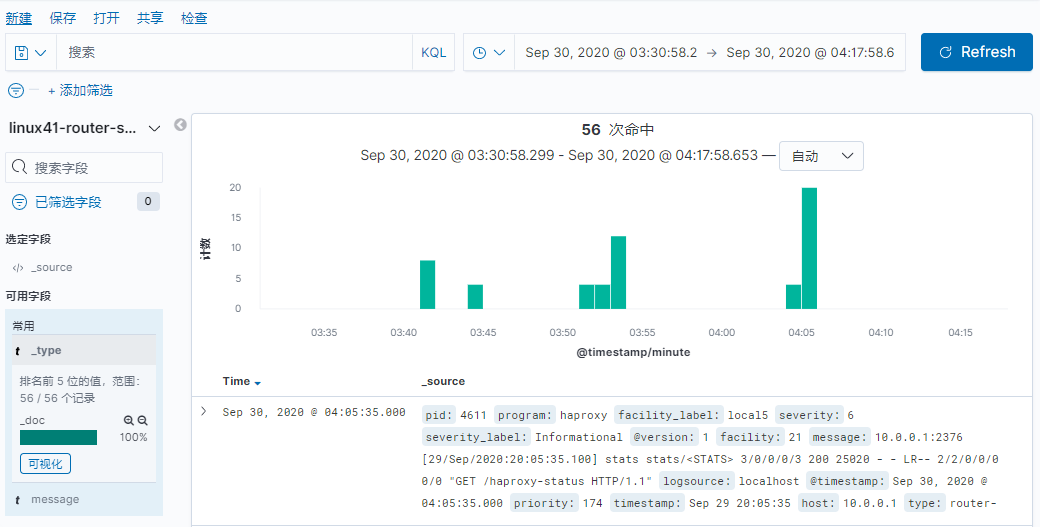
[root@elk-web1 ~]#cat /etc/logstash/conf.d/linux41-rsyslog-to-es.conf
input {
syslog {
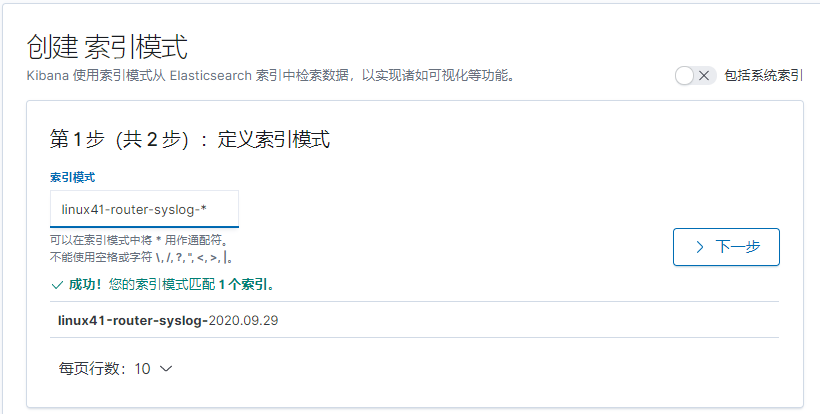
type => "router-syslog"
port => "514"
}
}
output{
if [type] == "router-rsyslog" {
elasticsearch {
hosts => ["10.0.2.101"]
index => "linux41-router-syslog-%{+YYYY.MM.dd}"
}
}
}
[root@linux-host6 conf.d]# systemctl restart logstash

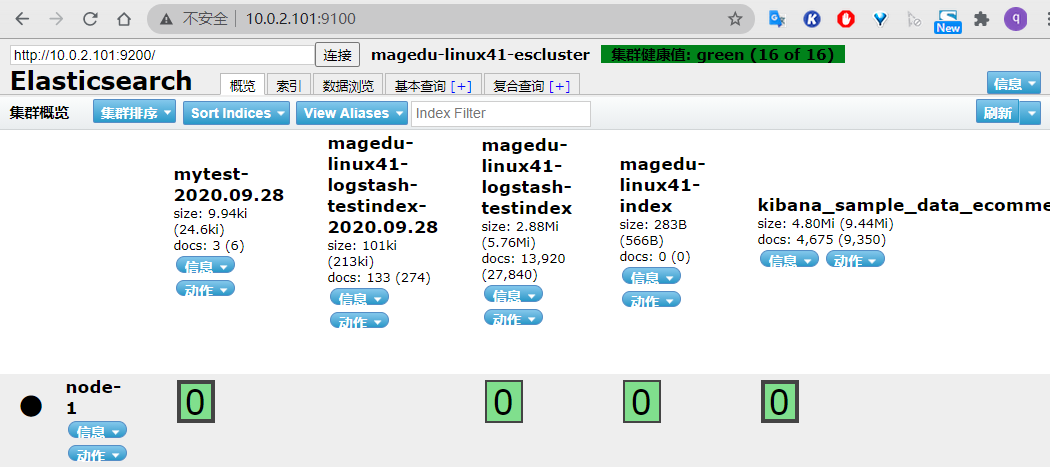
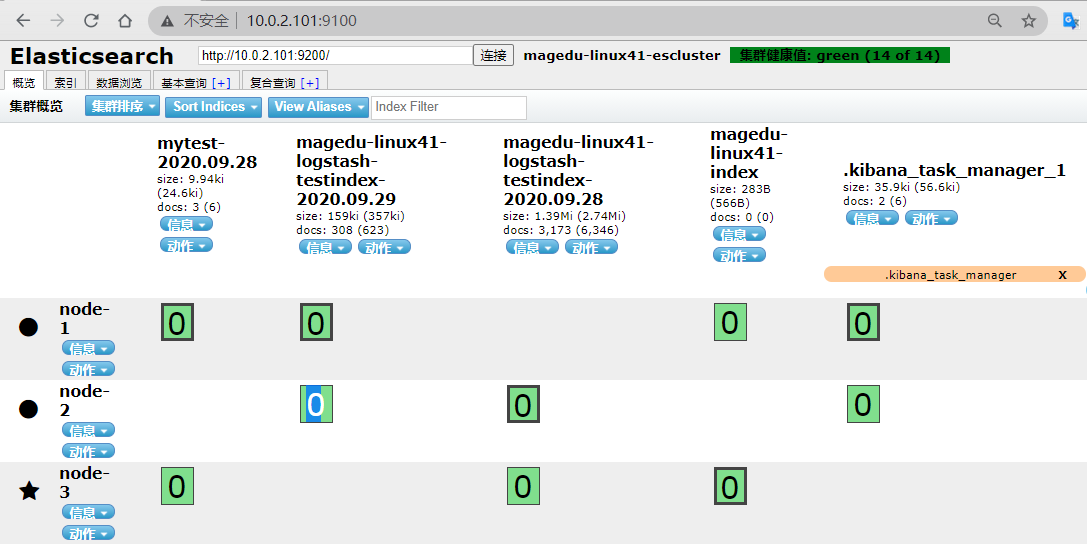
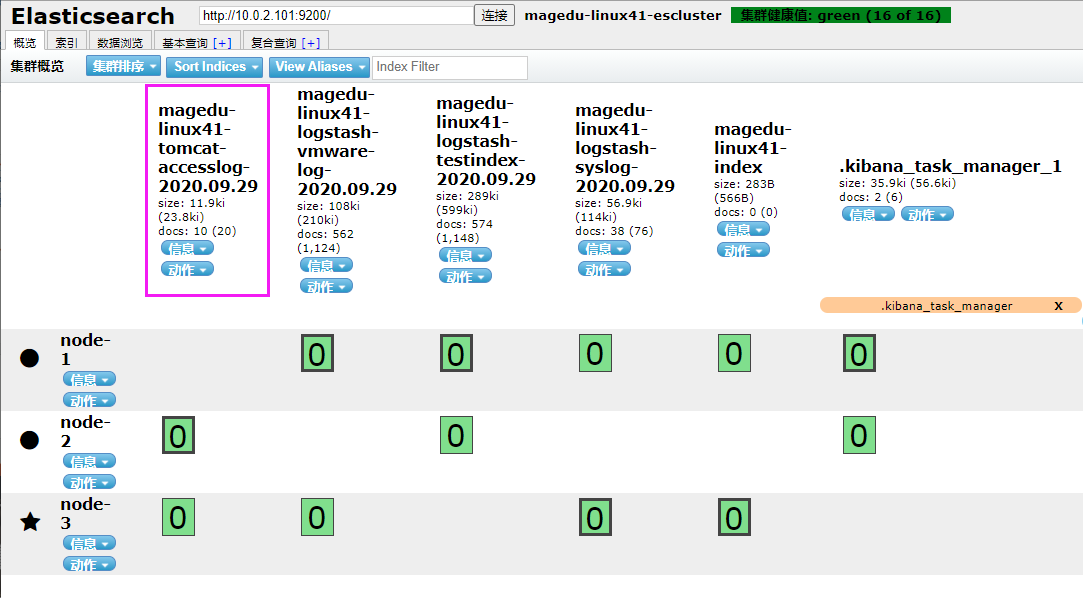
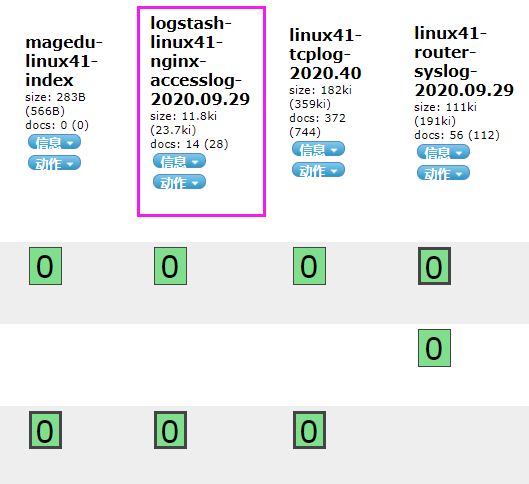
访问 head 插件以确认生成 index:

用一台服务器按照部署 redis 服务, 专门用于日志缓存使用, 用于 web 服务器产生大量日志的场景, 例如下面的服务器内存即将被使用完毕,查看是因为 redis服务保存了大量的数据没有被读取而占用了大量的内存空间。
推荐redis版本2.8或者3.0以上
整体架构
[root@linux-host2 ~]# cd /usr/local/src/
[root@linux-host2 src]# wget http://download.redis.io/releases/redis-3.2.8.tar.gz
[root@linux-host2 src]# tar xvf redis-3.2.8.tar.gz
[root@linux-host2 src]# ln -sv /usr/local/src/redis-3.2.8 /usr/local/redis
‘ /usr/local/redis’ -> ‘/usr/local/src/redis-3.2.8’
[root@linux-host2 src]#cd /usr/local/redis/deps
[root@linux-host2 redis]# yum install gcc
[root@linux-host2 deps]# make geohash-int hiredis jemalloc linenoise lua
[root@linux-host2 deps]# cd ..
[root@linux-host2 redis]# make
[root@linux-host2 redis]# vim redis.conf
[root@linux-host2 redis]# grep "^[a-Z]" redis.conf #主要改动的地方
bind 0.0.0.0
protected-mode yes
port 6379
tcp-backlog 511
timeout 0
tcp-keepalive 300
daemonize yes
supervised no
pidfile /var/run/redis_6379.pid
loglevel notice
logfile ""
databases 16
save ""
rdbcompression no #是否压缩
rdbchecksum no #是否校验
[root@linux-host2 redis]# ln -sv /usr/local/redis/src/redis-server /usr/bin/
‘ /usr/bin/redis-server’ -> ‘/usr/local/redis/src/redis-server’
[root@linux-host2 redis]# ln -sv /usr/local/redis/src/redis-cli /usr/bin/
‘ /usr/bin/redis-cli’ -> ‘/usr/local/redis/src/redis-cli’
本实验使用apt安装的redis
[root@redis ~]#apt install redis
[root@redis ~]#vim /etc/redis/redis.conf
bind 0.0.0.0
requirepass 123456

[root@redis ~]#systemctl restart redis
为安全考虑, 生产环境必须设置 reids 连接密码
[root@linux-host2 redis]# redis-cli
127.0.0.1:6379> config set requirepass 12345678 #动态设置, 重启后无效
OK
480 requirepass 123456 #redis.conf 配置文件
[root@linux-host2 redis]# redis-server /usr/local/redis/redis.conf #启动服务
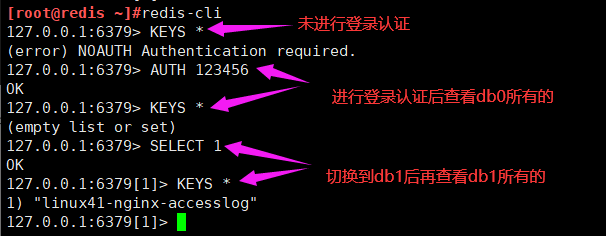
[root@redis ~]#redis-cli
127.0.0.1:6379> AUTH 123456
OK
127.0.0.1:6379> SELECT 1
OK
127.0.0.1:6379[1]> ping
PONG
将 tomcat 服务器的 logstash 收集之后的 tomcat 访问日志写入到 redis 服务器,然后通过另外的 logstash 将 redis 服务器的数据取出在写入到 elasticsearch 服务器。
官 方 文 档 https://www.elastic.co/guide/en/logstash/current/plugins-outputsredis.html
#直接修改了之前实验的配置文件
[root@elk-web1 ~]#vim /etc/logstash/conf.d/linux41-nginx-to-es.conf
input {
  file {
    path => "/usr/local/tomcat/logs/tomcat_access_log.*.log"
    type => "tomcat-accesslog-1512"
    start_position => "beginning"
    stat_interval => "2"
    codec => "json" #对 json 格式日志进行 json 解析
  }
  tcp {
    port => 7800
    mode => "server"
    type => "tcplog-1512"
  }
}

output {
  if [type] == "tomcat-accesslog-1512" {
    redis {
      data_type => "list"key => "tomcat-accesslog-1512"
      host => "192.168.15.12"
      port => "6379"
      db => "0"
      password => "123456"
  }}
  if [type] == "tcplog-1512" {
    redis {
      data_type => "list"
      key => "tcplog-1512"
      host => "192.168.15.12"
      port => "6379"
      db => "1"
      password => "123456"
  }}
}

#本实验配置
[root@elk-web1 ~]#cat /etc/logstash/conf.d/linux41-nginx-to-es.conf
input {
  file {
    path => "/var/log/nginx/access.log"
    type => "nginx-access-log"
    start_position => "beginning"
    codec => "json"
  }
}

output {
  if [type] == "nginx-access-log" {
  redis {
    host => "10.0.2.105"
    port => "6379"
    password => 123456
    db => 1
    data_type => list
    key => "linux41-nginx-accesslog"
  }}
}
[root@elk-web1 ~]#/usr/share/logstash/bin/logstash -f /etc/logstash/conf.d/linux41-nginx-to-es.conf -t
[root@linux-host1 ~]# echo "伪设备 1" > /dev/tcp/192.168.15.12/7800

可以通过客户端工具去看
RedisClient
logstash服务器:先配置java环境
[root@logstash-to-es ~]#dpkg -i logstash-7.6.2.deb
配置专门 logstash 服务器从 redis 读取指定的 key 的数据,并写入到 elasticsearch。
[root@linux-host3 ~]# cat /etc/logstash/conf.d/redis-to-els.conf
[root@logstash-to-es ~]#vim /etc/logstash/conf.d/linux41-nginx-accesslog-to-es.conf
input {
redis {
host => "10.0.2.105"
port => "6379"
password => 123456
db => 1
data_type => list
key => "linux41-nginx-accesslog"
codec => "json" #json 解析
}
}
redis {
data_type => "list"
key => "tcplog-1512"
host => "192.168.15.12"
port => "6379"
db => "1"
password => "123456"
}
}
output {
if [type] == "nginx-access-log" {
elasticsearch {
hosts => ["10.0.2.101:9200"]
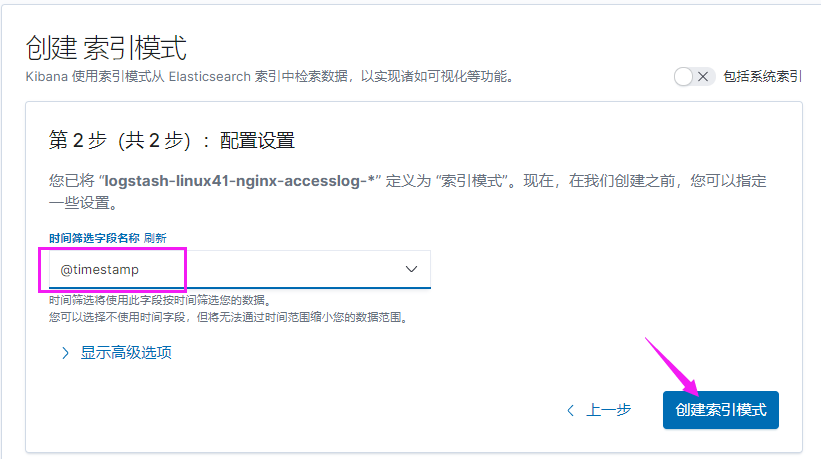
index => "logstash-linux41-nginx-accesslog-%{+YYYY.MM.dd}"
}
}
if [type] == "tcplog-1512" {
elasticsearch {
hosts => ["192.168.15.11:9200"]
index => "logstash-tcplog1512-%{+YYYY.MM.dd}"
}}
}
[root@logstash-to-es ~]#/usr/share/logstash/bin/logstash -f /etc/logstash/conf.d/linux41-nginx-accesslog-to-es.conf
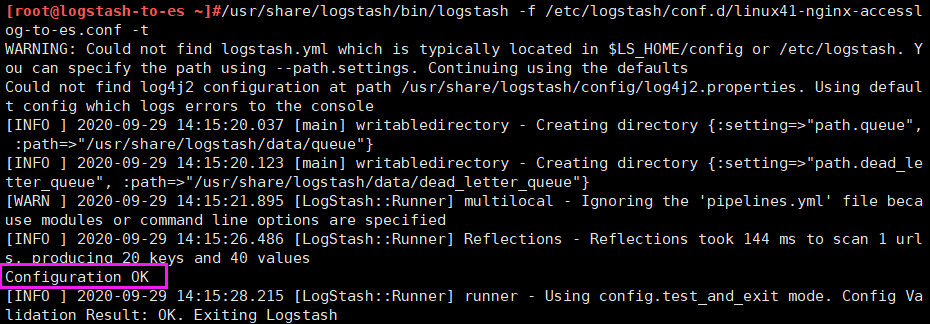
#注 测试没有问题之后, 请将 logstash 使用服务的方式正常启动
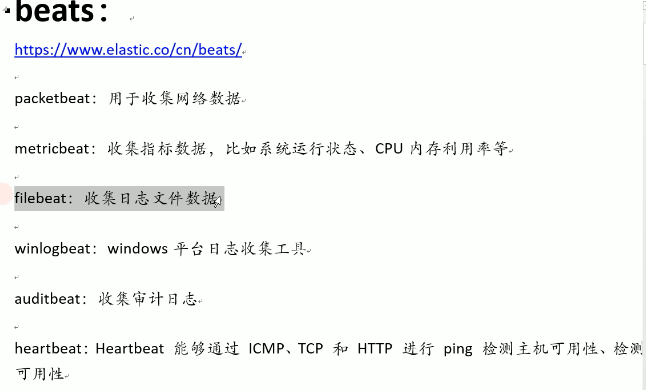
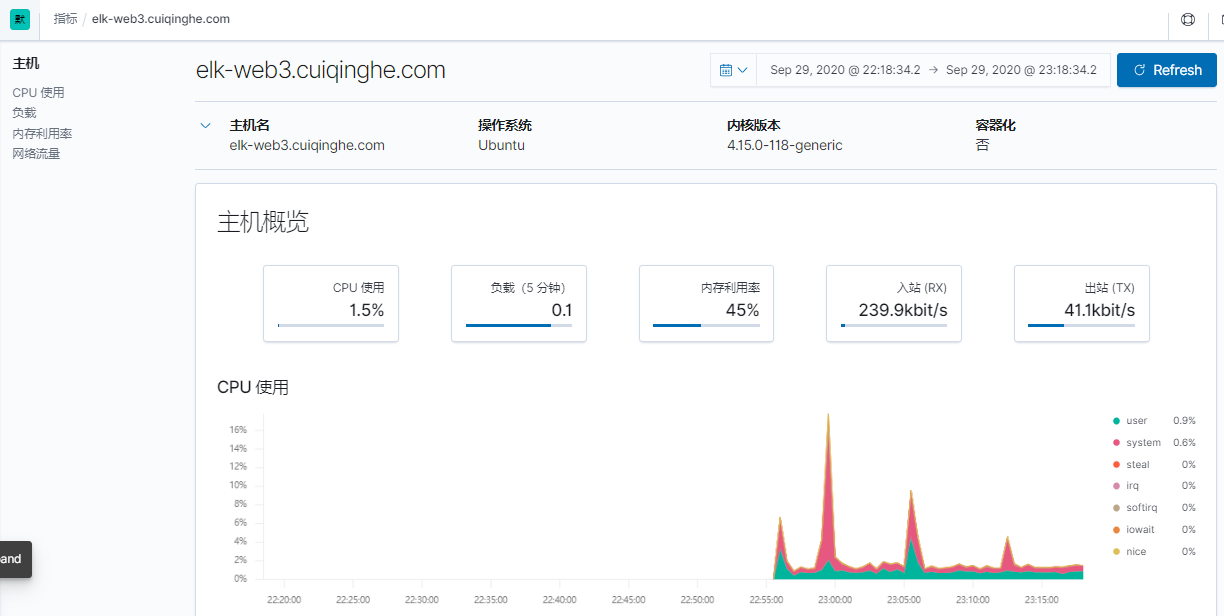
metricbeat使用方法:
[root@elk-web3 ~]#dpkg -i metricbeat-7.6.2-amd64.deb
[root@elk-web3 ~]#vim /etc/metricbeat/metricbeat.yml
setup.kibana:
  # Kibana Host
  # Scheme and port can be left out and will be set to the default (http and 5601)
  # In case you specify and additional path, the scheme is required: http://localhost:5601/path
  # IPv6 addresses should always be defined as: https://[2001:db8::1]:5601
  host: "10.0.2.101:5601"

output.elasticsearch:
  # Array of hosts to connect to.
  hosts: ["10.0.2.102:9200"]


[root@elk-web3 ~]#systemctl restart metricbeat.service
[root@elk-web3 ~]#systemctl enable metricbeat.service
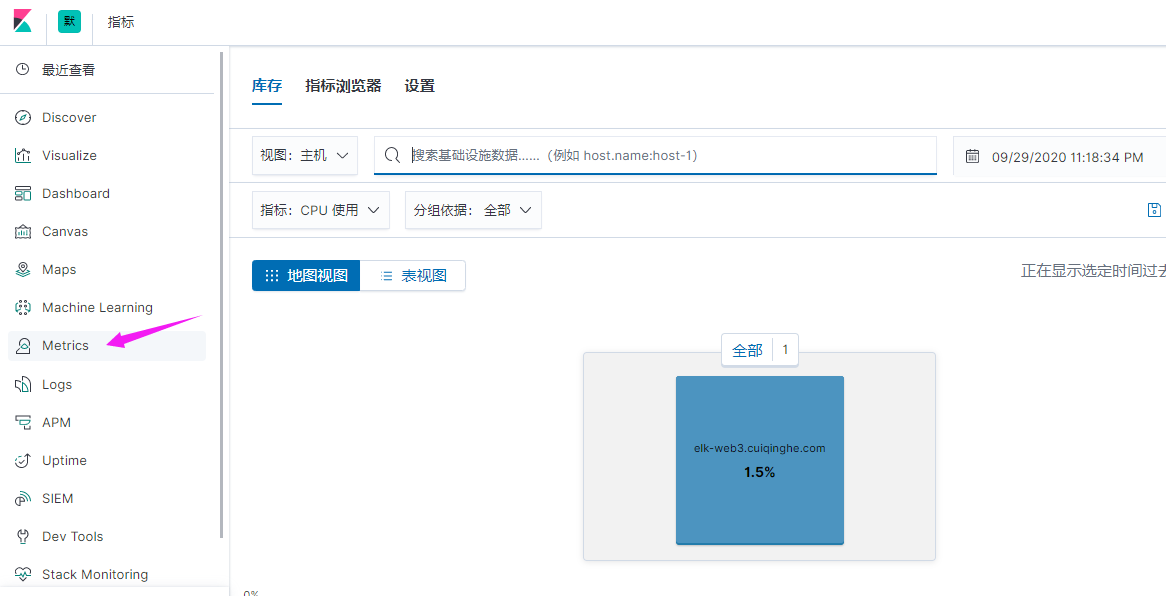
点击查看指标,就类似于zabbix监控
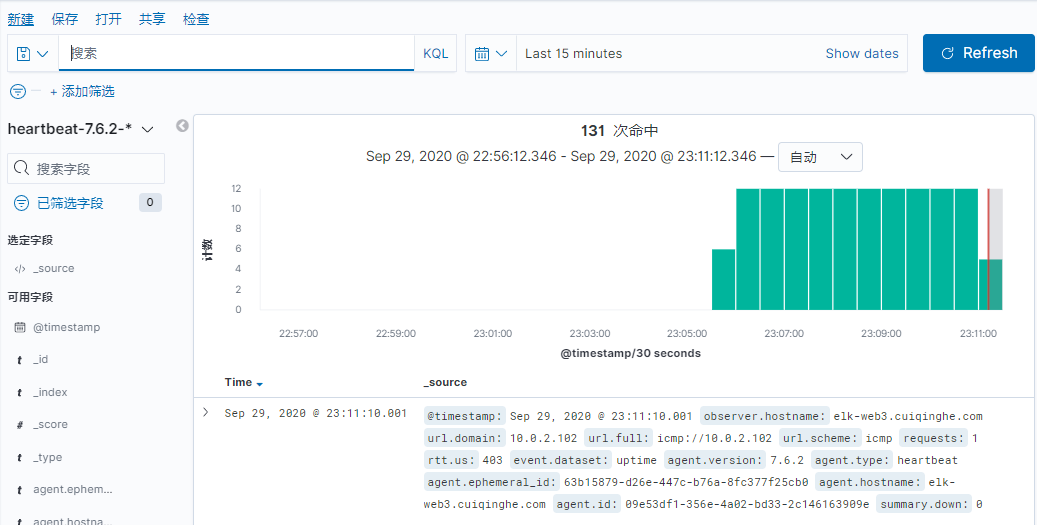
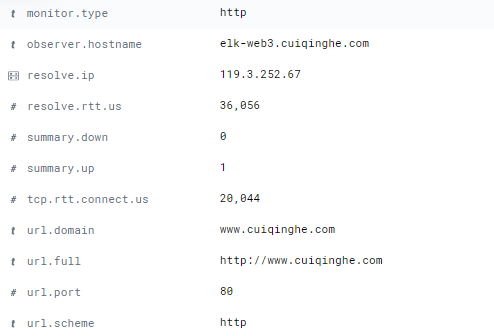
heartbeat使用方法:
[root@elk-web3 ~]#dpkg -i heartbeat-7.6.2-amd64.deb

[root@elk-web3 ~]#vim /etc/heartbeat/heartbeat.yml
- type: http
  # List or urls to query
  urls: ["http://www.cuiqinghe.com","http://www.baidu.com"]

- type: icmp
  schedule: '*/5 * * * * * *'
  hosts: ["10.0.2.102"]

setup.kibana:
  host: "10.0.2.101:5601"

output.elasticsearch:
  hosts: ["10.0.2.103:9200"]


[root@elk-web3 ~]#systemctl restart heartbeat-elastic.service
[root@elk-web3 ~]#systemctl enable heartbeat-elastic.service


安装过程见 kafka 安装文档,这里简单说一下:
#三台机器同时开启zookeeper
/apps/zookeeper/bin/zkServer.sh start

#后台开启kafka
/apps/kafka/bin/kafka-server-start.sh /apps/kafka/config/server.properties &
官方文档:https://www.elastic.co/guide/en/logstash/7.6/plugins-outputs-kafka.html
[root@linux-host2 ~]# cat /etc/logstash/conf.d/nginx-kafka.conf
input {
  file {
    path => "/var/log/nginx/access.log"
    start_position => "beginning"
    type => "nginx-accesslog-1512"
    codec => "json" #声明 json 编码格式
  }
}

output {
  if [type] == "nginx-accesslog-1512" {
    kafka {
      bootstrap_servers => "10.0.4.101:9092" #kafka 服务器地址
      topic_id => "nginx-accesslog-1512"
      codec => "json"
}
  file {
    path => "/tmp/nginx-jsog-log.txt"
  }
}
}
本实验最终配置如下:
[root@elk-web1 ~]#cat /etc/logstash/conf.d/linux41-nginx-to-kafka.conf
input {
  file {
    path => "/var/log/nginx/access.log"
    type => "nginx-access-log"
    start_position => "beginning"
    codec => "json"
  }
}

output {
  if [type] == "nginx-access-log" {
  kafka {
    bootstrap_servers => "10.0.4.101:9092"
    topic_id => "magedu-linux41-nginx-accesslog"
    codec => "json"
  }}
}
[root@elk-web1 ~]#/usr/share/logstash/bin/logstash -f /etc/logstash/conf.d/linux41-nginx-to-kafka.conf -t
[WARN ] 2020-09-30 01:22:46.995 [LogStash::Runner] multilocal - Ignoring the 'pipelines.yml' file because modules or command line options are specified
[INFO ] 2020-09-30 01:22:51.411 [LogStash::Runner] Reflections - Reflections took 182 ms to scan 1 urls, producing 20 keys and 40 values
Configuration OK

[root@elk-web1 ~]#systemctl restart logstash.service
[root@linux-host2 ~]# ab -n100 -c10 http://10.0.2.107/index.html
浏览器访问一下107

[root@linux-host2 ~]# head /tmp/nginx-jsog-log.txt
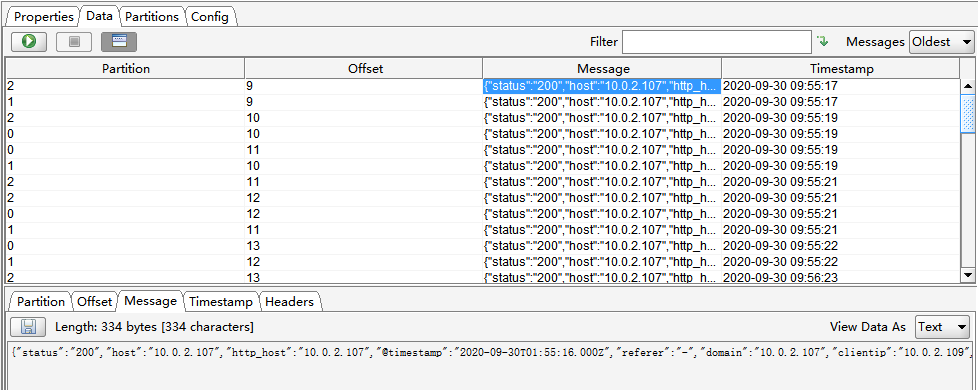
[root@elk-web1 ~]#vim /etc/logstash/conf.d/linux41-nginx-accesslog-to-es.conf
input {
kafka {
bootstrap_servers => "10.0.4.101:9092"
topics => "magedu-linux41-nginx-accesslog"
codec => "json"
consumer_threads => 1
#decorate_events => true #是否装饰事件
}
}
output {
if [type] == "nginx-access-log" {
elasticsearch {
hosts => ["10.0.2.101"]
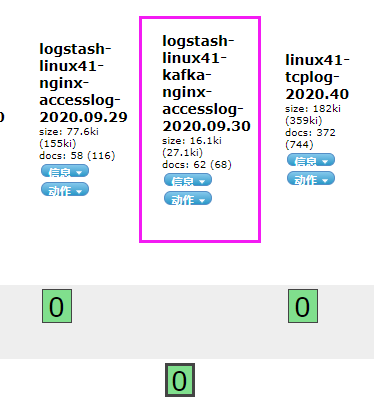
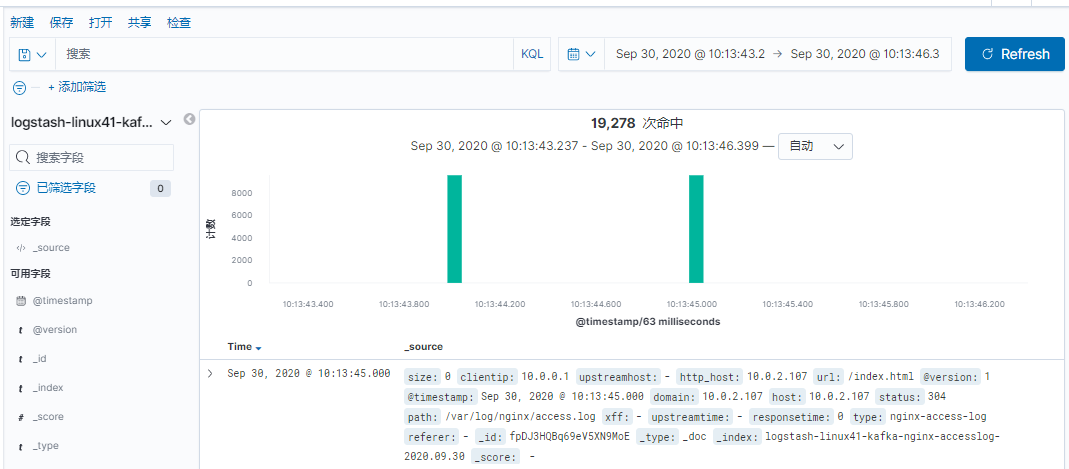
index => "logstash-linux41-kafka-nginx-accesslog-%{+YYYY.MM.dd}"
}}
}
[root@elk-web1 ~]#/usr/share/logstash/bin/logstash -f /etc/logstash/conf.d/linux41-nginx-accesslog-to-es.conf -t
[root@elk-web1 ~]#systemctl restart logstash.service
[root@linux-host2 ~]# chmod 644 /var/log/messages
[root@linux-host2 conf.d]# cat nginx-kafka.conf
input {
  file {
    path => "/var/log/nginx/access.log"
    start_position => "beginning"
    type => "nginx-accesslog-1512"
    codec => "json"
}
  file {
    path => "/var/log/messages"
    start_position => "beginning"
    type => "system-log-1512"
  }
}
output {
  if [type] == "nginx-accesslog-1512" {
    kafka {
bootstrap_servers => "192.168.15.11:9092"
topic_id => "nginx-accesslog-1512"
batch_size => 5
codec => "json"
  }}
  if [type] == "system-log-1512" {
    kafka {
      bootstrap_servers => "192.168.15.11:9092"
      topic_id => "system-log-1512"
      batch_size => 5
      codec => "json" #写入的时候使用 json 编码, 因为 logstash 收集后会转换
成 json 格式
  }
    file {
      path => "/tmp/systemlog-1512-log.txt"
  }}
}
本实验最终配置如下:
[root@elk-web1 ~]#cat /etc/logstash/conf.d/linux41-log-es.conf
input {
  file {
    path => "/var/log/syslog"
    start_position => "beginning"
    stat_interval => "3"
    type => "systemlog"
  }

  file {
    path => "/var/log/vmware-network*"
    start_position => "beginning"
    stat_interval => "3"
    type => "vmware-log"
  }

  file {
    path =>  "/apps/apache-tomcat-8.5.57/logs/tomcat_access_log.*.log"
    start_position => "beginning"
    stat_interval => "3"
    type => "tomcat-accesslog"
  }
}

output {
  if [type] == "systemlog" {
  #elasticsearch {
  #  hosts => ["10.0.2.101"]
  #  index => "magedu-linux41-logstash-syslog-%{+YYYY.MM.dd}"
  #}}

  kafka {
    bootstrap_servers => "10.0.4.101:9092"
    topic_id => "magedu-linux41-nginx-systemlog"
    codec => "json"
  }}

  if [type] == "vmware-log" {
  elasticsearch {
    hosts => ["10.0.2.102"]
    index => "magedu-linux41-logstash-vmware-log-%{+YYYY.MM.dd}"
  }}

  if [type] == "tomcat-accesslog" {
  elasticsearch {
    hosts => ["10.0.2.102"]
    index => "magedu-linux41-tomcat-accesslog-%{+YYYY.MM.dd}"
  }}
}
[root@linux-host2 ~]# /usr/share/logstash/bin/logstash -f /etc/logstash/conf.d/nginxkafka.conf -t
[root@linux-host2 ~]# systemctl restart logstash
#此步骤如果没有从 kafka 正确收集日志或者将日志从 kafka 读取并写入到文件没有输出,可以使用/usr/share/logstash/bin/logstash -f /etc/logstash/conf.d/kafkaes.conf 进行标准输出测试。
[root@linux-host1 ~]# cat /etc/logstash/conf.d/kafka-es.conf
input {
  kafka {
    bootstrap_servers => "192.168.15.11:9092"
    topics => "nginx-accesslog-1512"
    codec => "json"consumer_threads => 1
    decorate_events => true
}

  kafka {
    bootstrap_servers => "192.168.15.11:9092"
    topics => "system-log-1512"
    consumer_threads => 1
    decorate_events => true
    codec => "json"
  }
}

output {
  if [type] == "nginx-accesslog-1512" {
  elasticsearch {
    hosts => ["192.168.15.11:9200"]
    index => "nginx-accesslog-1512-%{+YYYY.MM.dd}"
  }}

  if [type] == "system-log-1512" {
  elasticsearch {
    hosts => ["192.168.15.12:9200"]
    index => "system-log-1512-%{+YYYY.MM.dd}"
  }
  stdout {
    codec => "rubydebug"
    }
  }
}
实验最终配置如下:
[root@elk-web1 ~]#vim /etc/logstash/conf.d/linux41-nginx-accesslog-to-es.conf
input {
kafka {
bootstrap_servers => "10.0.4.101:9092"
topics => "magedu-linux41-nginx-accesslog"
codec => "json"
consumer_threads => 1
#decorate_events => true #是否装饰事件
}
kafka {
bootstrap_servers => "10.0.4.101:9092"
topics => "magedu-linux41-nginx-systemlog"
codec => "json"
consumer_threads => 1
#decorate_events => true #是否装饰事件
}
}
output {
if [type] == "nginx-access-log" {
elasticsearch {
hosts => ["10.0.2.101"]
index => "logstash-linux41-kafka-nginx-accesslog-%{+YYYY.MM.dd}"
}}
if [type] == "systemlog" {
elasticsearch {
hosts => ["10.0.2.101"]
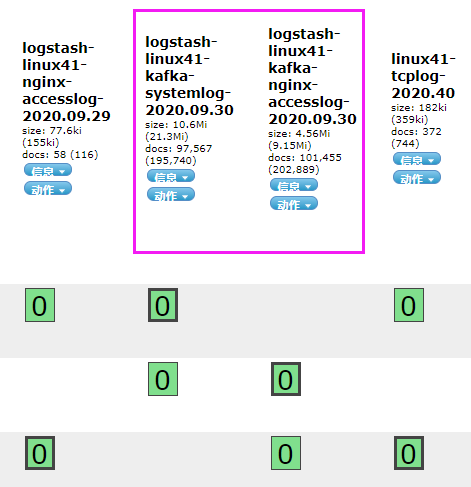
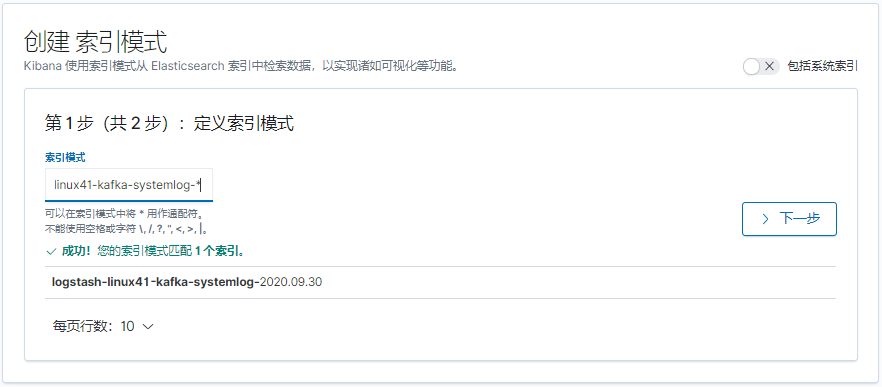
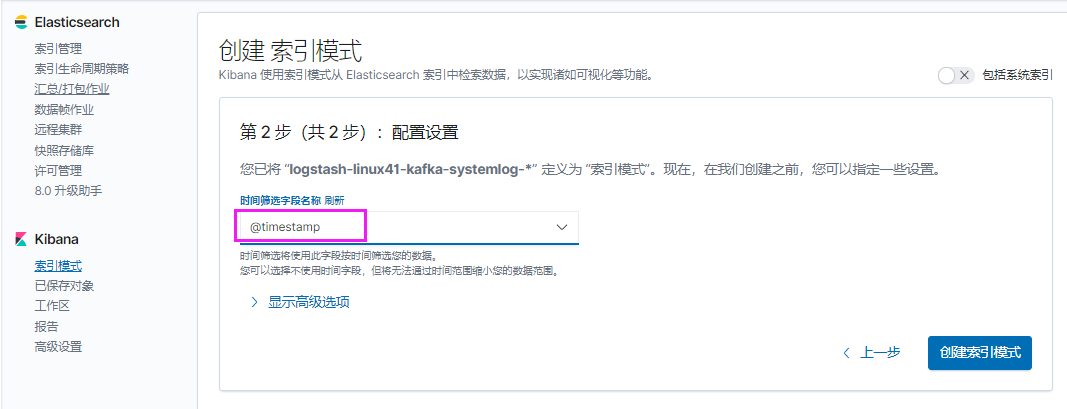
index => "logstash-linux41-kafka-systemlog-%{+YYYY.MM.dd}"
}}
}
[root@elk-web1 ~]#/usr/share/logstash/bin/logstash -f /etc/logstash/conf.d/linux41-nginx-accesslog-to-es.conf -t
[root@elk-web1 ~]#systemctl restart logstash.service
[root@elk-web1 ~]#echo "111111" >> /var/log/syslog
[root@elk-web1 ~]#echo "222222" >> /var/log/syslog
[root@elk-web1 ~]#echo "333333" >> /var/log/syslog
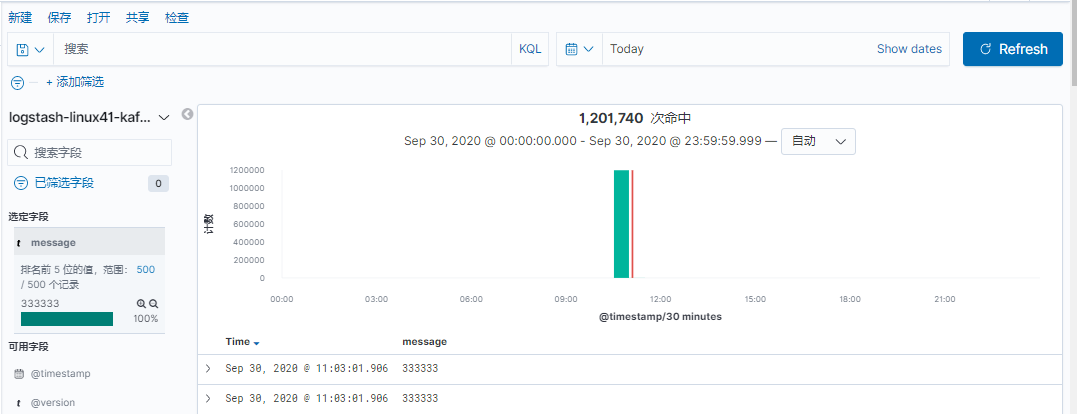
本实验使用Ubuntu
[root@linux-host2 src]# yum install filebeat-5.6.5-x86_64.rpm –y

#Ubuntu安装方法
[root@elk-web1 ~]#dpkg -i filebeat-7.6.2-amd64.deb
[root@linux-host2 src]# grep -v "#" /etc/filebeat/filebeat.yml | grep -v "^$"
  filebeat.prospectors:

  - input_type: log
    paths:
  - /var/log/*.log
  - /var/log/messages
    exclude_lines: ["^DBG"]
    exclude_files: [".gz$"]
    document_type: "system-log-1512-filebeat"
    output.file: #测试写入本地文件
    path: "/tmp"
    filename: "filebeat.txt"
    output.kafka: #写入 kafka
    hosts: ["192.168.15.11:9092","192.168.15.12:9092","192.168.15.13:9092"]
    topic: "systemlog-1512-filebeat"
    partition.round_robin:
    reachable_only: true
    required_acks: 1 #本地写入完成
    compression: gzip #开启压缩
    max_message_bytes: 1000000 #消息最大值
实验最终配置如下:
[root@elk-web1 ~]#grep -v "#" /etc/filebeat/filebeat.yml | grep -v "^$"
filebeat.inputs:
- type: log
enabled: true
paths:
- /var/log/syslog
fields:
type: systemlog
host: 10.0.2.107
- type: log
enabled: true
paths:
- /apps/apache-tomcat-8.5.57/logs/catalina.out
fields:
type: catalina-log
filebeat.config.modules:
path: ${path.config}/modules.d/*.yml
reload.enabled: false
setup.template.settings:
index.number_of_shards: 1
setup.kibana:
processors:
- add_host_metadata: ~
- add_cloud_metadata: ~
- add_docker_metadata: ~
- add_kubernetes_metadata: ~
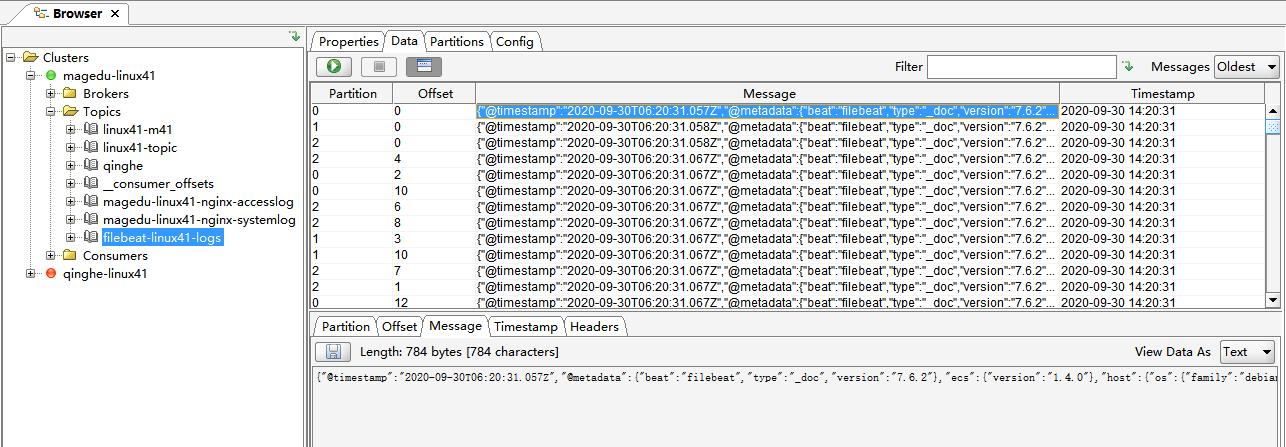
output.kafka:
hosts: ["10.0.4.101:9092","10.0.4.102:9092","10.0.4.103:9092"]
topic: "filebeat-linux41-logs"
partition.round_robin:
reachable_only: true
required_acks: 1
compression: gzip
max_message_bytes: 1000000
目前版本不再支持同时向文件中输出
[root@elk-web1 ~]#systemctl restart filebeat.service
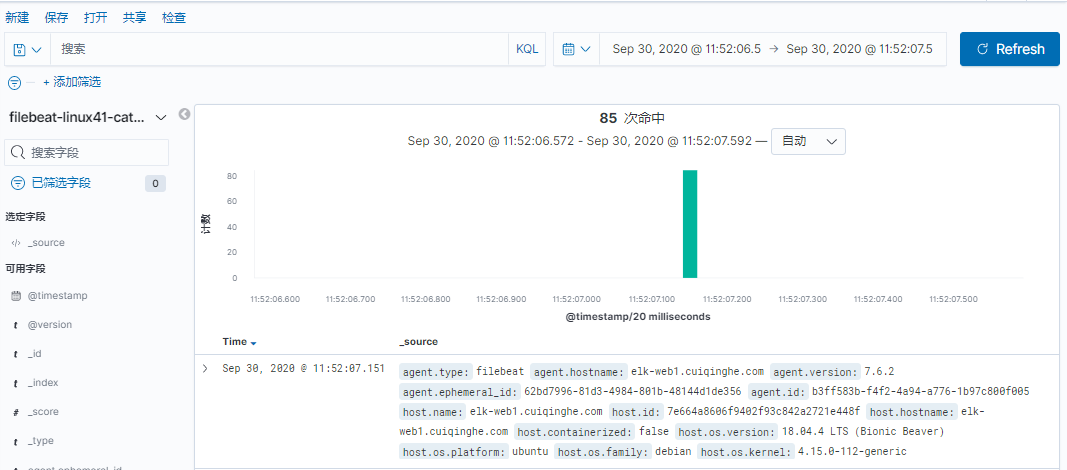
[root@elk-web1 ~]#echo "1111" >> /apps/apache-tomcat-8.5.57/logs/catalina.out
[root@elk-web1 ~]#echo "1111" >> /apps/apache-tomcat-8.5.57/logs/catalina.out
[root@elk-web1 ~]#echo "1111" >> /apps/apache-tomcat-8.5.57/logs/catalina.out
[root@elk-web1 ~]#echo "systemlog 1" >> /var/log/syslog
[root@elk-web1 ~]#echo "systemlog 2" >> /var/log/syslog
[root@linux-host1 ~]# /usr/local/kafka/bin/kafka-topics.sh --list --zookeeper
192.168.15.11:2181,192.168.15.12:2181,192.168.15.13:2181
[root@linux-host1 ~]# vim /etc/logstash/conf.d/kafka-es.conf
input {
  kafka {
    bootstrap_servers => "192.168.15.11:9092"
    topics => "systemlog-1512-filebeat"
    consumer_threads => 1
    decorate_events => true
    codec => "json"
    auto_offset_reset => "latest"
  }
}

output {
  if [type] == "system-log-1512-filebeat" {
  stdout {
    codec => "rubydebug"
  }

  elasticsearch {
    hosts => ["192.168.15.11:9200"]
    index => "system-log-1512-filebeat-%{+YYYY.MM.dd}"
  }}
}
最终配置如下
[root@logstash-to-es ~]#cat /etc/logstash/conf.d/linux41-nginx-accesslog-to-es.conf
input {
kafka {
bootstrap_servers => "10.0.4.101:9092"
topics => "filebeat-linux41-logs"
codec => "json"
consumer_threads => 1
#decorate_events => true #是否装饰事件
}
}
output {
if [fields][type] == "systemlog" {
elasticsearch {
hosts => ["10.0.2.101:9200"]
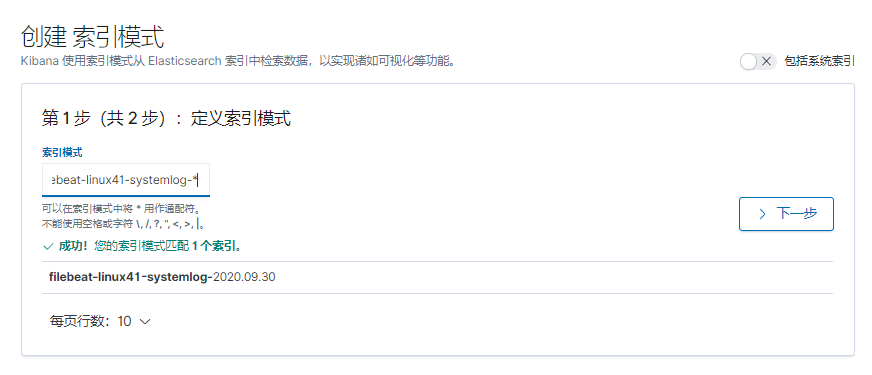
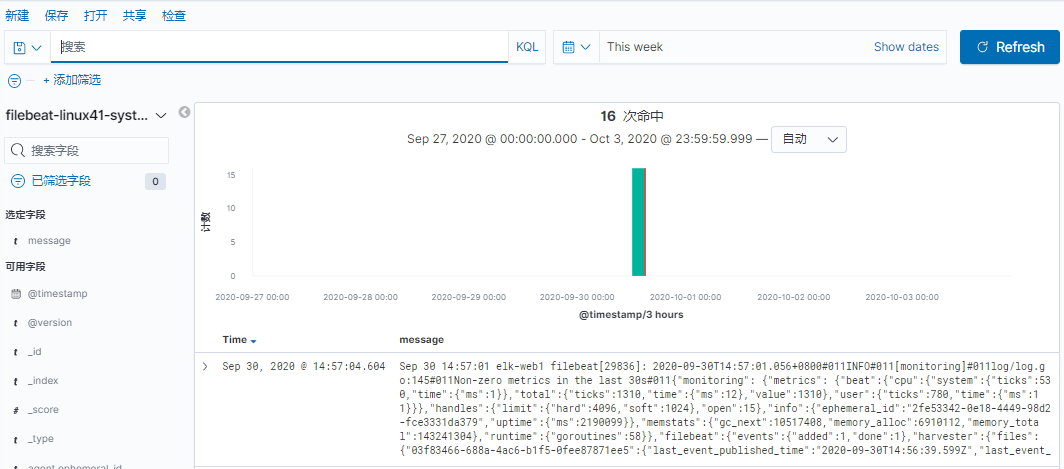
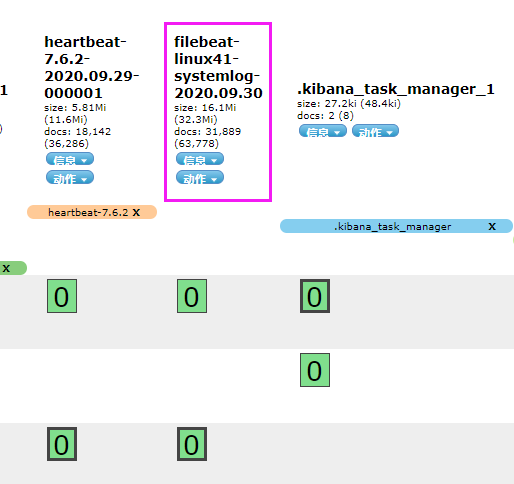
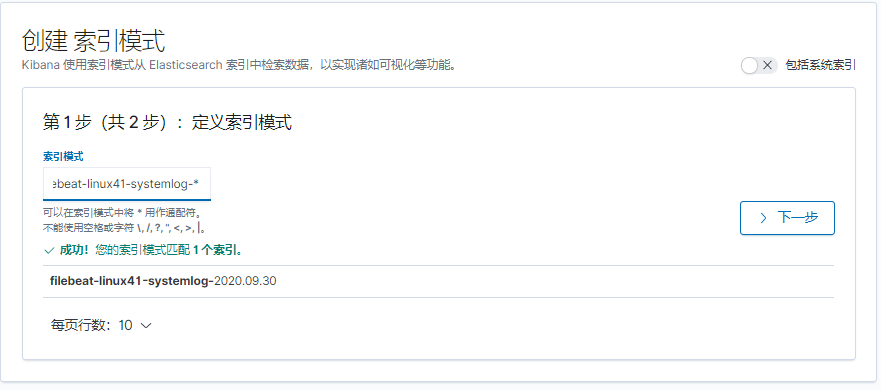
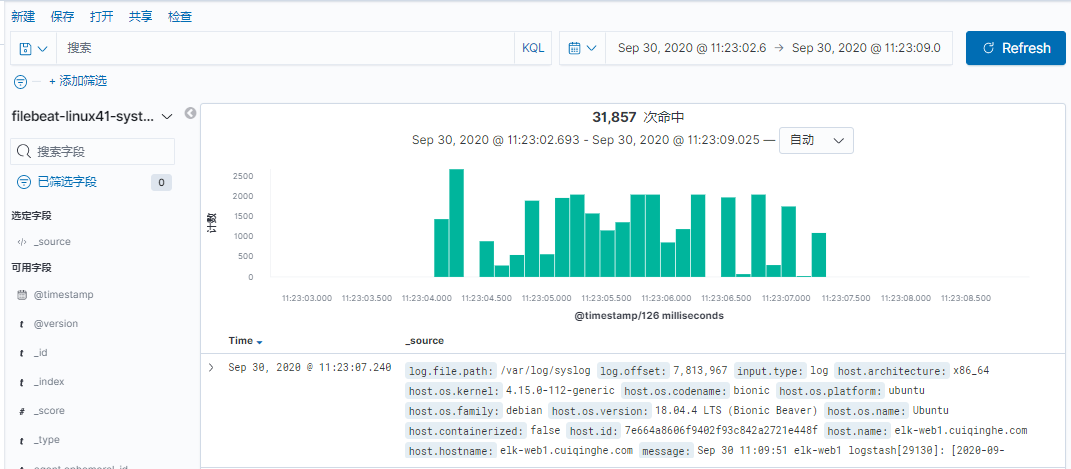
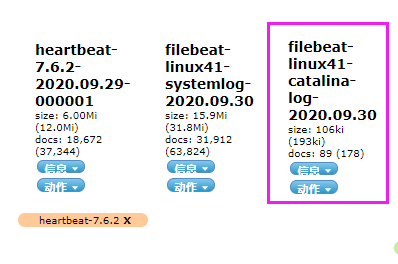
index => "filebeat-linux41-systemlog-%{+YYYY.MM.dd}"
}
}
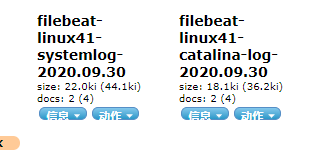
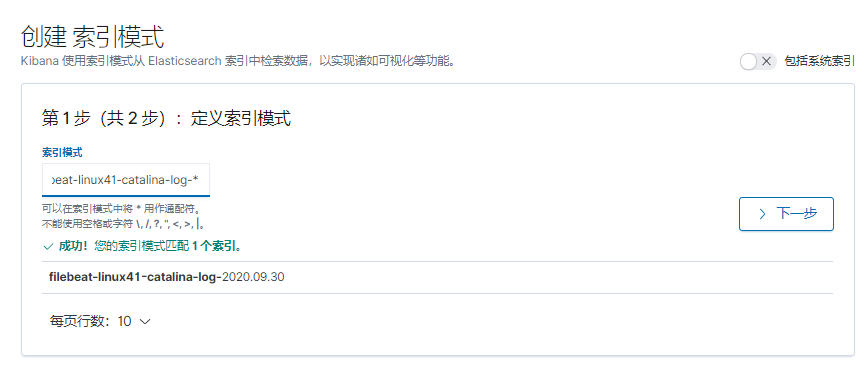
if [fields][type] == "catalina-log" {
elasticsearch {
hosts => ["10.0.2.101:9200"]
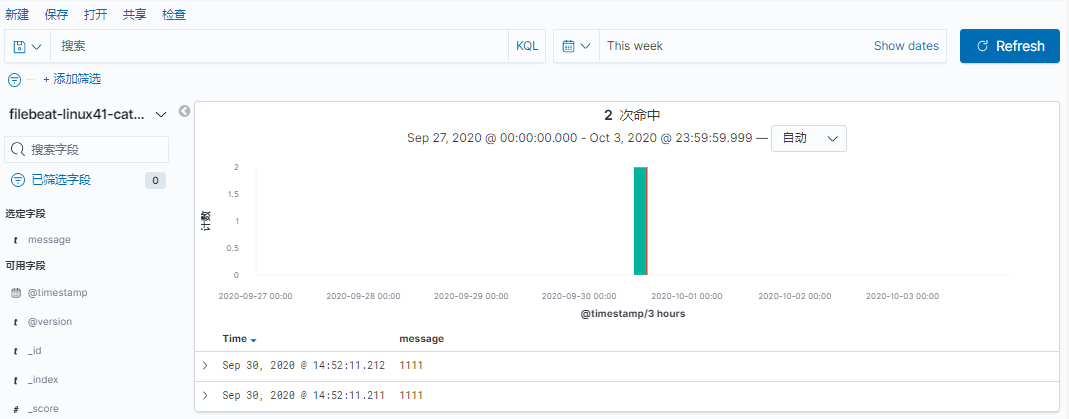
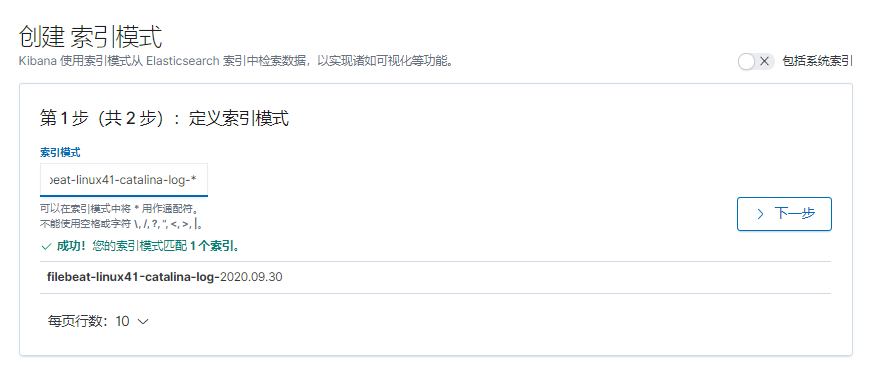
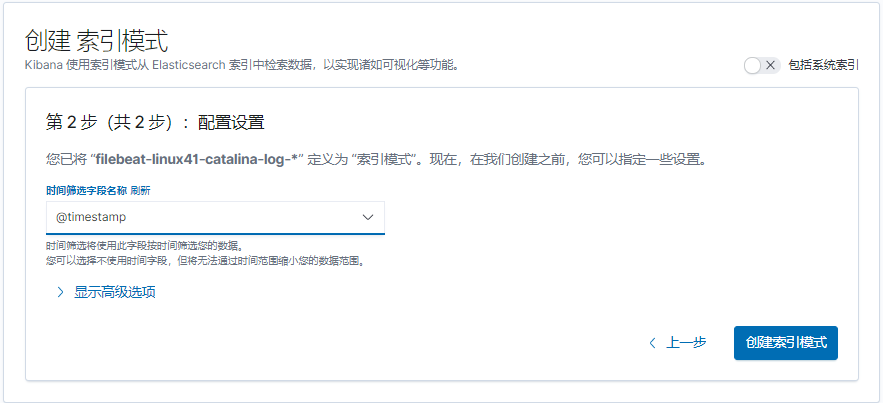
index => "filebeat-linux41-catalina-log-%{+YYYY.MM.dd}"
}
}
}
[root@logstash-to-es ~]# /usr/share/logstash/bin/logstash -f /etc/logstash/conf.d/linux41-nginx-accesslog-to-es.conf –t
[root@logstash-to-es ~]#systemctl restart logstash.service
[root@linux-host2 src]# grep -v "#" /etc/filebeat/filebeat.yml | grep -v "^$"
filebeat.prospectors:
- input_type: log
  paths:
- /var/log/ syslog.log
- /var/log/messages
  exclude_lines: ["^DBG"]
  exclude_files: [".gz$"]
  #document_type: "system-log-1512-filebeat"
  fields:
  type: "system-log-7.106"
- input_type: log
  paths:
- /var/log/nginx/access.log
  exclude_lines: ["^DBG"]
  exclude_files: [".gz$"]
  document_type: "nginx-accesslog-1512-filebeat"
  output.file:
  path: "/tmp"
  filename: "filebeat.txt"
  output.kafka:
  hosts: ["192.168.15.11:9092","192.168.15.12:9092","192.168.15.13:9092"]
  topic: "systemlog-1512-filebeat"
  partition.round_robin:reachable_only: true #如果 reachable_only 设置为 true,则事件将仅发布到可
  用分区, false 将发送到所有分区
  required_acks: 1
  compression: gzip
  max_message_bytes: 1000000
[root@linux-host2 src]# systemctl restart filebeat
还是使用主题 systemlog-1512-filebeat
#从 kafka 读取的配置不变,只把输出部分的判断进行更改即可
if [type] == "nginx-accesslog-1512-filebeat" {
elasticsearch {
  hosts => ["192.168.15.11:9200"]
  index => "nginx-accesslog-1512-filebeat-%{+YYYY.MM.dd}"
}
stdout {
  codec => "rubydebug"
}}
[root@linux-host1 ~]# /usr/share/logstash/bin/logstash -f /etc/logstash/conf.d/kafkaes.conf –t
[root@linux-host1 ~]# cat /etc/logstash/conf.d/kafka-es.conf
input {
kafka {
bootstrap_servers => "192.168.15.11:9092"
topics => "nginx-accesslog-1512"
codec => "json"
consumer_threads => 1
decorate_events => true
}
kafka {bootstrap_servers => "192.168.15.11:9092"
topics => "system-log-1512"
consumer_threads => 1
decorate_events => true
codec => "json"
}
kafka {
bootstrap_servers => "192.168.15.11:9092"
topics => "systemlog-1512-filebeat"
consumer_threads => 1
decorate_events => true
codec => "json"
auto_offset_reset => "latest"
}
}
output {
if [type] == "nginx-accesslog-1512" {
elasticsearch {
hosts => ["192.168.15.11:9200"]
index => "nginx-accesslog-1512-%{+YYYY.MM.dd}"
}}
if [type] == "system-log-1512" {
elasticsearch {
hosts => ["192.168.15.12:9200"]
index => "system-log-1512-%{+YYYY.MM.dd}"
}}
if [type] == "system-log-1512-filebeat" {
elasticsearch {
hosts => ["192.168.15.11:9200"]
index => "system-log-1512-filebeat-%{+YYYY.MM.dd}"
}}
if [type] == "nginx-accesslog-1512-filebeat" {
elasticsearch {
hosts => ["192.168.15.11:9200"]
index => "nginx-accesslog-1512-filebeat-%{+YYYY.MM.dd}"
}
stdout {
codec => "rubydebug"}}
}
不知道放哪
[root@logstash-to-es ~]#cat /etc/logstash/conf.d/linux41-nginx-accesslog-to-es.conf
input {
kafka {
bootstrap_servers => "10.0.4.101:9092"
topics => "magedu-linux41-nginx-accesslog"
codec => "json"
consumer_threads => 1
#decorate_events => true #是否装饰事件
}
kafka {
bootstrap_servers => "10.0.4.101:9092"
topics => "magedu-linux41-nginx-systemlog"
codec => "json"
consumer_threads => 1
#decorate_events => true #是否装饰事件
}
redis {
host => "10.0.2.105"
port => "6379"
password => 123456
db => 2
data_type => list
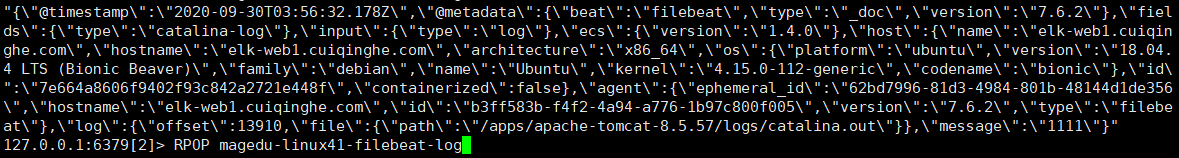
key => "magedu-linux41-filebeat-log"
}
}
output {
if [type] == "nginx-access-log" {
elasticsearch {
hosts => ["10.0.2.101"]
index => "logstash-linux41-kafka-nginx-accesslog-%{+YYYY.MM.dd}"
}}
if [type] == "systemlog" {
elasticsearch {
hosts => ["10.0.2.101"]
index => "logstash-linux41-kafka-systemlog-%{+YYYY.MM.dd}"
}}
if [fields][type] == "systemlog" {
elasticsearch {
hosts => ["10.0.2.101:9200"]
index => "filebeat-linux41-systemlog-%{+YYYY.MM.dd}"
}
}
}
bu知道放哪
[root@logstash-to-es ~]#cat /etc/logstash/conf.d/linux41-nginx-accesslog-to-es.conf
input {
  kafka {
    bootstrap_servers => "10.0.4.101:9092"
    topics => "magedu-linux41-nginx-accesslog"
    codec => "json"
    consumer_threads => 1
    #decorate_events => true #是否装饰事件
  }

  kafka {
    bootstrap_servers => "10.0.4.101:9092"
    topics => "magedu-linux41-nginx-systemlog"
    codec => "json"
    consumer_threads => 1
    #decorate_events => true #是否装饰事件
  }

  redis {
    host => "10.0.2.105"
    port => "6379"
    password => 123456
    db => 2
    data_type => list
    key => "magedu-linux41-filebeat-log"
  }
}

output {
  if [type] == "nginx-access-log" {
  elasticsearch {
    hosts => ["10.0.2.101"]
    index => "logstash-linux41-kafka-nginx-accesslog-%{+YYYY.MM.dd}"
  }}

  if [type] == "systemlog" {
  elasticsearch {
    hosts => ["10.0.2.101"]
    index => "logstash-linux41-kafka-systemlog-%{+YYYY.MM.dd}"
  }}

  if [fields][type] == "systemlog" {
    elasticsearch {
      hosts => ["10.0.2.101:9200"]
      index => "filebeat-linux41-systemlog-%{+YYYY.MM.dd}"
    }
  }

  if [fields][type] == "catalina-log" {
    elasticsearch {
      hosts => ["10.0.2.101:9200"]
      index => "filebeat-linux41-catalina-log-%{+YYYY.MM.dd}"
    }
  }
}
Filebeat 是轻量级单用途的日志收集工具, 用于在没有安装 java 的服务器上专门收集日志, 可以将日志转发到 logstash、 elasticsearch 或 redis 及 kafka 等场景中进行下一步处理。
官网下载地址 https://www.elastic.co/downloads/beats/filebeat
官 方 文 档 https://www.elastic.co/guide/en/beats/filebeat/current/filebeatconfiguration-details.html
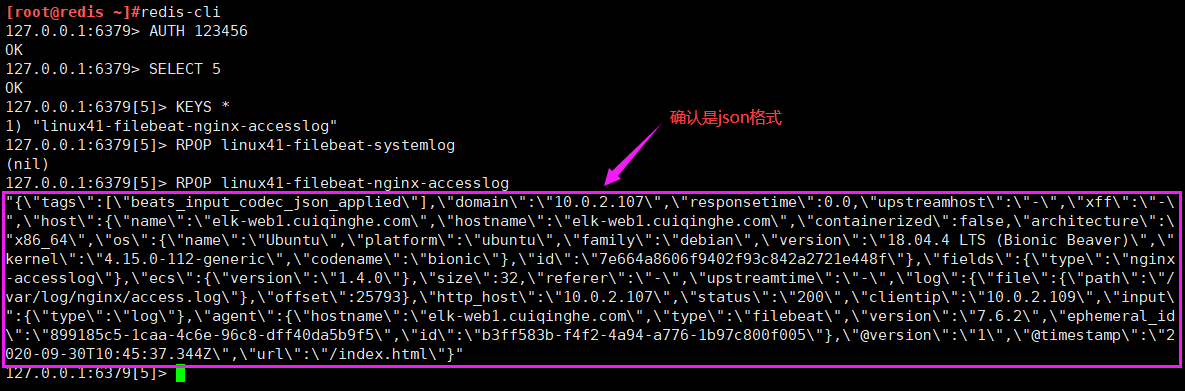
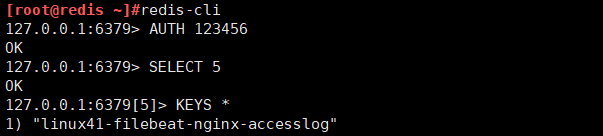
先访问 web 服务器,以产生一定的日志, 然后确认是 json 格式,因为下面的课程中会使用到
[root@linux-host2 ~]# ab -n100 -c100 http://192.168.15.16:8080/web
[root@linux-host2 ~]# tail /usr/local/tomcat/logs/localhost_access_log.2017-04-
28.txt
{"clientip":"192.168.15.15","ClientUser":"-","authenticated":"-
","AccessTime":"[28/Apr/2017:21:16:46 +0800]","method":"GET /webdir/HTTP/1.0","status":"200","SendBytes":"12","Query?string":"","partner":"-
","AgentVersion":"ApacheBench/2.3"}
{"clientip":"192.168.15.15","ClientUser":"-","authenticated":"-
","AccessTime":"[28/Apr/2017:21:16:46 +0800]","method":"GET /webdir/
HTTP/1.0","status":"200","SendBytes":"12","Query?string":"","partner":"-
","AgentVersion":"ApacheBench/2.3"}
[root@linux-host2 ~]# systemctl stop logstash #停止 logstash 服务(如果有安装)
[root@linux-host2 src]# wget
https://artifacts.elastic.co/downloads/beats/filebeat/filebeat-5.3.2-x86_64.rpm
[root@linux-host6 src]# yum install filebeat-5.3.2-x86_64.rpm -y
[root@linux-host2 ~]# cd /etc/filebeat/
[root@linux-host2 filebeat]# cp filebeat.yml filebeat.yml.bak #备份源配置文件
[root@linux-host2 ~]# grep -v "#" /etc/filebeat/filebeat.yml | grep -v "^$"
grep -v "#" /etc/filebeat/filebeat.yml | grep -v "^$"
filebeat.prospectors:
[root@linux-host2 filebeat]# systemctl start filebeat
Filebeat 支持将数据直接写入到 redis 服务器, 本步骤为写入到 redis 当中的一个可以, 另外 filebeat 还支持写入到 elasticsearch、 logstash 等服务器。
[root@linux-host2 ~]# grep -v "#" /etc/filebeat/filebeat.yml | grep -v "^$"
filebeat.prospectors:
- input_type: log
  paths:
- /var/log/messages
- /var/log/*.log
  exclude_lines: ["^DBG","^$"]
  document_type: system-log-1512
  output.redis:
  hosts: ["192.168.15.12:6379"]
  key: "system-log-1512" #为了后期日志处理,建议自定义 key 名称
  db: 1 #使用第几个库
  timeout: 5 #超时时间
  password: 123456 #redis 密码
[root@elk-web1 ~]#grep -v "#" /etc/filebeat/filebeat.yml | grep -v "^$"
filebeat.inputs:
- type: log
  enabled: true
  paths:
    - /var/log/syslog
  fields:
    type: systemlog
    host: 10.0.2.107
filebeat.config.modules:
  path: ${path.config}/modules.d/*.yml
  reload.enabled: false
setup.template.settings:
  index.number_of_shards: 1
setup.kibana:
processors:
  - add_host_metadata: ~
  - add_cloud_metadata: ~
  - add_docker_metadata: ~
  - add_kubernetes_metadata: ~
output.redis:
  hosts: ["10.0.2.105"]
  password: "123456"
  key: "magedu-linux41-filebeat-log"
  db: 2
  timeout: 5
注意选择的 db 是否和 filebeat 写入一致
[root@linux-host1 ~]# cat /etc/logstash/conf.d/redis-systemlog-es.conf
input {
redis {
host => "192.168.15.12"
port => "6379"
db => "1"
key => "system-log-1512"
data_type => "list"}
}
output {
if [type] == "system-log-1512" {
elasticsearch {
hosts => ["192.168.15.11:9200"]
index => "system-log-1512"
}}
}
[root@linux-host1 ~]# systemctl restart logstash #重启 logstash 服务
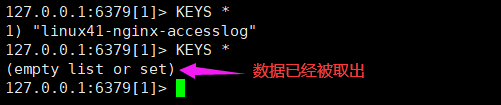
redis数据被取出
[root@redis ~]#redis-cli
127.0.0.1:6379> SELECT 2
(error) NOAUTH Authentication required.
127.0.0.1:6379> AUTH 123456
OK
127.0.0.1:6379> SELECT 2
OK
127.0.0.1:6379[2]> KEYS *
1) "magedu-linux41-filebeat-log"
127.0.0.1:6379[2]> LLEN magedu-linux41-filebeat-log
(integer) 21513
127.0.0.1:6379[2]> LLEN magedu-linux41-filebeat-log
(integer) 20513
127.0.0.1:6379[2]> LLEN magedu-linux41-filebeat-log
(integer) 18513
127.0.0.1:6379[2]> LLEN magedu-linux41-filebeat-log
(integer) 14263
127.0.0.1:6379[2]> LLEN magedu-linux41-filebeat-log
(integer) 8139
127.0.0.1:6379[2]> LLEN magedu-linux41-filebeat-log
(integer) 0
127.0.0.1:6379[2]>
实际环境当中, 可能会出现 reids 当中堆积了大量的数据而 logstash 由于种种
原因未能及时提取日志,此时会导致 redis 服务器的内存被大量使用,甚至出现
如下内存即将被使用完毕的情景
查看 reids 中的日志队列长度发现有大量的日志堆积在 redis 当中
#!/usr/bin/env python
#coding:utf-8
#Author Zhang jie
import redis
def redis_conn():
pool=redis.ConnectionPool(host=“192.168.15.12”,port=6379,db=0,password=12345
6)
conn = redis.Redis(connection_pool=pool)
data = conn.llen(‘tomcat-accesslog-1512’)
print(data)
redis_conn()
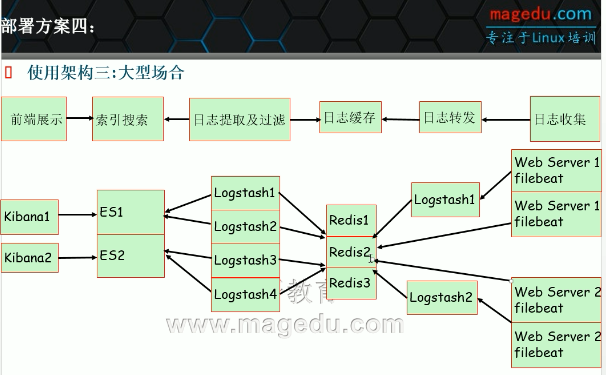
在下面的图当中从左向右看,当要访问 ELK 日志统计平台的时候,首先访问的是两台 nginx+keepalived 做的负载高可用,访问的地址是 keepalived 的 IP,当一台 nginx 代理服务器挂掉之后也不影响访问,然后 nginx 将请求转发到 kibana, kibana 再去 elasticsearch 获取数据, elasticsearch 是两台做的集群,数据会随机保存在任意一台 elasticsearch 服务器, redis 服务器做数据的临时保存,避免 web 服务器日志量过大的时候造成的数据收集与保存不一致导致的日志丢失,可以临时保存到 redis, redis 可以是集群,然后再由 logstash 服务器在非高峰时期从 redis 持续的取出即可,另外有一台 mysql 数据库服务器,用于持久化保存特定的数据, web 服务器的日志由 filebeat 收集之后发送给另外的一台logstash,再有其写入到 redis 即可完成日志的收集,从图中可以看出, redis 服务器处于前端结合的最中间,其左右都要依赖于 redis 的正常运行, web 服务删个日志经过 filebeat 收集之后通过日志转发层的 logstash 写入到 redis 不同的 key当中,然后提取层 logstash 再从 redis 将数据提取并安按照不同的类型写入到elasticsearch 的不同 index 当中, 用户最终通过 nginx 代理的 kibana 查看到收集到的日志的具体内容
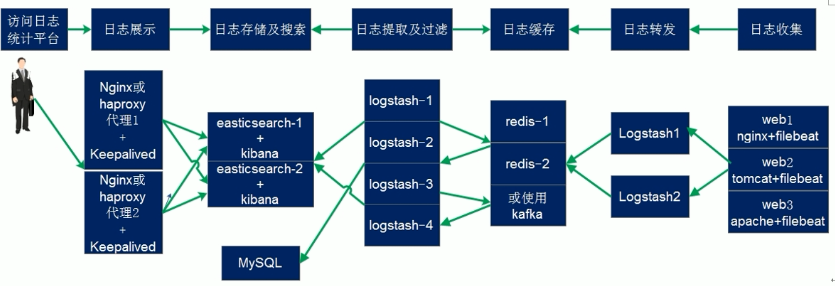
上图说明:适合于大型企业
filebeat输出很单一,不具备logstash对类型进行判断的功能
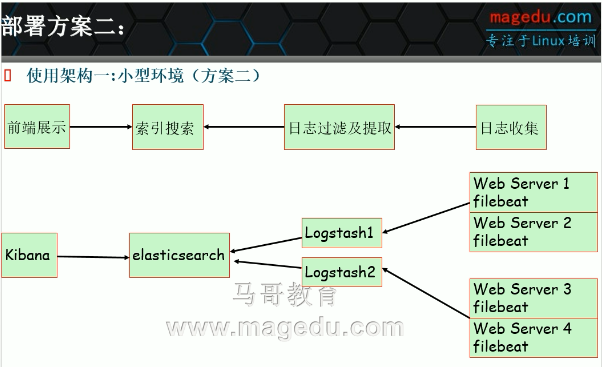
适合于小型公司的架构一:
[外链图片转存失败,源站可能有防盗链机制,建议将图片保存下来直接上传(img-9cUNtirM-1631716932669)(C:/Users/cui/Desktop/%E8%AF%BE%E7%A8%8B%E6%88%AA%E5%9B%BE/40.ELK%E6%97%A5%E5%BF%97%E7%B3%BB%E7%BB%9F_%E5%9B%BE%E7%89%87/image-20200930155723433.png)]
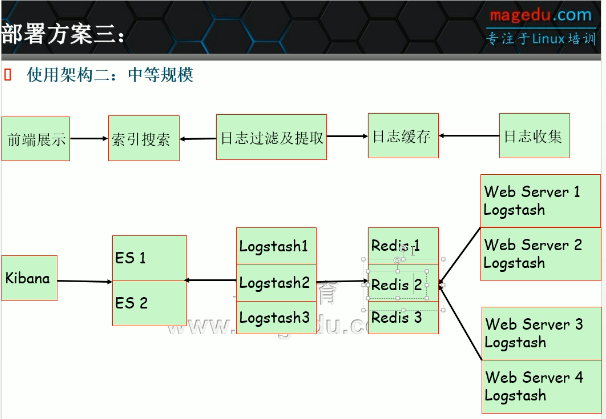
适合于中小型公司的架构二:
适合于中型公司的架构二:
适合于大型公司的架构:
官 方 文 档 https://www.elastic.co/guide/en/beats/filebeat/current/logstashoutput.html
目前只收集了系统日志,下面将 tomcat 的访问日志和启动时生成的 catalina.txt文件的日志进行收集,另外测试多行匹配, 并将输出改为 logstash 进根据日志类型判断写入到不同的 redis key 当中,在一个 filebeat 服务上面同时收集不同类型的日志,比如收集系统日志的时候还要收集 tomcat 的访问日志,那么直接带来的问题就是要在写入至 redis 的时候要根据不同的日志类型写入到 reids 不通的key 当中, 首先通过 logstash 监听一个端口,并做标准输出测试, 具体配置为
实验环境:
10.0.2.106当作logstash服务器
[root@linux-host1 conf.d]# cat beats.conf
input {
beats {
port => 5044
}
} #将输出改为文件进行临时输出测试
output {
file {
path => "/tmp/filebeat.txt"
}
}
实验配置如下:
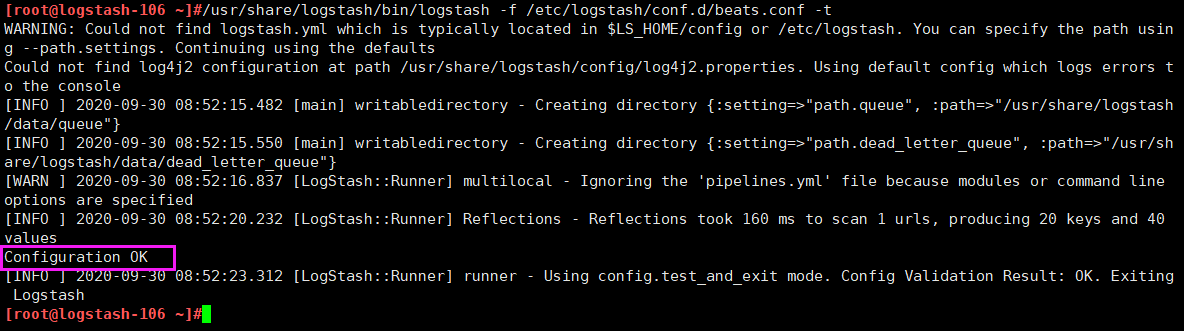
[root@logstash-106 ~]#vim /etc/logstash/conf.d/beats.conf
input {
  beats {
    host => "0.0.0.0"
    port => 5044
  }
}

output {
  stdout {}
}
[root@logstash-106 ~]#/usr/share/logstash/bin/logstash -f /etc/logstash/conf.d/beats.conf -t
[root@linux-host1 conf.d]# ll
total 8-rw-r--r-- 1 root root 139 May 29 17:39 beats.conf
-rw-r--r-- 1 root root 319 May 29 16:16 redis-systemlog-es.conf #保留个配置,后面在会在 filebeat 验证多个输出,比如同事输出到 redis 和 logstash。

[root@logstash-106 ~]#systemctl restart logstash.service #重启服务

#验证端口是否被监听
[root@logstash-106 ~]#ss -ntl |grep 5044
LISTEN  0        128                          *:5044                   *:*
[root@linux-host2 ~]# grep -v "#" /etc/filebeat/filebeat.yml | grep -v "^$"
filebeat.prospectors:
- input_type: log
  paths:
- /var/log/messages
- /var/log/*.log
  exclude_lines: ["^DBG","^$"]
  document_type: system-log-1512
  output.redis:
  hosts: ["192.168.15.12:6379"]
  key: "system-log-1512"
  db: 1
  timeout: 5
  password: 123456
  output.logstash:
  hosts: ["10.0.2.106:5044"] #logstash 服务器地址,可以是多个
  enabled: true #是否开启输出至 logstash,默认即为 true
  worker: 1 #工作线程数
  compression_level: 3 #压缩级别
  #loadbalance: true #多个输出的时候开启负载
实验配置如下:
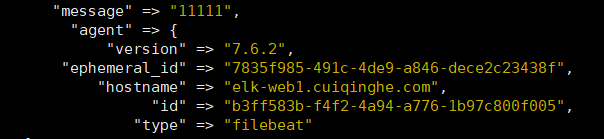
[root@elk-web1 ~]#grep -v "#" /etc/filebeat/filebeat.yml | grep -v "^$"
filebeat.inputs:
- type: log
  enabled: true
  paths:
    - /var/log/syslog
  fields:
    type: systemlog
    host: 10.0.2.107
filebeat.config.modules:
  path: ${path.config}/modules.d/*.yml
  reload.enabled: false
setup.template.settings:
  index.number_of_shards: 1
setup.kibana:
processors:
  - add_host_metadata: ~
  - add_cloud_metadata: ~
  - add_docker_metadata: ~
  - add_kubernetes_metadata: ~
output.logstash:
  hosts: ["10.0.2.106:5044"]
  enabled: true
  worker: 1
  compression_level: 3
[root@elk-web1 ~]#systemctl restart filebeat.service

[root@elk-web1 ~]#echo "11111" >> /var/log/syslog
更改配置输出到redis
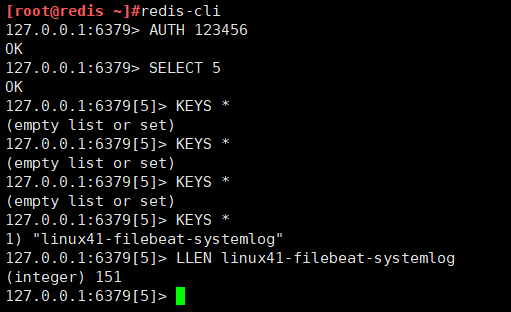
[root@logstash-106 ~]#cat /etc/logstash/conf.d/beats.conf
input {
  beats {
    host => "0.0.0.0"
    port => 5044
    codec => "json"
  }
}

output {
  if [fields][type] == "systemlog" {
    redis {
      host => "10.0.2.105"
      port => "6379"
      db => "5"
      key => "linux41-filebeat-systemlog"
      data_type => "list"
      password => "123456"
    }
  }
}

[root@elk-web1 ~]#echo "22222" >> /var/log/syslog
[root@elk-web1 ~]#echo "22222" >> /var/log/syslog
到redis中确认数据
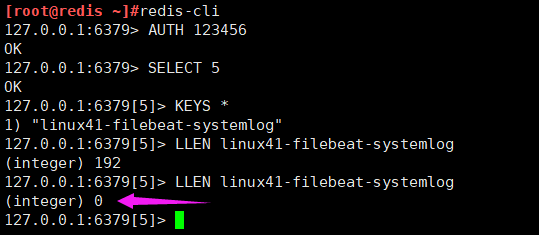
再在10.0.2.104上的logstash服务器把redis的数据取走
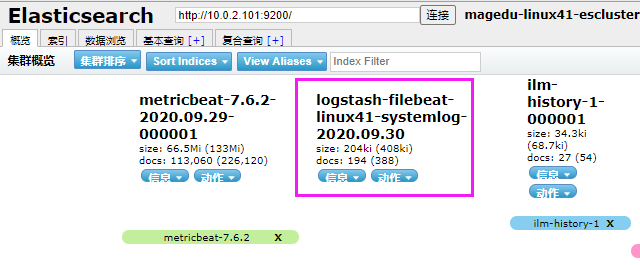
[root@logstash-to-es ~]#cat /etc/logstash/conf.d/linux41-nginx-accesslog-to-es.conf
input {
  kafka {
    bootstrap_servers => "10.0.4.101:9092"
    topics => "filebeat-linux41-logs"
    codec => "json"
    consumer_threads => 1
    #decorate_events => true #是否装饰事件
  }

  redis {
    host => "10.0.2.105"
    port => "6379"
    password => 123456
    db => 5
    data_type => list
    key => "linux41-filebeat-systemlog"
  }
}

output {
  if [fields][type] == "systemlog" {
    elasticsearch {
      hosts => ["10.0.2.101:9200"]
      index => "logstash-filebeat-linux41-systemlog-%{+YYYY.MM.dd}"
    }
  }
}

#重启之前先把之前实验的数据删掉
[root@logstash-to-es ~]#systemctl restart logstash
数据已经被取走
可以验证 filebeat 可以同时进行多目标的输出。
本次将 tomcat 的访问日志进行一起收集, 即同时收集了服务器的系统日志和tomcat 的访问日志, 并且定义不同的日志 type,最后统一转发给 logstash 进行进一步处理
[root@elk-web1 ~]#grep -v "#" /etc/filebeat/filebeat.yml | grep -v "^$"
filebeat.inputs:
- type: log
  enabled: true
  paths:
    - /var/log/syslog
  fields:
    type: systemlog
    host: 10.0.2.107
- type: log
  enabled: true
  paths:
    - /var/log/nginx/access.log
  fields:
    type: nginx-accesslog
filebeat.config.modules:
  path: ${path.config}/modules.d/*.yml
  reload.enabled: false
setup.template.settings:
  index.number_of_shards: 1
setup.kibana:
processors:
  - add_host_metadata: ~
  - add_cloud_metadata: ~
  - add_docker_metadata: ~
  - add_kubernetes_metadata: ~
output.logstash:
  hosts: ["10.0.2.106:5044"]
  enabled: true
  worker: 1
[root@elk-web1 ~]#systemctl restart filebeat.service
[root@logstash-106 ~]#cat /etc/logstash/conf.d/beats.conf
input {
  beats {
    host => "0.0.0.0"
    port => 5044
    codec => "json"
  }
}

output {
  if [fields][type] == "systemlog" {
    redis {
      host => "10.0.2.105"
      port => "6379"
      db => "5"
      key => "linux41-filebeat-systemlog"
      data_type => "list"
      password => "123456"
    }
  }

  if [fields][type] == "nginx-accesslog" {
    redis {
      host => "10.0.2.105"
      port => "6379"
      db => "5"
      key => "linux41-filebeat-nginx-accesslog"
      data_type => "list"
      password => "123456"
    }
  }
}
[root@logstash-106 ~]#systemctl restart logstash
[root@linux-host2 filebeat]# echo "test" >> /var/log/messages
[root@linux-host2 filebeat]# ab -n10 -c5 http://10.0.2.107/webdir/index.html
输出部分的配置是一样的, 只是输入的部分的端口一个是 5044 一个是 5045。
[root@linux-host1 conf.d]# cat beats.conf
input {
beats {
port => 5044
codec => "json"
}
}
output {
if [type] == "system-log-1512" {
redis {host => "192.168.15.12"
port => "6379"
db => "1"
key => "system-log-1512"
data_type => "list"
password => "123456"
}}
if [type] == "tomcat-accesslog-1512" {
redis {
host => "192.168.15.12"
port => "6379"
db => "0"
key => "tomcat-accesslog-1512"
data_type => "list"
password => "123456"
}}
}
[root@linux-host1 conf.d]# cat beats-5045.conf
input {
beats {
port => 5045
codec => "json"
}
}
output {
if [type] == "system-log-1512" {
redis {
host => "192.168.15.12"
port => "6379"
db => "1"
key => "system-log-1512"
data_type => "list"
password => "123456"
}}
if [type] == "tomcat-accesslog-1512" {
redis {
host => "10.0.2.105"
port => "6379"
db => "1"
key => "linux41-filebeat-systemlog"
data_type => "list"
password => "123456"
}}}
[root@linux-host2 filebeat]# echo "test1" >> /var/log/messages
[root@linux-host2 filebeat]# echo "test2" >> /var/log/messages
[root@linux-host2 filebeat]# ab -n10 -c5
http://192.168.15.12:8080/webdir/index.html
[root@logstash-to-es ~]#cat /etc/logstash/conf.d/linux41-nginx-accesslog-to-es.conf
input {
  kafka {
    bootstrap_servers => "10.0.4.101:9092"
    topics => "filebeat-linux41-logs"
    codec => "json"
    consumer_threads => 1
    #decorate_events => true #是否装饰事件
  }

  redis {
    host => "10.0.2.105"
    port => "6379"
    password => 123456
    db => 5
    data_type => list
    key => "linux41-filebeat-systemlog"
  }

  redis {
    host => "10.0.2.105"
    port => "6379"
    password => 123456
    db => 5
    data_type => list
    key => "linux41-filebeat-nginx-accesslog"
  }
}

output {
  if [fields][type] == "systemlog" {
    elasticsearch {
      hosts => ["10.0.2.101:9200"]
      index => "logstash-filebeat-linux41-systemlog-%{+YYYY.MM.dd}"
    }
  }

  if [fields][type] == "nginx-accesslog" {
    elasticsearch {
      hosts => ["10.0.2.101:9200"]
      index => "logstash-filebeat-linux41-nginx-accesslog-%{+YYYY.MM.dd}"
    }
  }
}
[root@logstash-to-es ~]# /usr/share/logstash/bin/logstash -f /etc/logstash/conf.d/linux41-nginx-accesslog-to-es.conf -t
[root@logstash-to-es ~]#systemctl restart logstash
#10.0.2.104重启若没有问题,就会从redis中取出数据
[root@redis ~]#redis-cli
127.0.0.1:6379> AUTH 123456
OK
127.0.0.1:6379> SELECT 5
OK
127.0.0.1:6379[5]> KEYS *
1) "linux41-filebeat-nginx-accesslog"
127.0.0.1:6379[5]> LLEN linux41-filebeat-nginx-accesslog
(integer) 192
127.0.0.1:6379[5]> LLEN linux41-filebeat-nginx-accesslog
(integer) 0
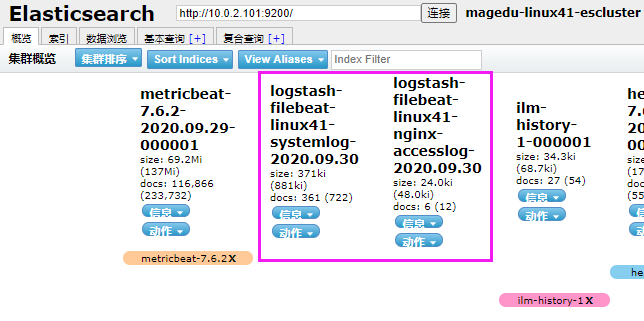
添加系统日志索引
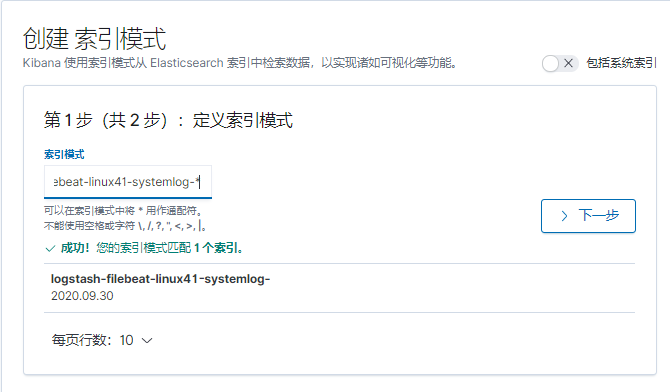
添加 tomcat 访问日志索引
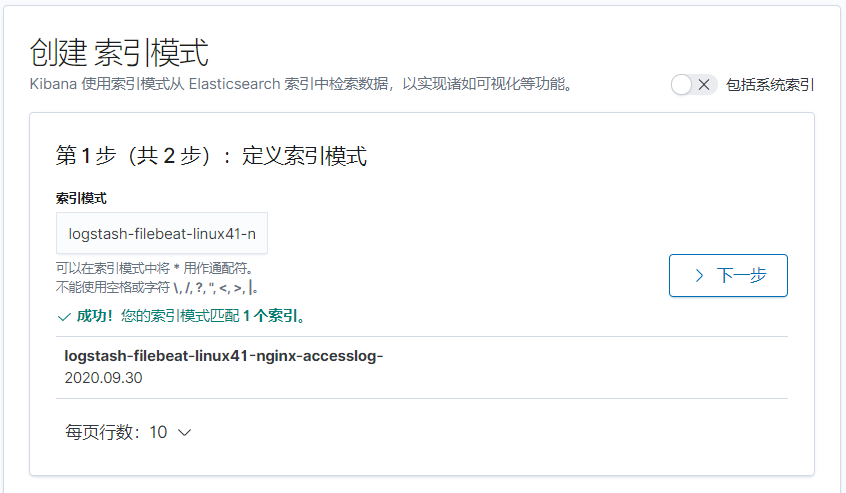
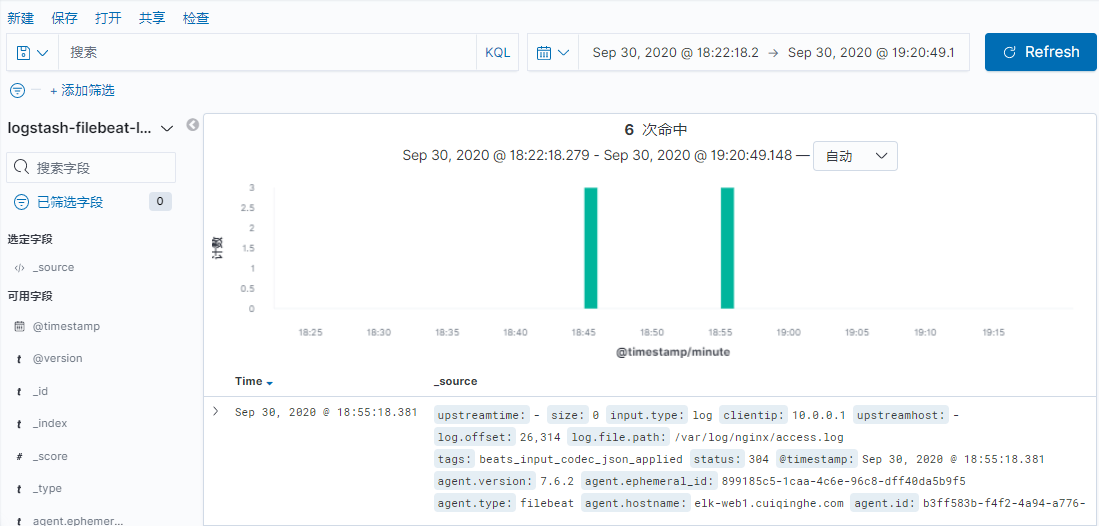
[root@elk-web1 ~]#echo "hello world" >> /var/log/syslog
[root@elk-web1 ~]#echo "hello world" >> /var/log/syslog
[root@elk-web1 ~]#echo "hello world" >> /var/log/syslog
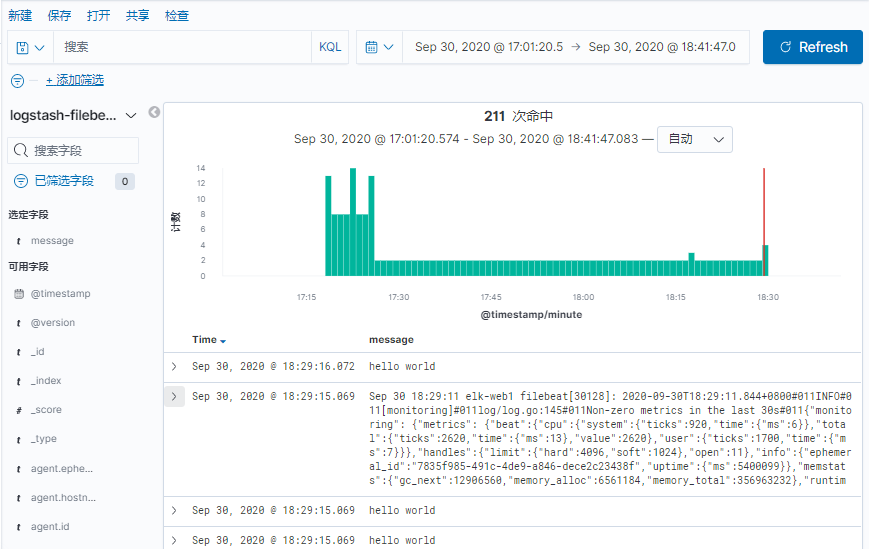
Host2 已经安装过 haproxy,因此直接配置 host2 的 haproxy 即可并安装一个
kibana 即可
[root@linux-host2 src]# rpm -ivh kibana-5.3.0-x86_64.rpm
[root@linux-host2 src]# grep “1” /etc/kibana/kibana.yml
server.port: 5601
server.host: “127.0.0.1”
elasticsearch.url: “http://192.168.15.12:9200”
[root@linux-host2 src]# systemctl start kibana
[root@linux-host2 src]# systemctl enable kibana
[root@linux-host2 ~]# cat /etc/haproxy/haproxy.cfg
global
maxconn 100000
chroot /usr/local/haproxy
uid 99
gid 99
daemon
nbproc 1
pidfile /usr/local/haproxy/run/haproxy.pid
log 127.0.0.1 local6 info
defaults
option http-keep-alive
option forwardfor
maxconn 100000
mode http
timeout connect 300000ms
timeout client 300000ms
timeout server 300000ms
listen stats
mode http
bind 0.0.0.0:9999
stats enable
log global
stats uri /haproxy-status
stats auth haadmin:q1w2e3r4ys
#frontend web_port
frontend web_port
bind 0.0.0.0:80mode http
option httplog
log global
option forwardfor
###################ACL Setting##########################
acl pc hdr_dom(host) -i www.elk.com
acl mobile hdr_dom(host) -i m.elk.com
acl kibana hdr_dom(host) -i www.kibana1512.com
###################USE ACL##############################
use_backend pc_host if pc
use_backend mobile_host if mobile
use_backend kibana_host if kibana
########################################################
backend pc_host
mode http
option httplog
balance source
server web1 192.168.15.11:80 check inter 2000 rise 3 fall 2 weight 1
backend mobile_host
mode http
option httplog
balance source
server web1 192.168.15.11:80 check inter 2000 rise 3 fall 2 weight 1
backend kibana_host
mode http
option httplog
balance source
server web1 127.0.0.1:5601 check inter 2000 rise 3 fall 2 weight 1
[root@linux-host2 ~]# systemctl reload haproxy
C:\Windows\System32\drivers\etc
192.168.15.11 www.kibana1511.com
192.168.15.12 www.kibana1512.com4.9.4.5 浏览器访问域名
将 nginx 作为反向代理服务器,并增加登录用户认证的目的, 可以有效避免其
他人员随意访问 kibana 页面。
[root@linux-host2 src]# systemctl disable haproxy
[root@linux-host2 src]# systemctl disable haproxy
[root@linux-host2 src]# tar xf nginx-1.10.3.tar.gz
[root@linux-host2 nginx-1.10.3]# ./configure --prefix=/usr/local/nginx
[root@linux-host2 nginx-1.10.3]# make && make install
[root@linux-host2 nginx-1.10.3]# vim /usr/lib/systemd/system/nginx.service
[Unit]
Description=The nginx HTTP and reverse proxy server
After=network.target remote-fs.target nss-lookup.target
[Service]
Type=forking
PIDFile=/run/nginx.pid #和 nginx 配置文件的保持一致
ExecStartPre=/usr/bin/rm -f /run/nginx.pid
ExecStartPre=/usr/sbin/nginx -t
ExecStart=/usr/sbin/nginx
ExecReload=/bin/kill -s HUP $MAINPID
KillSignal=SIGQUIT
TimeoutStopSec=5
KillMode=process
PrivateTmp=true
[Install]
WantedBy=multi-user.target
[root@linux-host2 nginx-1.10.3]# ln -sv /usr/local/nginx/sbin/nginx /usr/sbin/
[root@linux-host2 nginx-1.10.3]# useradd www -u 2000
[root@linux-host2 nginx-1.10.3]# chown www.www /usr/local/nginx/ -R
[root@linux-host2 nginx-1.10.3]# vim /usr/local/nginx/conf/nginx.conf
user www www;
worker_processes 1;
pid /run/nginx.pid; #更改 pid 文件路径与启动脚本必须一致
[root@linux-host2 nginx-1.10.3]# systemctl start nginx
[root@linux-host2 nginx-1.10.3]# systemctl enable nginx #普通用户能否启动
nignx?
Created symlink from /etc/systemd/system/multi-user.target.wants/nginx.service to
/usr/lib/systemd/system/nginx.service.
[root@linux-host2 conf]# mkdir /usr/local/nginx/conf/conf.d/
[root@linux-host2 conf]# vim /usr/local/nginx/conf/nginx.conf
include /usr/local/nginx/conf/conf.d/*.conf;
[root@linux-host2 conf]# vim /usr/local/nginx/conf/conf.d/kibana1512.conf
upstream kibana_server {
server 127.0.0.1:5601 weight=1 max_fails=3 fail_timeout=60;
}
server {
listen 80;
server_name www.kibana1512.com;
location / {
proxy_pass http://kibana_server;
proxy_http_version 1.1;
proxy_set_header Upgrade $http_upgrade;
proxy_set_header Connection ‘upgrade’;
proxy_set_header Host $host;
proxy_cache_bypass $http_upgrade;
}
}
[root@linux-host2 conf]# chown www.www /usr/local/nginx/ -R
[root@linux-host2 conf]# systemctl restart nginx
[root@linux-host2 conf]# ab -n100 -c10
http://192.168.15.12:8080/webdir/index.html4.9.5.8 实现登录认证
[root@linux-host2 conf]# yum install httpd-tools –y
[root@linux-host2 conf]# htpasswd -bc /usr/local/nginx/conf/htpasswd.users
zhangjie 123456
Adding password for user zhangjie
[root@linux-host2 conf]# htpasswd -b /usr/local/nginx/conf/htpasswd.users
zhangtao 123456
Adding password for user zhangtao
[root@linux-host2 conf]# cat /usr/local/nginx/conf/htpasswd.users
zhangjie:
a
p
r
1
apr1
apr1x7K2F2rr
x
q
8
t
I
K
g
3
J
c
O
U
y
O
z
S
V
u
B
p
z
1
z
h
a
n
g
t
a
o
:
xq8tIKg3JcOUyOzSVuBpz1 zhangtao:
xq8tIKg3JcOUyOzSVuBpz1zhangtao:apr1
v
B
g
99
m
3
i
vBg99m3i
vBg99m3ihV/ayYIsDTm950tonXEJ11
[root@linux-host2 conf]# vim /usr/local/nginx/conf/conf.d/kibana1512.conf
upstream kibana_server {
server 127.0.0.1:5601 weight=1 max_fails=3 fail_timeout=60;
}
server {
listen 80;
server_name www.kibana1512.com;
auth_basic “Restricted Access”;
auth_basic_user_file /usr/local/nginx/conf/htpasswd.users;
location / {
proxy_pass http://kibana_server;
proxy_http_version 1.1;
proxy_set_header Upgrade $http_upgrade;
proxy_set_header Connection ‘upgrade’;
proxy_set_header Host $host;proxy_cache_bypass $http_upgrade;
}
}
[root@linux-host2 conf]# chown www.www /usr/local/nginx/ -R
[root@linux-host2 conf]# systemctl reload nginx
适应浏览器冲重新打开 nginx 监听的域名,可以发现需要密码才可以登录
除非点击取消之后提示需要认证
在 logstash2 版本的时候使用的是
http://geolite.maxmind.com/download/geoip/database/GeoLiteCity.dat.gz, 但是在logstash5 版本时候更换为了
http://geolite.maxmind.com/download/geoip/database/GeoLite2-City.tar.gz,即 5版本和 2 版本使用的是不一样的地址库文件
[root@linux-host2 ~]# cd /etc/logstash/
[root@linux-host2 logstash]# wget
http://geolite.maxmind.com/download/geoip/database/GeoLite2-City.tar.gz
最新下载地址 https://dev.maxmind.com/geoip/geoip2/geolite2/
我们将从 2019 年 12 月 30 日开始对您访问免费的 GeoLite2 数据库的方式进行重大更改, 需要注册账号才能下载 进入到个人邮箱并设置密码 登录账号并下载
[root@logstash-to-es ~]#mv GeoLite2-City_20200922.tar.gz /etc/logstash/
[root@logstash-to-es ~]#cd /etc/logstash/
[root@logstash-to-es logstash]#tar xvf GeoLite2-City_20200922.tar.gz
#其中 elasticsearch 的索引名称必须必须必须以 logstash-开头。
[root@logstash-to-es ~]#cat /etc/logstash/conf.d/linux41-nginx-accesslog-to-es.conf
input {
  redis {
    host => "10.0.2.105"
    port => "6379"
    password => 123456
    db => 5
    data_type => list
    key => "linux41-filebeat-systemlog"
  }

  redis {
    host => "10.0.2.105"
    port => "6379"
    password => 123456
    db => 5
    data_type => list
    key => "linux41-filebeat-nginx-accesslog"
  }
}

filter {
  if [fields][type] == "nginx-accesslog" {
    geoip {
      source => "clientip"
      target => "geoip"
      database => "/etc/logstash/GeoLite2-City_20200922/GeoLite2-City.mmdb"
      add_field => [ "[geoip][coordinates]", "%{[geoip][longitude]}" ]
      add_field => [ "[geoip][coordinates]", "%{[geoip][latitude]}" ]
    }
    mutate {
    convert => [ "[geoip][coordinates]", "float"]
    }
  }
}

output {
  if [fields][type] == "systemlog" {
    elasticsearch {
      hosts => ["10.0.2.101:9200"]
      index => "logstash-filebeat-linux41-systemlog-%{+YYYY.MM.dd}"
    }
  }

  if [fields][type] == "nginx-accesslog" {
    elasticsearch {
      hosts => ["10.0.2.101:9200"]
      index => "logstash-filebeat-linux41-nginx-accesslog-%{+YYYY.MM.dd}"
    }
  }

  jdbc {
    connection_string => "jdbc:mysql://10.0.2.109/elk?user=elk&password=123456&useUnicode=true&characterEncoding=UTF8"
    statement => ["INSERT INTO elklog(clientip,size,url,status) VALUES(?,?,?,?)","clientip","size","url","status"]
  }
}
[root@linux-host2 logstash]# systemctl restart logstash
[root@linux-host2 logs]# cat tets.log >> tomcat_access_log.2017-05-30.log
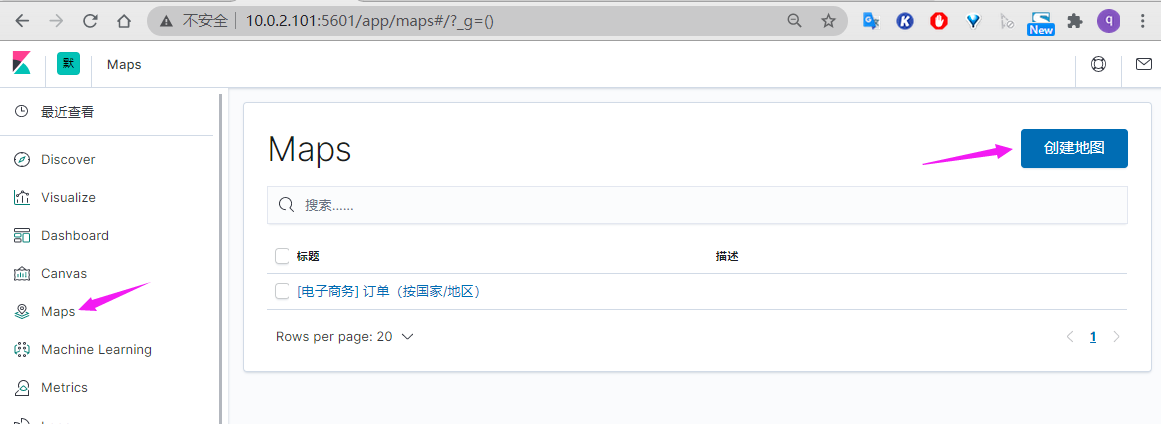
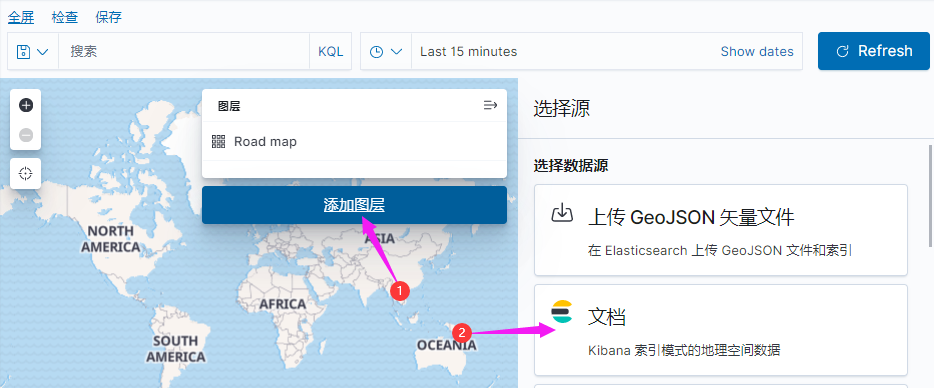
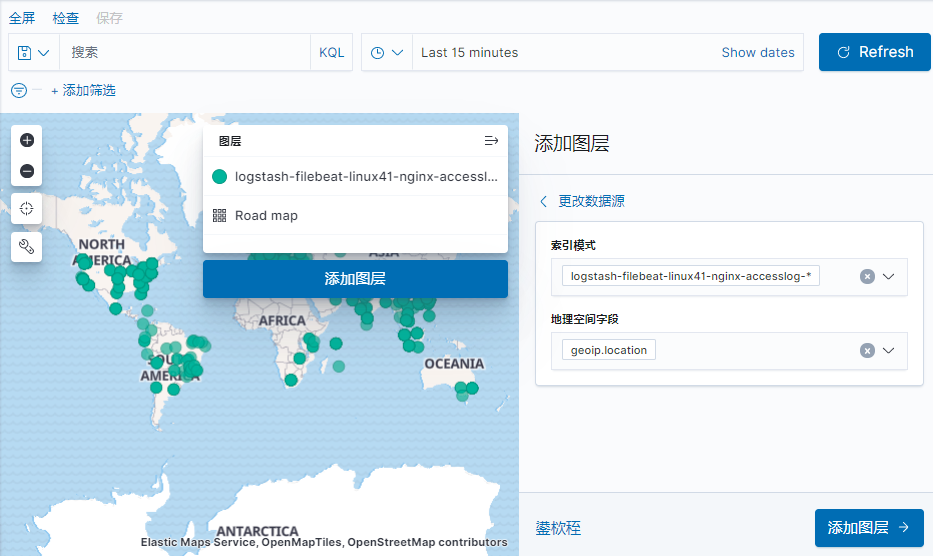
写入数据库的目的是用于持久化保存重要数据,比如状态码、 客户端 IP、客户端浏览器版本等等,用于后期按月做数据统计等。
[root@linux-host1 src]# tar xvf mysql-5.6.34-onekey-install.tar.gz
[root@linux-host1 src]# ./mysql-install.sh
[root@linux-host1 src]# /usr/local/mysql/bin/mysql_secure_installation
本实验直接用10.0.2.109web3的apt安装的mysql
[root@elk-web3 ~]#apt install mysql-server
[root@elk-web3 ~]#apt install mysql-client

#默认是监听的127.0.0.1的3306端口,改为0.0.0.0
[root@elk-web3 ~]#vim /etc/mysql/mysql.conf.d/mysqld.cnf
bind-address            = 0.0.0.0
#改完后重启
[root@elk-web3 ~]#systemctl restart mysql.service

[root@elk-web3 ~]#ss -ntl |grep 3306
LISTEN   0         80                  0.0.0.0:3306             0.0.0.0:*
[root@elk-web3 ~]#mysql
mysql> create database elk character set utf8 collate utf8_bin;
Query OK, 1 row affected (0.00 sec)

mysql> grant all privileges on elk.* to elk@"%" identified by '123456';
Query OK, 0 rows affected, 1 warning (0.00 sec)

mysql> flush privileges;  #刷新授权
Query OK, 0 rows affected (0.00 sec)
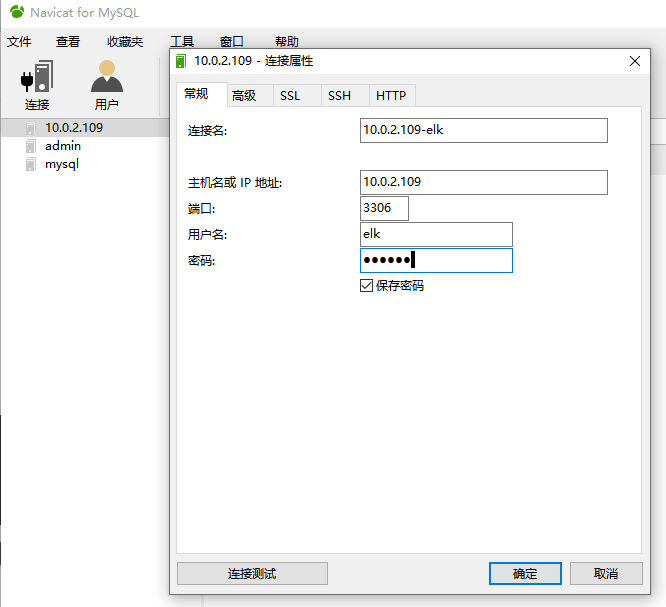
MySQL Connector/J 是 MySQL 官方 JDBC 驱动程序, JDBC( Java Data Base Connectivity,java 数据库连接)是一种用于执行 SQL 语句的 Java API,可以为多种关系数据库提供统一访问,它由一组用 Java 语言编写的类和接口组成。
官方下载地址 https://dev.mysql.com/downloads/connector/
#把安装包传给10.0.2.104
[root@logstash-to-es ~]#dpkg -i mysql-connector-java_8.0.21-1ubuntu18.04_all.deb
[root@logstash-to-es ~]#mkdir -pv /usr/share/logstash/vendor/jar/jdbc
[root@logstash-to-es ~]#cp /usr/share/java/mysql-connector-java-8.0.21.jar /usr/share/logstash/vendor/jar/jdbc
[root@logstash-to-es ~]#chown logstash.logstash /usr/share/logstash/vendor/jar/ -R
国外的 gem 源由于网络原因,从国内访问太慢而且不稳定, 还经常安装不成功 , 因 此 之 前 一 段 时 间 很 多 人 都 是 使 用 国 内 淘 宝 的 gem 源 https://ruby.taobao.org/,现在淘宝的 gem 源虽然还可以使用已经停止维护更新,其官方介绍推荐使用 https://gems.ruby-china.org。
[root@logstash-to-es ~]#apt install ruby
[root@linux-host1 src]# gem sources --add https://rubygems.org/ --remove
https://rubygems.org/
https://ruby.taobao.org/ added to sources
https://rubygems.org/ removed from sources

[root@linux-host1 src]# gem source list
*** CURRENT SOURCES ***
https://gems.ruby-china.org/
[root@linux-host1 src]# /usr/share/logstash/bin/logstash-plugin list #当前已经安装的所有插件
[root@logstash-to-es ~]# /usr/share/logstash/bin/logstash-plugin install logstashoutput-jdbc
[root@logstash-to-es ~]# /usr/share/logstash/bin/logstash-plugin list |grep jdbc
logstash-integration-jdbc
 ├── logstash-input-jdbc
 ├── logstash-filter-jdbc_streaming
 └── logstash-filter-jdbc_static
logstash-output-jdbc

#装好之后重启logstash
[root@logstash-to-es ~]#systemctl restart logstash.service

time 的默认值设置为 CURRENT_TIMESTAMP
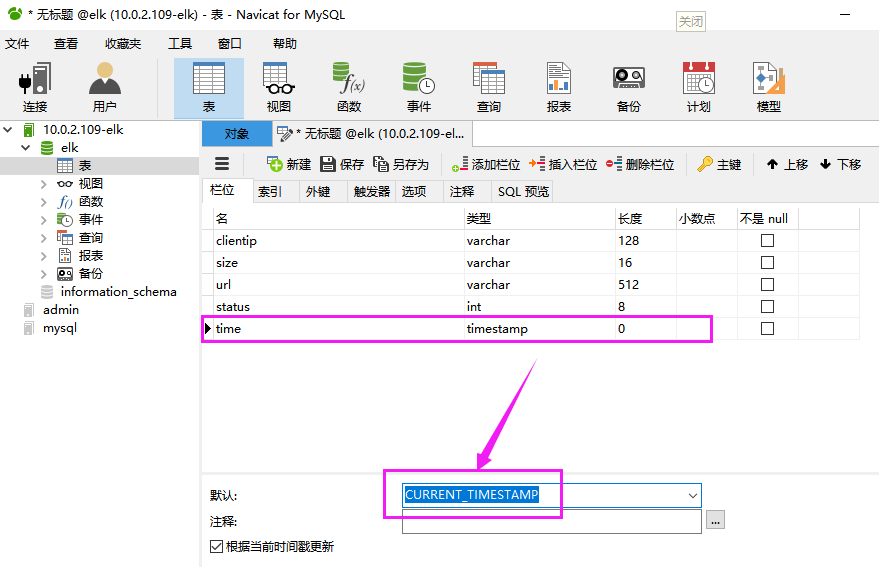
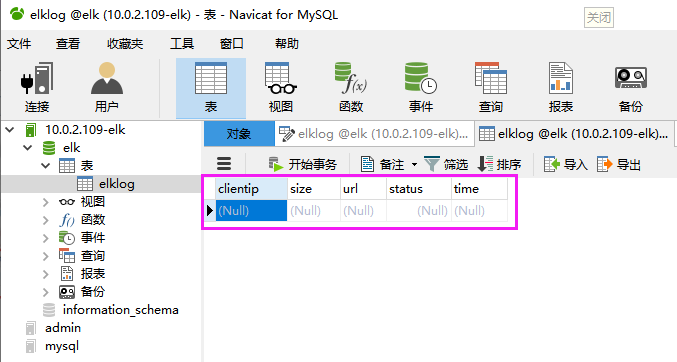
[root@logstash-to-es ~]#cat /etc/logstash/conf.d/linux41-nginx-accesslog-to-es.conf
input {
  kafka {
    bootstrap_servers => "10.0.4.101:9092"
    topics => "filebeat-linux41-logs"
    codec => "json"
    consumer_threads => 1
    #decorate_events => true #是否装饰事件
  }

  redis {
    host => "10.0.2.105"
    port => "6379"
    password => 123456
    db => 5
    data_type => list
    key => "linux41-filebeat-systemlog"
  }

  redis {
    host => "10.0.2.105"
    port => "6379"
    password => 123456
    db => 5
    data_type => list
    key => "linux41-filebeat-nginx-accesslog"
  }
}

output {
  if [fields][type] == "systemlog" {
    elasticsearch {
      hosts => ["10.0.2.101:9200"]
      index => "logstash-filebeat-linux41-systemlog-%{+YYYY.MM.dd}"
    }
  }

  if [fields][type] == "nginx-accesslog" {
    elasticsearch {
      hosts => ["10.0.2.101:9200"]
      index => "logstash-filebeat-linux41-nginx-accesslog-%{+YYYY.MM.dd}"
    }
  }

  jdbc {
    connection_string => "jdbc:mysql://10.0.2.109/elk?user=elk&password=123456&useUnicode=true&characterEncoding=UTF8"
    statement => ["INSERT INTO elklog(clientip,size,url,status) VALUES(?,?,?,?)","clientip","size","url","status"]
  }
}
[root@logstash-to-es ~]# /usr/share/logstash/bin/logstash -f /etc/logstash/conf.d/linux41-nginx-accesslog-to-es.conf -t
[root@logstash-to-es ~]# systemctl restart logstash
[root@linux-host2 ~]# ab -n10 -c5 http://192.168.15.12:8080/webdir/index.html
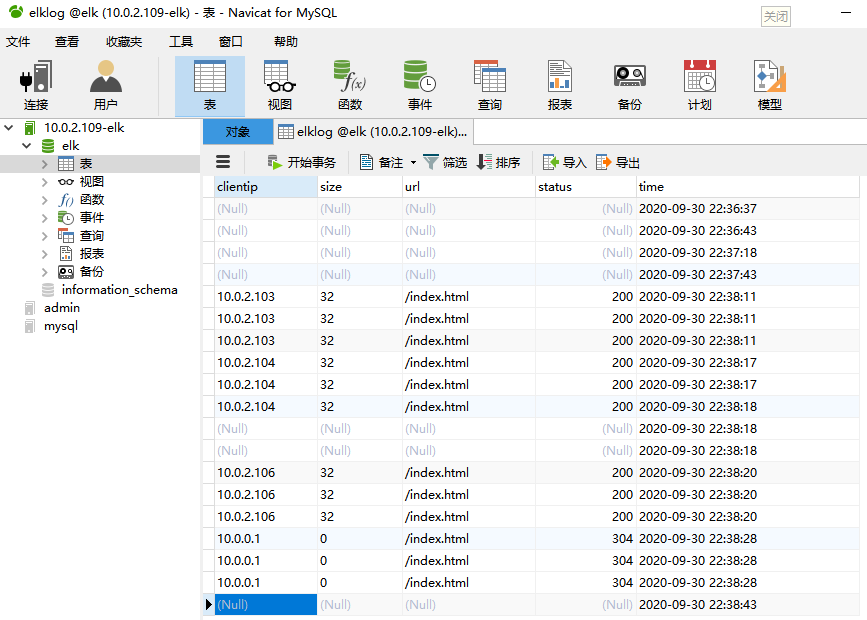
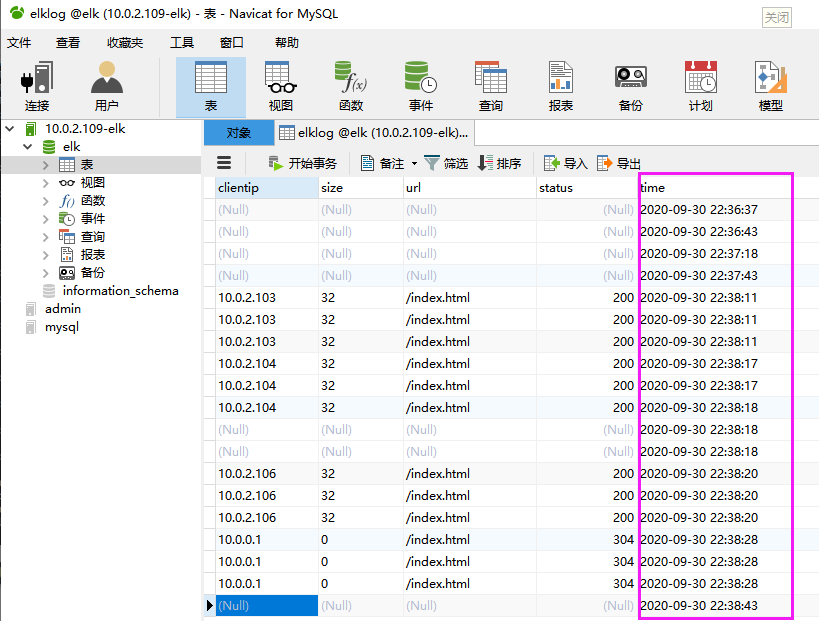
https://www.elastic.co/guide/cn/kibana/current/introduction.html
Kibana 支持多重图从展示功能,需要日志是 json 格式的支持,具体如新

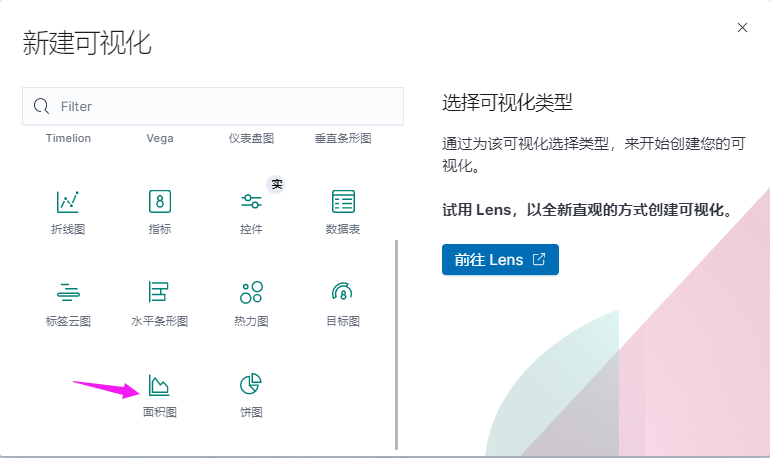
选择要统计的 index 名称
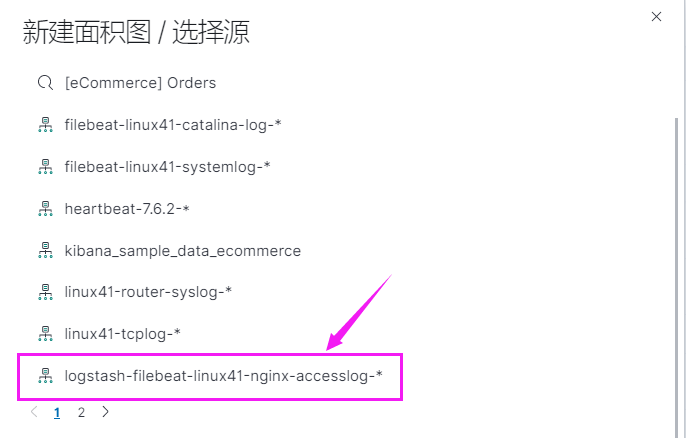
定义查询的信息及属性
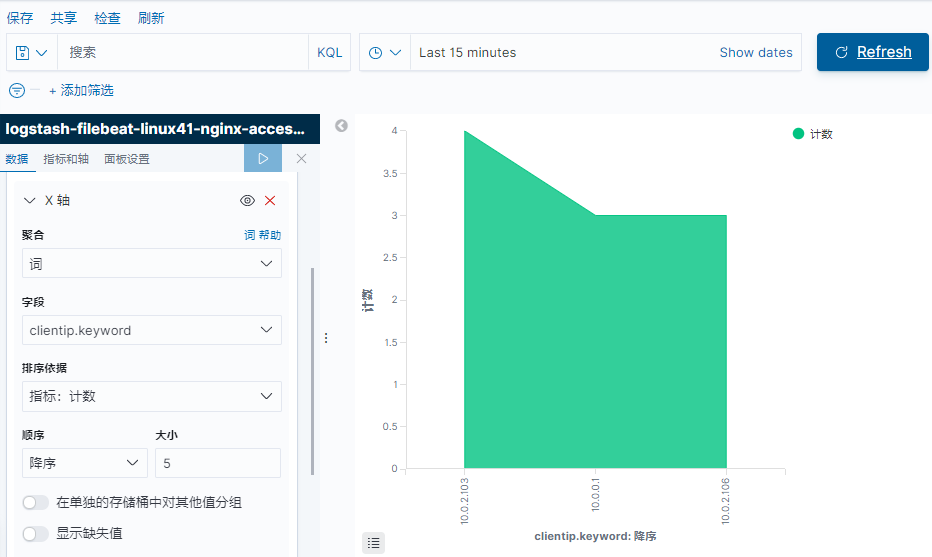
保存查询结果, 方便下次可以直接点击查询

下次点击 visualize 之后,可以直接自定义名称进行查询

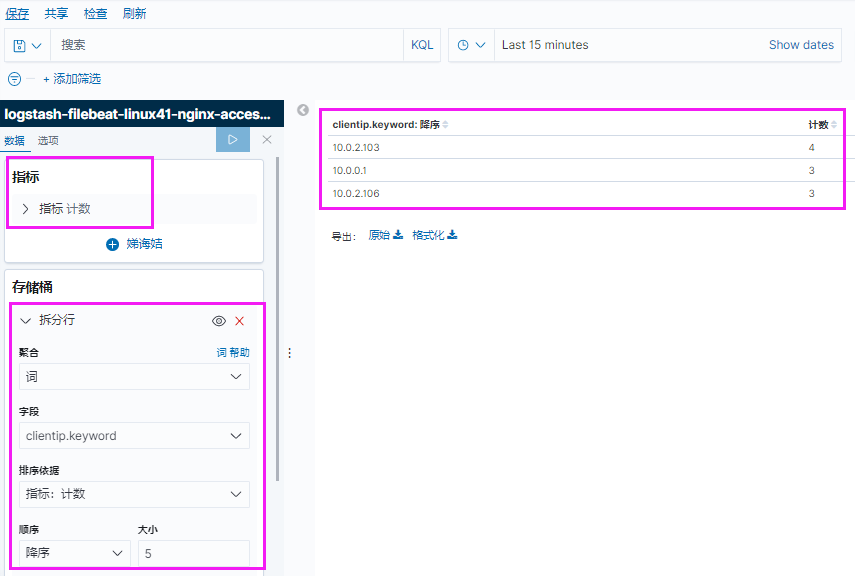
可以讲结果导出, 通过 excel 查看
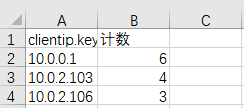

可以自定义颜色显示
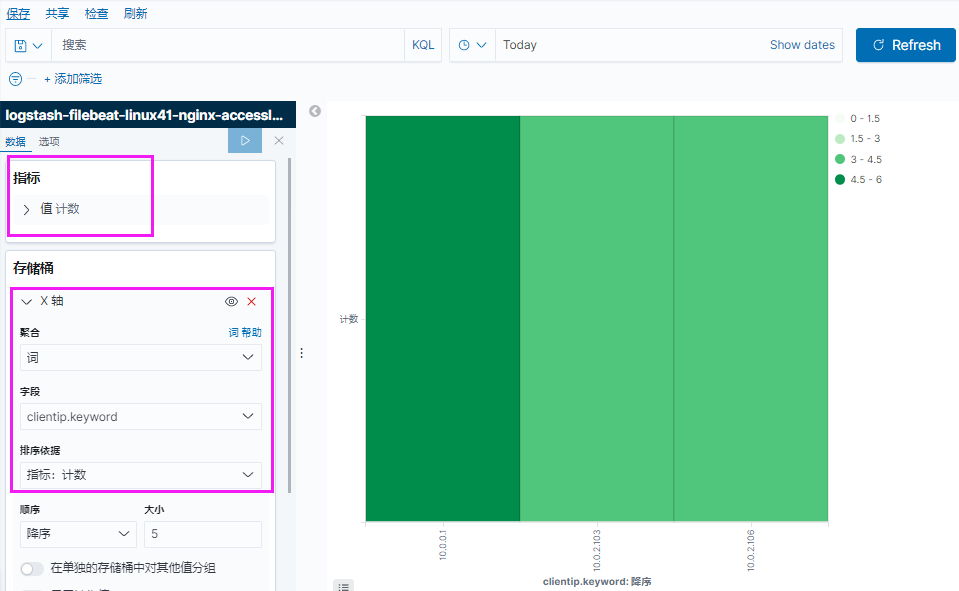
保存热图

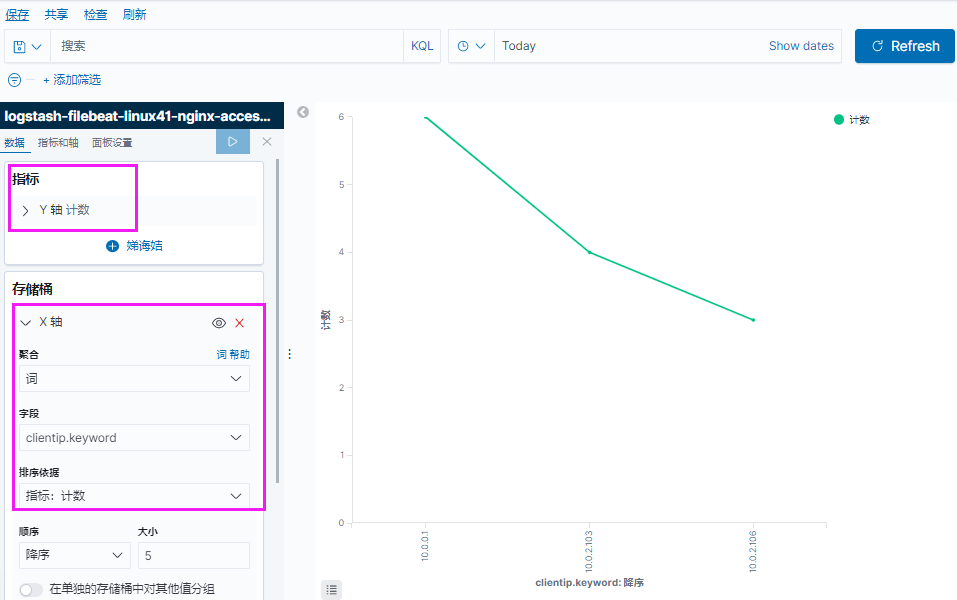
保存折线图

| 日期 | 联系电话 | 姓名 |
|---|---|---|
| 周一 | 18600000001 | user1 |
| 周二 | 18600000002 | user2 |
| 周三 | 18600000003 | user3 |
| 周四 | 18600000004 | user4 |
| 周五 | 18600000005 | user5 |
| 周六 | 18600000006 | user6 |
| 周日 | 18600000007 | user7 |
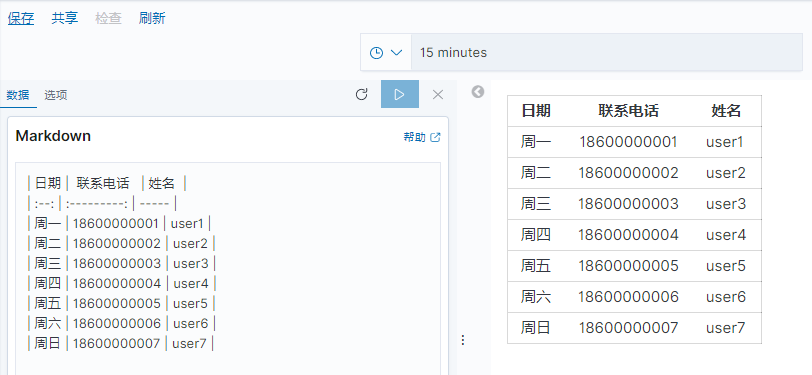
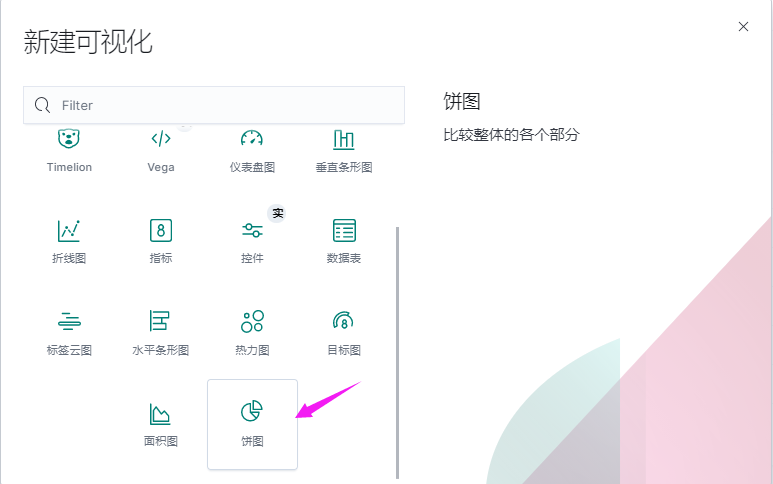
6.8.1 kibana:
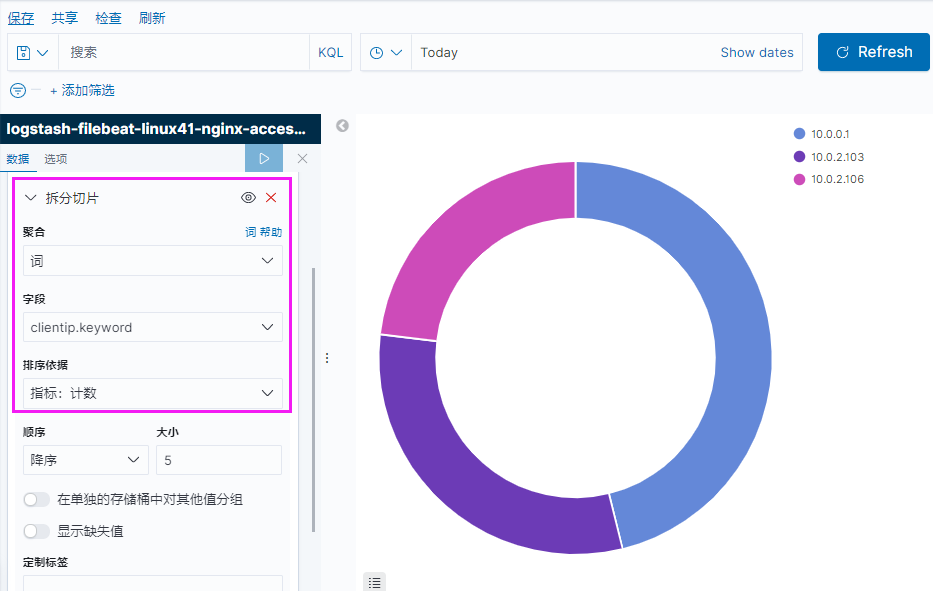
5 版本 kibana
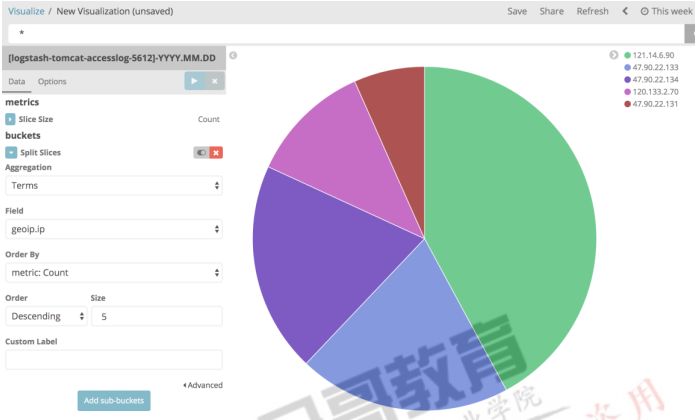

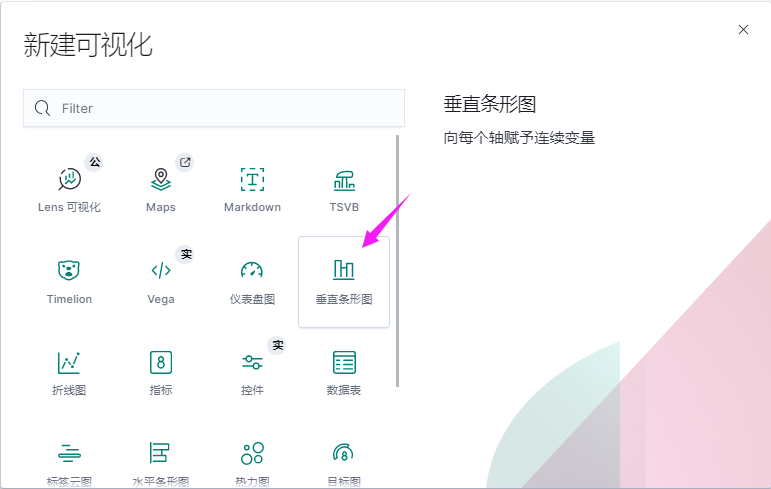
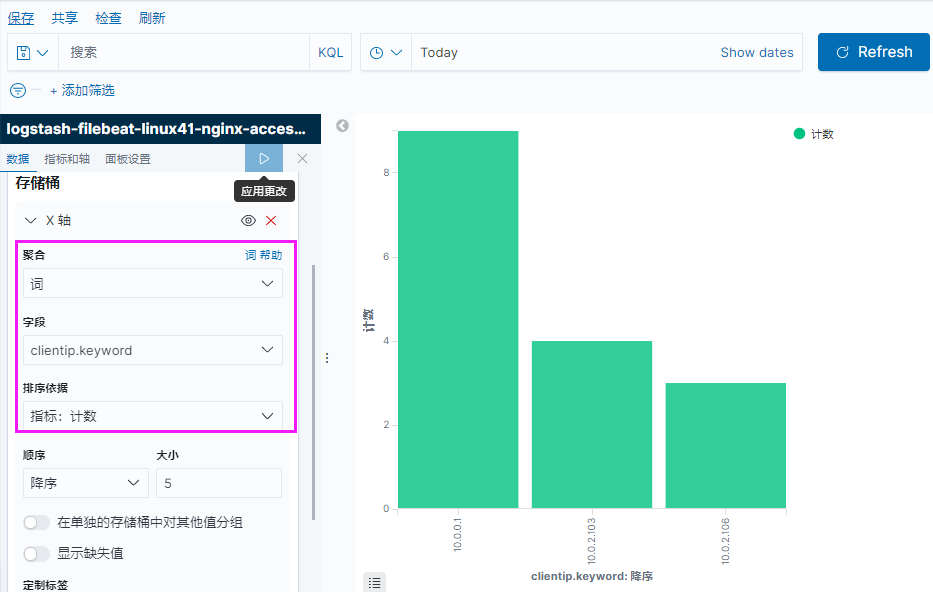

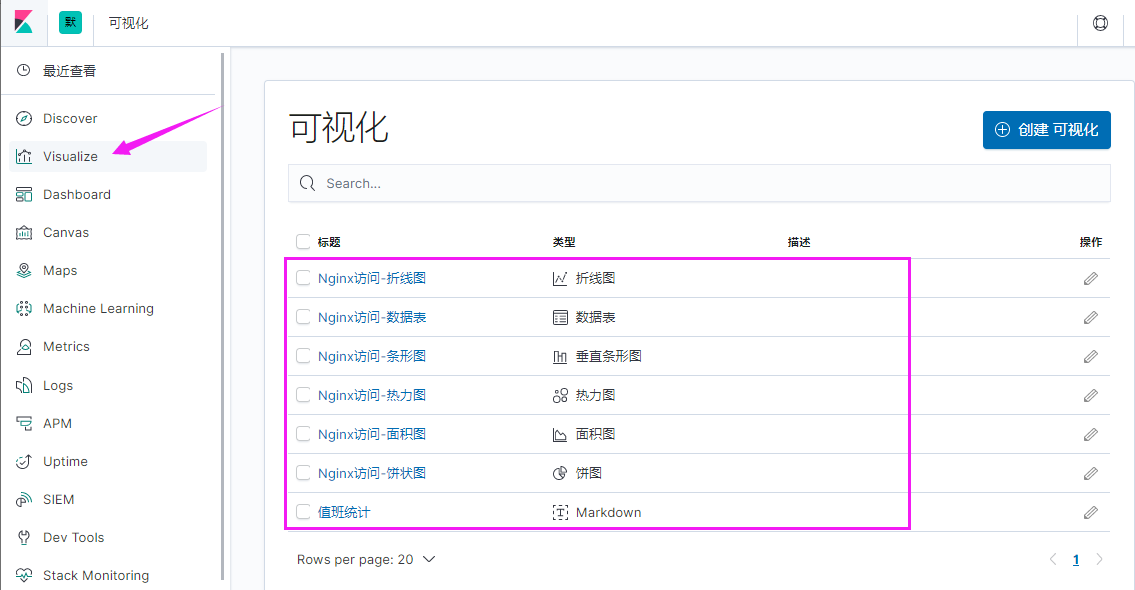
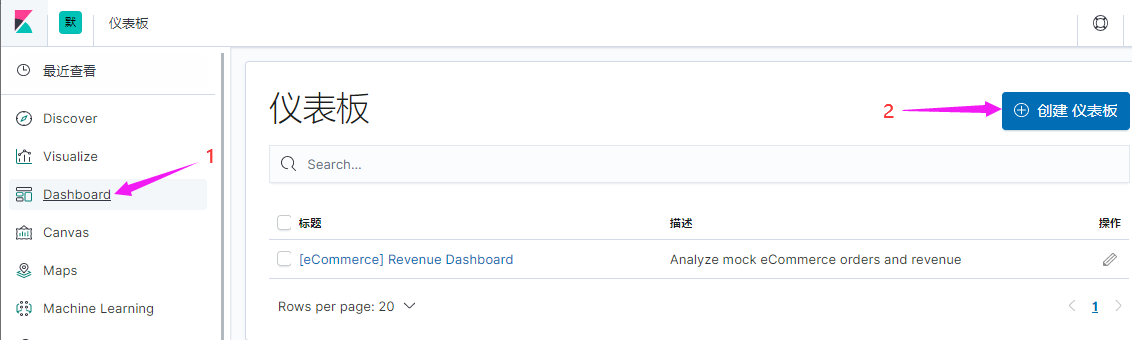
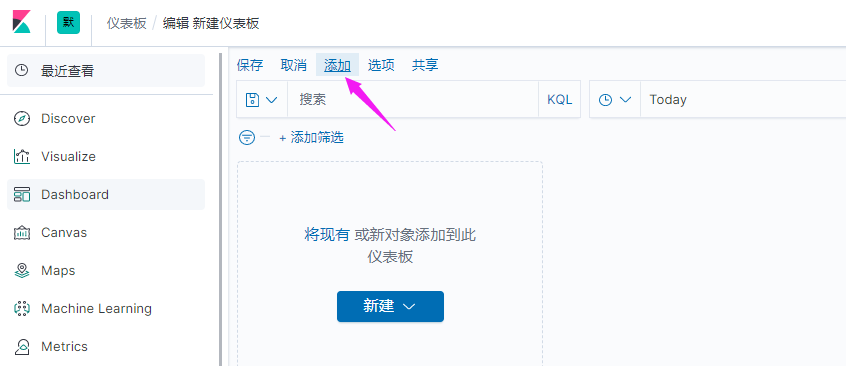
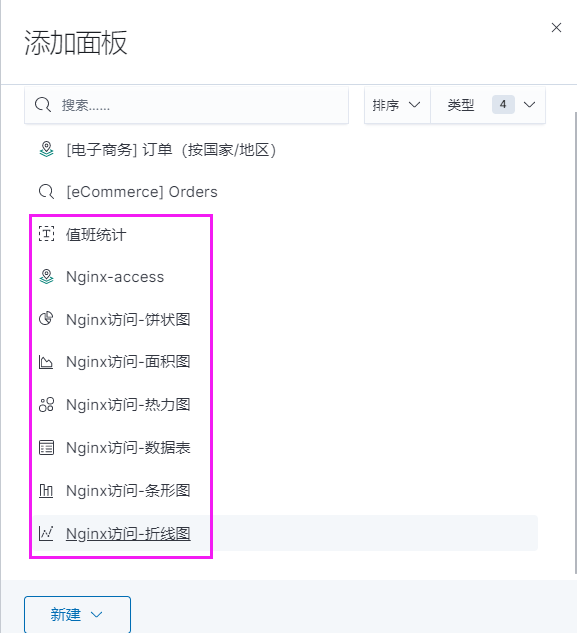

当前保存好的单个图形
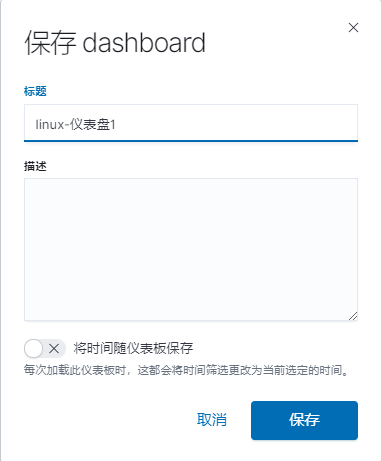
添加图形后的结果
在添加一个地图
a-Z ↩︎