我是作者ternplot。正如你所猜测的那样,ternpcolor不会做你想做的事,因为它是为自动网格数据而构建的。回想起来,这并不是一个特别明智的决定,我做了笔记改变设计。同时这段代码应该做你想做的事:
编辑:我更改了代码以查找两条曲线的交点,而不仅仅是一条曲线。
N = 10;
x = linspace(0, 1, N);
y = x;
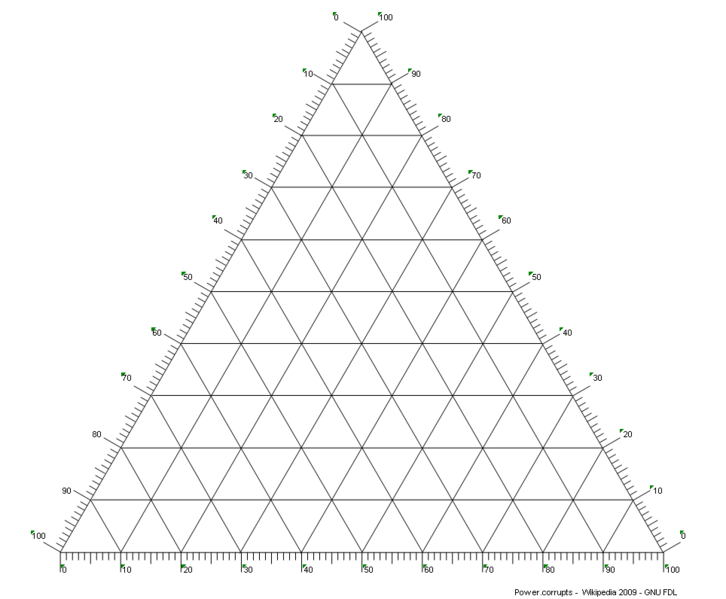
% The grid intersections on your diagram are actually rectangularly arranged,
% so meshgrid will build the intersections for us
[xx, yy] = meshgrid(x, y);
zz = 1 - (xx + yy);
% now that we've got the intersections, we can evaluate the function
f1 = @(x, y) 2*x.^2 + 3*y.^2 + 0.1;
Fxy1 = f1(xx, yy);
Fxy1(xx + yy > 1) = nan;
f2 = @(x, y) 3*x.^2 + 2*y.^2;
Fxy2 = f2(xx, yy);
Fxy2(xx + yy > 1) = nan;
f3 = @(x, y) (3*x.^2 + 2*y.^2) * 1000; % different order of magnitude
Fxy3 = f3(xx, yy);
Fxy3(xx + yy > 1) = nan;
subplot(1, 2, 1)
% This constructs the ternary axes
ternaxes(5);
% These are the coordinates of the compositions mapped to plot coordinates
[xg, yg] = terncoords(xx, yy);
% simpletri constructs the correct triangles
tri = simpletri(N);
hold on
% and now we can plot
trisurf(tri, xg, yg, Fxy1);
trisurf(tri, xg, yg, Fxy2);
hold off
view([137.5, 30]);
subplot(1, 2, 2);
ternaxes(5)
% Here we plot the line of intersection of the two functions
contour(xg, yg, Fxy1 - Fxy2, [0 0], 'r')
axis equal

编辑2:如果你想找到两个轮廓之间的交点,你实际上是在求解两个联立方程。这段额外的代码将为您解决这个问题(请注意,我现在也在上面的代码中使用了一些匿名函数):
f1level = 1;
f3level = 1000;
intersection = fsolve(@(v) [f1(v(1), v(2)) - f1level; f3(v(1), v(2)) - f3level], [0.5, 0.4]);
% if you don't have the optimization toolbox, this command works almost as well
intersection = fminsearch(@(v) sum([f1(v(1), v(2)) - f1level; f3(v(1), v(2)) - f3level].^2), [0.5, 0.4]);

ternaxes(5)
hold on
contour(xg, yg, Fxy1, [f1level f1level]);
contour(xg, yg, Fxy3, [f3level f3level]);
ternplot(intersection(1), intersection(2), 1 - sum(intersection), 'r.');
hold off