找到detect.py,在大概113行,找到plot_one_box
                # Write results
                for *xyxy, conf, cls in reversed(det):
                    if save_txt:  # Write to file
                        xywh = (xyxy2xywh(torch.tensor(xyxy).view(1, 4)) / gn).view(-1).tolist()  # normalized xywh
                        with open(txt_path + '.txt', 'a') as f:
                            f.write(('%g ' * 5 + '\n') % (cls, *xywh))  # label format

                    if save_img or view_img:  # Add bbox to image
                        label = '%s %.2f' % (names[int(cls)], conf)
                        plot_one_box(xyxy, im0, label=label, color=colors[int(cls)], line_thickness=3)
ctr+鼠标点击,进入general.py,并自动定位到plot_one_box函数,修改函数为
def plot_one_box(x, img, color=None, label=None, line_thickness=None):
# Plots one bounding box on image img
tl = line_thickness or round(0.002 * (img.shape[0] + img.shape[1]) / 2) + 1 # line/font thickness
color = color or [random.randint(0, 255) for _ in range(3)]
c1, c2 = (int(x[0]), int(x[1])), (int(x[2]), int(x[3]))
cv2.rectangle(img, c1, c2, color, thickness=tl, lineType=cv2.LINE_AA)
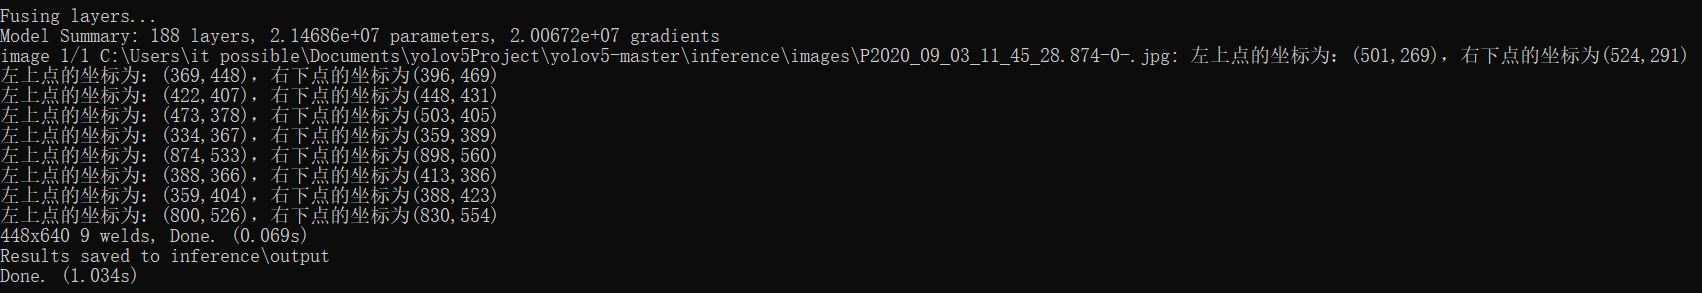
print("左上点的坐标为:(" + str(c1[0]) + "," + str(c1[1]) + "),右下点的坐标为(" + str(c2[0]) + "," + str(c2[1]) + ")")
即可输出目标坐标信息了
本文内容由网友自发贡献,版权归原作者所有,本站不承担相应法律责任。如您发现有涉嫌抄袭侵权的内容,请联系:hwhale#tublm.com(使用前将#替换为@)