Matplotlib三维绘图,这一篇就够了
- 1. 效果图
- 1.1 3D线效果图
- 1.2 3D散点效果图
- 1.3 3D随机颜色散点效果图
- 1.4 3D散点不同mark点效果图
- 1.5 3D线框效果图
- 1.6 3D曲面不透明效果图
- 1.7 3D曲面透明效果图
- 2. 源码
- 参考
这篇博客将介绍使用 mplot3d 工具包进行三维绘图,支持简单的 3D 图形,包括曲面、线框、散点图和条形图。
1. 效果图
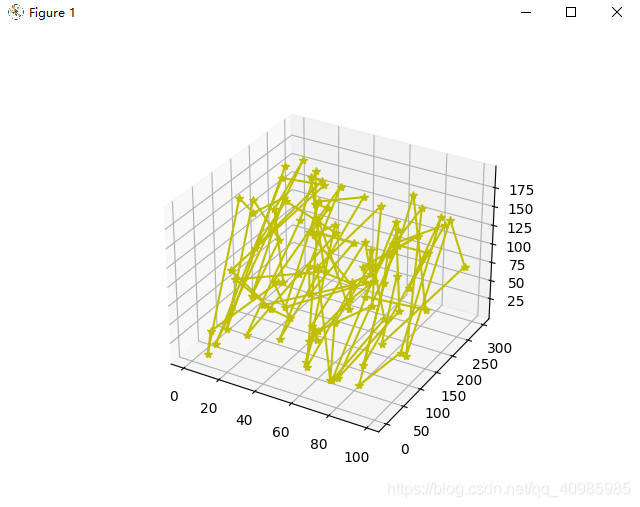
1.1 3D线效果图
3D线图效果如下:
可自定义线的颜色及点的样式;
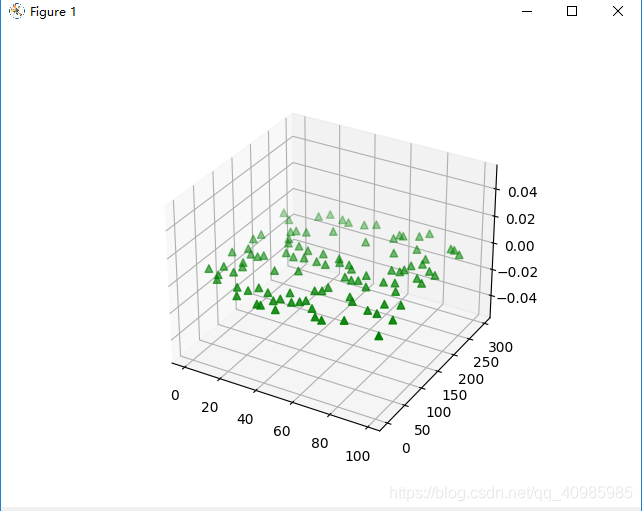
1.2 3D散点效果图
3D散点图(标记了着色以呈现深度外观)效果如下:
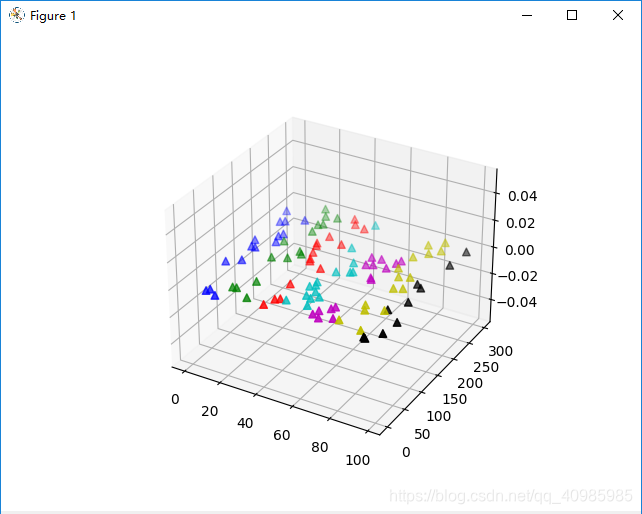
1.3 3D随机颜色散点效果图
3D随机颜色散点图效果如下:
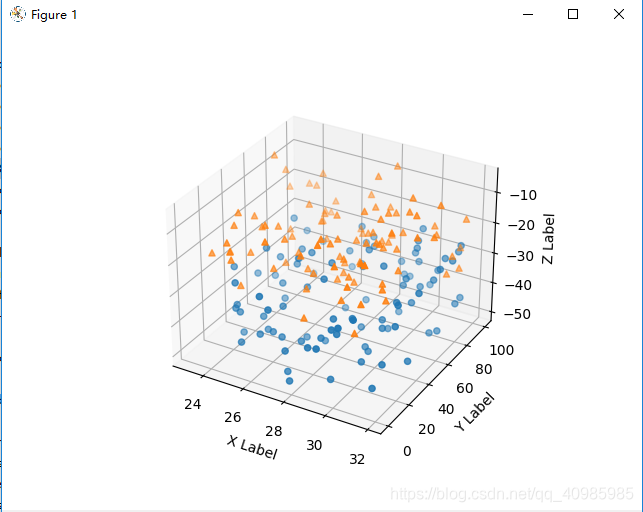
1.4 3D散点不同mark点效果图
3D官方散点图不同mark点效果如下:
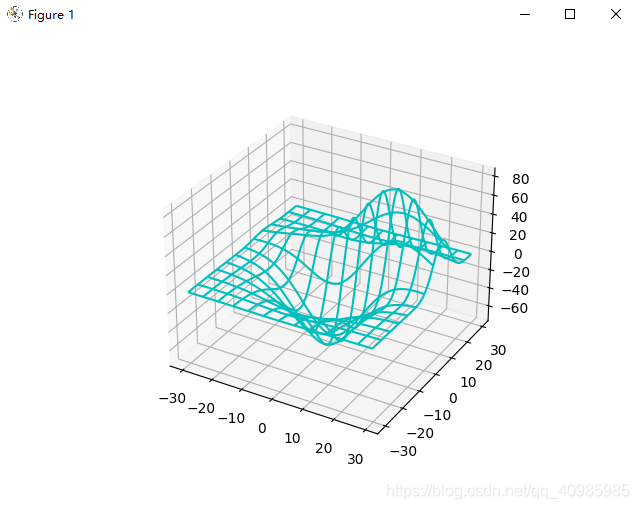
1.5 3D线框效果图
3D线框图效果如下:
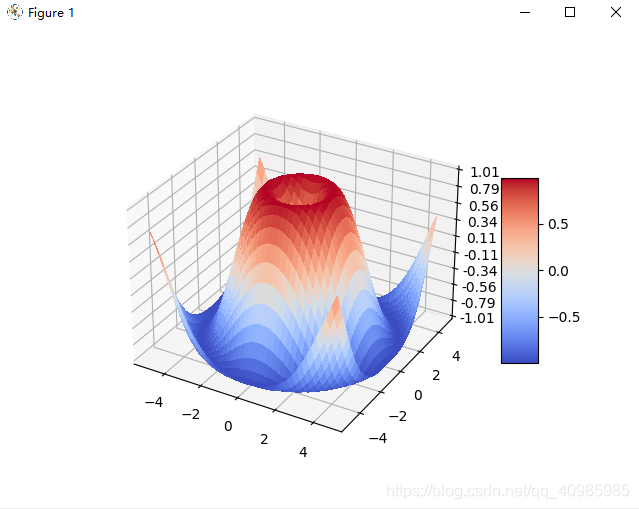
1.6 3D曲面不透明效果图
3D曲面图不透明如下:
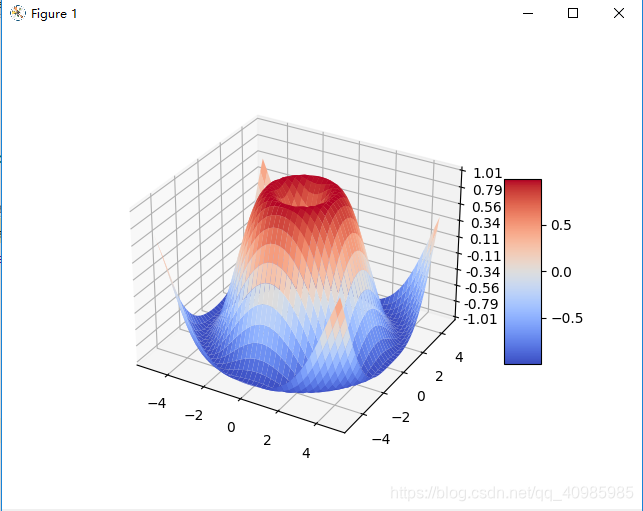
1.7 3D曲面透明效果图
3D曲面图透明如下:
2. 源码
from mpl_toolkits.mplot3d import axes3d
import matplotlib.pyplot as plt
import numpy as np
x = np.arange(100)
y = np.random.randint(0, 300, 100)
z = np.random.randint(0, 200, 100)
def line_3d():
fig = plt.figure()
ax = fig.add_subplot(projection='3d')
ax.plot(xs=x, ys=y, zs=z, c="y", marker="*")
plt.show()
def scatter_3d():
fig = plt.figure()
ax = fig.add_subplot(projection='3d')
ax.scatter(xs=x, ys=y, zs=0, zdir='z', s=30, c="g", depthshade=True, cmap="jet", marker="^")
plt.show()
def randrange(n, vmin, vmax):
"""
Helper function to make an array of random numbers having shape (n, )
with each number distributed Uniform(vmin, vmax).
"""
return (vmax - vmin) * np.random.rand(n) + vmin
def scatter_random_color_3d():
fig = plt.figure()
ax = fig.add_subplot(projection='3d')
colors = ['b', 'g', 'r', 'c', 'm', 'y', 'k', 'w']
c = np.repeat(colors, 15)[:100]
ax.scatter(xs=x, ys=y, zs=0, zdir='z', s=30, c=c, depthshade=True, cmap="jet", marker="^")
plt.show()
np.random.seed(19680801)
fig = plt.figure()
ax = fig.add_subplot(projection='3d')
n = 100
for m, zlow, zhigh in [('o', -50, -25), ('^', -30, -5)]:
xs = randrange(n, 23, 32)
ys = randrange(n, 0, 100)
zs = randrange(n, zlow, zhigh)
ax.scatter(xs, ys, zs, marker=m)
ax.set_xlabel('X Label')
ax.set_ylabel('Y Label')
ax.set_zlabel('Z Label')
plt.show()
def wireframe_3d():
fig = plt.figure()
ax = fig.add_subplot(projection='3d')
x = np.random.randint(-30, high=30, size=(50,)).reshape((25, 2))
y = np.random.randint(-30, high=30, size=(50,)).reshape((25, 2))
z = np.zeros(50).reshape((25, 2))
ax.plot_wireframe(x, y, z, color='m')
plt.show()
fig = plt.figure()
ax = fig.add_subplot(projection='3d')
X, Y, Z = axes3d.get_test_data(0.05)
ax.plot_wireframe(X, Y, Z, color='c', rstride=10, cstride=10)
plt.show()
def surface_3d():
import matplotlib.pyplot as plt
from matplotlib import cm
from matplotlib.ticker import LinearLocator
import numpy as np
fig, ax = plt.subplots(subplot_kw={"projection": "3d"})
X = np.arange(-5, 5, 0.25)
Y = np.arange(-5, 5, 0.25)
X, Y = np.meshgrid(X, Y)
R = np.sqrt(X ** 2 + Y ** 2)
Z = np.sin(R)
surf = ax.plot_surface(X, Y, Z, cmap=cm.coolwarm,
linewidth=0, antialiased=False)
ax.set_zlim(-1.01, 1.01)
ax.zaxis.set_major_locator(LinearLocator(10))
ax.zaxis.set_major_formatter('{x:.02f}')
fig.colorbar(surf, shrink=0.5, aspect=5)
plt.show()
fig, ax = plt.subplots(subplot_kw={"projection": "3d"})
surf = ax.plot_surface(X, Y, Z, cmap=cm.coolwarm,
linewidth=0, antialiased=True)
ax.set_zlim(-1.01, 1.01)
ax.zaxis.set_major_locator(LinearLocator(10))
ax.zaxis.set_major_formatter('{x:.02f}')
fig.colorbar(surf, shrink=0.5, aspect=5)
plt.show()
def tri_surface_3d():
n_radii = 8
n_angles = 36
radii = np.linspace(0.125, 1.0, n_radii)
angles = np.linspace(0, 2 * np.pi, n_angles, endpoint=False)[..., np.newaxis]
x = np.append(0, (radii * np.cos(angles)).flatten())
y = np.append(0, (radii * np.sin(angles)).flatten())
z = np.sin(-x * y)
ax = plt.figure().add_subplot(projection='3d')
ax.plot_trisurf(x, y, z, linewidth=0.2, antialiased=True)
plt.show()
line_3d()
scatter_3d()
scatter_random_color_3d()
wireframe_3d()
surface_3d()
tri_surface_3d()
参考
- https://matplotlib.org/stable/tutorials/toolkits/mplot3d.html#toolkit-mplot3d-tutorial
本文内容由网友自发贡献,版权归原作者所有,本站不承担相应法律责任。如您发现有涉嫌抄袭侵权的内容,请联系:hwhale#tublm.com(使用前将#替换为@)