目前python,spark,scala十分火爆,于是我就利用爬虫将猎聘上的招聘信息进行了一下获取,相比起来,猎聘上的职位数量还是很多的,3中技术类型以“python,spark,scala”作为关键词,一共爬取了一万多条信息,爬取的主要信息为:公司名称,职位名称,薪资,地址,职位信息。最后将爬取后的数据,进行了简单的处理,进行可视化。
数据获取
爬虫的写法可以查看https://blog.csdn.net/qq_36389249/article/details/87275723,数据爬取主要利用的是selenium,数据使用数据库的方式进行存放
数据展示
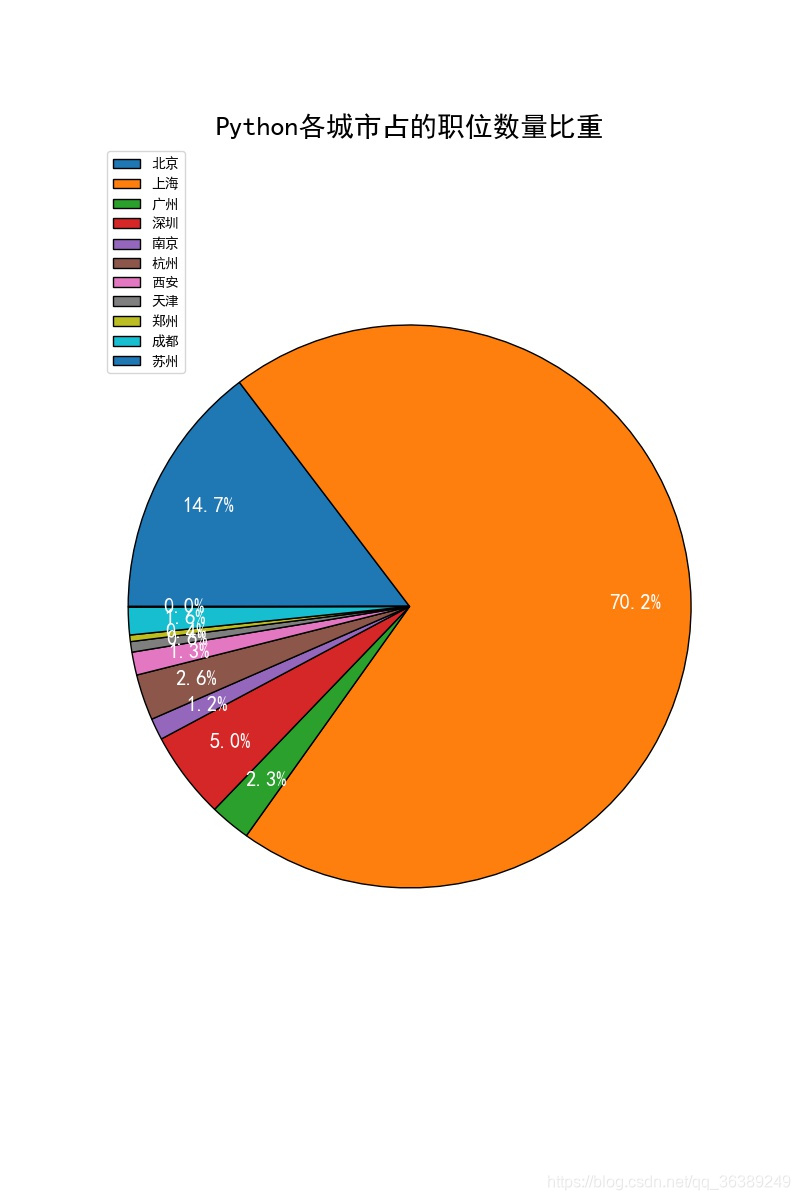
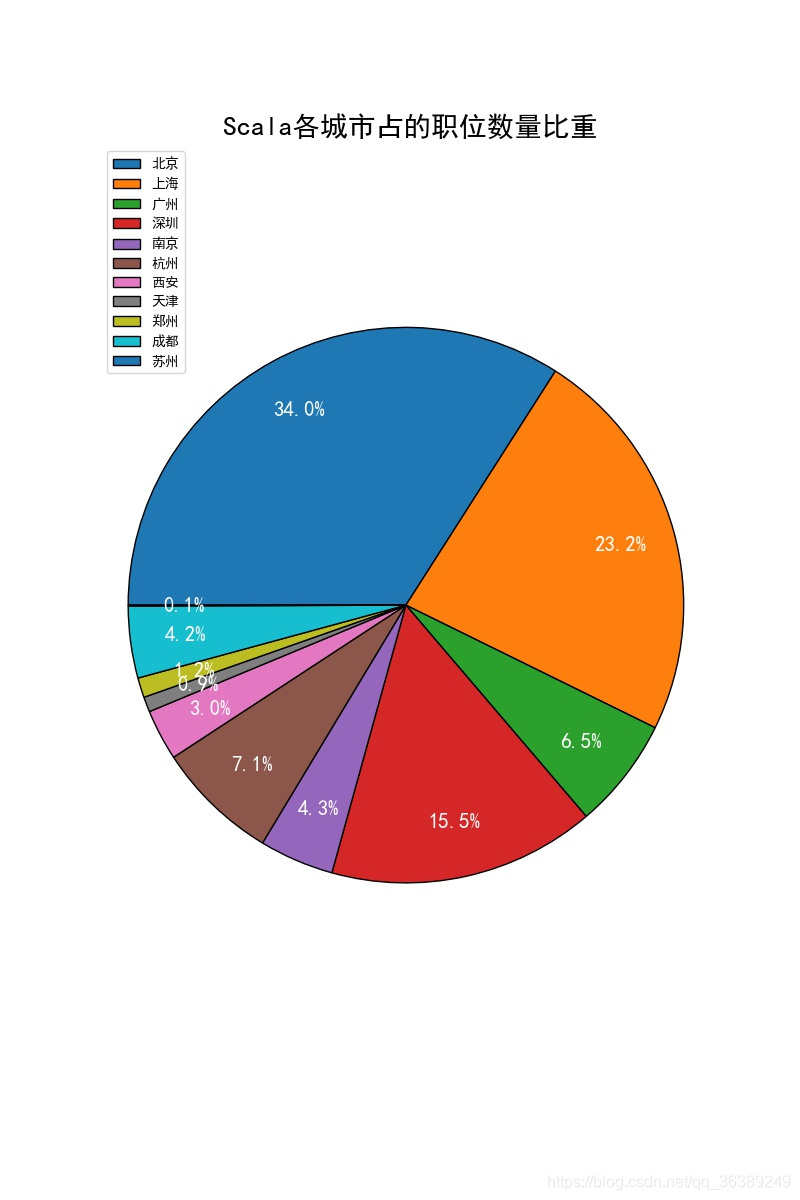
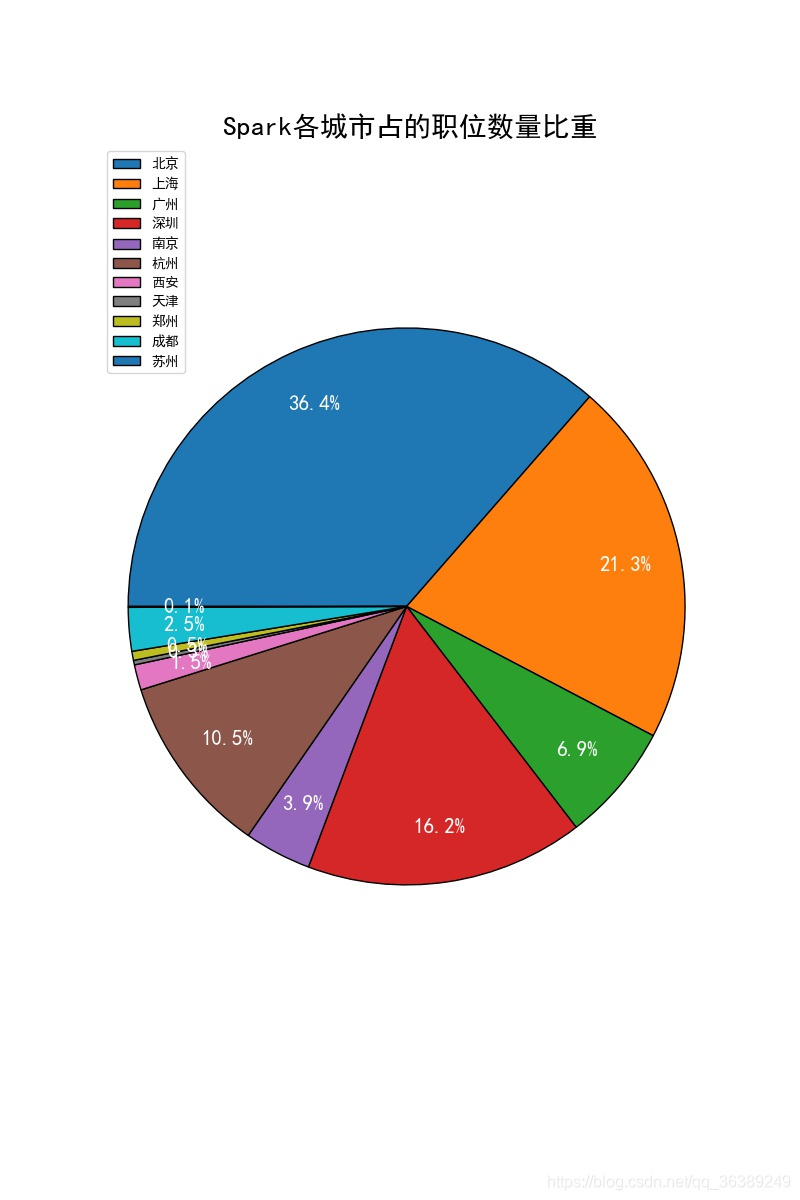
上面3个图分别代表的是,python,Scala,saprk的职位数量在城市在'北京', '上海', '广州', '深圳', '南京', '杭州', '西安', '天津', '郑州', '成都', '苏州'的占比,可以很直观在扇形中的看到,大都集中在北京和上海这两个城市,找工作的各位看官,如果想拥有更多的机会,可以考虑下。
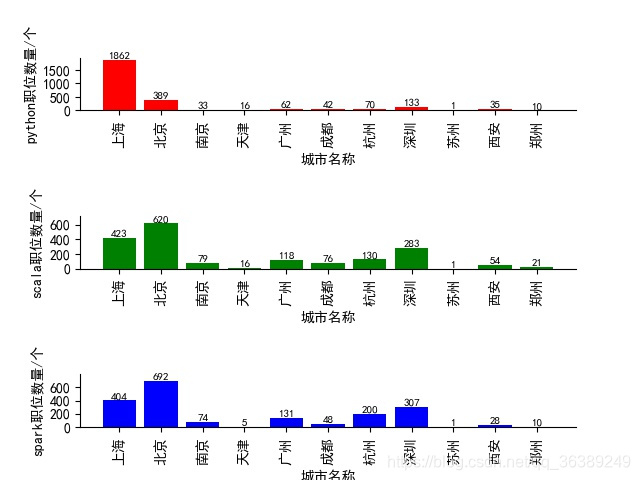
这个图是在'北京', '上海', '广州', '深圳', '南京', '杭州', '西安', '天津', '郑州', '成都', '苏州'这几个城市中,发布在猎聘上的数据职位数量信息,还是很多的,至于数量最多的城市也就还是上海和北京。
还有就是我还做了python,spark,scala这三个的薪资的分析,首先是对python的薪资的分析,
{'面议': 879, '18-36万': 140, '12-24万': 135, '12-18万': 128, '18-30万': 123, '24-48万': 80, '18-24万': 76, '10-18万': 66, '24-36万': 53, '20-39万': 37, '13-20万': 28, '18-54万': 28, '24-42万': 26, '36-60万': 26, '30-60万': 24, '21-35万': 23, '21-42万': 23, '20-33万': 22, '24-30万': 22, '26-52万': 22, '10-14万': 21, '14-24万': 20, '13-26万': 20, '7-10万': 18, '10-19万': 17, '30-42万': 17, '7-12万': 17, '21-28万': 16, '12-22万': 16, '10-12万': 16, '23-38万': 15, '14-29万': 15, '10-24万': 15, '5-7万': 15, '7-14万': 14, '14-21万': 14, '30-45万': 13, '14-22万': 13, '30-36万': 13, '30-53万': 12, '14-28万': 12, '20-26万': 12, '8-18万': 12, '28-56万': 12, '16-30万': 11, '8-17万': 10, '11-18万': 10, '22-36万': 10, '26-39万': 10, '36-48万': 10, '28-42万': 10, '12-19万': 10, '16-26万': 9, '13-39万': 9, '12-36万': 9, '30-48万': 9, '14-18万': 8, '10-17万': 8, '14-30万': 8, '42-78万': 8, '23-45万': 8, '36-72万': 8, '11-22万': 8, '22-58万': 8, '12-30万': 8, '7-18万': 7, '6-12万': 7, '6-10万': 7, '10-20万': 7, '35-70万': 7, '13-33万': 7, '33-65万': 7, '11-21万': 6, '19-24万': 6, '10-16万': 6, '7-11万': 6, '22-30万': 6, '14-19万': 6, '12-14万': 6, '24-40万': 6, '30-54万': 5, '5-10万': 5, '24-38万': 5, '12-17万': 5, '35-49万': 5, '8-24万': 5, '18-27万': 5, '39-65万': 5, '27-45万': 5, '48-84万': 5, '18-42万': 4, '42-54万': 4, '2-5万': 4, '16-24万': 4, '16-31万': 4, '18-34万': 4, '35-56万': 4, '33-52万': 4, '16-32万': 4, '11-17万': 4, '28-49万': 4, '18-26万': 4, '17-34万': 4, '4-5万': 4, '15-30万': 4, '21-29万': 4, '14-20万': 4, '16-20万': 4, '12-20万': 4, '17-28万': 4, '23-30万': 4, '19-40万': 4, '12-21万': 4, '10-22万': 4, '36-54万': 4, '45-60万': 4, '19-29万': 4, '16-23万': 3, '13-19万': 3, '26-46万': 3, '18-19万': 3, '19-38万': 3, '23-33万': 3, '10-13万': 3, '8-13万': 3, '8-14万': 3, '6-7万': 3, '8-11万': 3, '18-28万': 3, '13-21万': 3, '14-25万': 3, '45-90万': 3, '8-12万': 3, '16-22万': 3, '13-23万': 3, '8-16万': 3, '7-13万': 3, '14-26万': 3, '26-43万': 3, '48-72万': 3, '33-46万': 3, '29-38万': 3, '18-23万': 3, '11-13万': 3, '20-30万': 3, '27-40万': 3, '20-40万': 3, '13-14万': 3, '24-34万': 2, '12-16万': 2, '14-23万': 2, '33-59万': 2, '25-39万': 2, '34-48万': 2, '20-23万': 2, '48-80万': 2, '20-36万': 2, '11-16万': 2, '19-36万': 2, '14-17万': 2, '18-22万': 2, '17-25万': 2, '20-27万': 2, '26-59万': 2, '17-39万': 2, '32-48万': 2, '26-51万': 2, '22-28万': 2, '45-75万': 2, '12-25万': 2, '10-23万': 2, '21-39万': 2, '18-18万': 2, '65-104万': 2, '11-19万': 2, '4-6万': 2, '18-25万': 2, '9-16万': 2, '40-76万': 2, '39-52万': 2, '16-29万': 2, '22-32万': 2, '30-38万': 2, '42-48万': 2, '35-63万': 2, '41-60万': 2, '51-68万': 2, '5-8万': 2, '24-50万': 2, '20-50万': 2, '44-65万': 2, '19-26万': 2, '60-96万': 2, '24-35万': 2, '21-24万': 2, '15-23万': 2, '11-28万': 2, '27-54万': 2, '22-43万': 2, '27-42万': 2, '38-68万': 2, '20-60万': 2, '35-42万': 2, '28-39万': 1, '22-34万': 1, '17-33万': 1, '10-10万': 1, '25-42万': 1, '21-30万': 1, '38-75万': 1, '13-16万': 1, '2-3万': 1, '17-22万': 1, '17-24万': 1, '16-34万': 1, '16-18万': 1, '9-13万': 1, '21-33万': 1, '17-29万': 1, '23-53万': 1, '22-39万': 1, '14-35万': 1, '15-28万': 1, '42-63万': 1, '20-46万': 1, '22-24万': 1, '7-8万': 1, '54-108万': 1, '10-21万': 1, '25-49万': 1, '27-60万': 1, '11-14万': 1, '26-54万': 1, '10-11万': 1, '16-21万': 1, '27-63万': 1, '27-53万': 1, '18-29万': 1, '40-80万': 1, '20-20万': 1, '8-19万': 1, '5-11万': 1, '15-31万': 1, '16-40万': 1, '23-46万': 1, '13-25万': 1, '7-20万': 1, '6-14万': 1, '30-50万': 1, '22-26万': 1, '60-84万': 1, '13-22万': 1, '15-35万': 1, '17-35万': 1, '14-31万': 1, '48-64万': 1, '240-270万': 1, '42-60万': 1, '30-46万': 1, '19-30万': 1, '84-120万': 1, '24-32万': 1, '54-90万': 1, '36-46万': 1, '26-36万': 1, '26-65万': 1, '14-36万': 1, '24-26万': 1, '22-48万': 1, '36-66万': 1, '17-36万': 1, '52-78万': 1, '27-35万': 1, '18-48万': 1, '43-60万': 1, '42-84万': 1, '11-15万': 1, '26-33万': 1, '47-92万': 1, '42-49万': 1, '29-42万': 1, '30-41万': 1, '29-41万': 1, '30-43万': 1, '24-45万': 1, '72-108万': 1, '21-31万': 1, '40-50万': 1, '38-53万': 1, '23-29万': 1, '22-42万': 1, '65-91万': 1, '17-49万': 1, '53-98万': 1, '20-35万': 1, '27-33万': 1, '25-35万': 1, '104-143万': 1, '6-11万': 1, '46-65万': 1, '66-102万': 1, '17-21万': 1, '32-64万': 1, '36-42万': 1, '33-39万': 1, '9-12万': 1, '38-60万': 1, '18-35万': 1, '1-2万': 1, '13-18万': 1, '15-25万': 1}
sprak的薪资分析:
{'面议': 624, '18-30万': 106, '18-36万': 85, '18-24万': 73, '24-48万': 69, '12-24万': 62, '24-36万': 47, '12-18万': 47, '36-60万': 38, '30-60万': 37, '24-42万': 32, '10-14万': 31, '14-35万': 29, '14-24万': 27, '10-18万': 26, '30-48万': 26, '20-33万': 24, '13-26万': 16, '30-42万': 15, '36-72万': 15, '36-48万': 15, '26-52万': 15, '6-10万': 14, '28-56万': 13, '21-35万': 13, '20-39万': 12, '21-42万': 12, '24-30万': 10, '42-70万': 10, '45-75万': 10, '10-19万': 10, '14-29万': 9, '26-39万': 9, '35-70万': 9, '18-35万': 9, '22-36万': 8, '52-78万': 8, '12-19万': 8, '22-30万': 8, '26-46万': 8, '28-49万': 8, '7-14万': 7, '36-54万': 7, '18-42万': 7, '30-53万': 7, '18-26万': 7, '16-31万': 7, '10-12万': 7, '39-78万': 6, '20-26万': 6, '54-90万': 6, '48-72万': 6, '84-120万': 6, '33-52万': 6, '39-65万': 6, '24-60万': 6, '13-33万': 6, '35-56万': 6, '20-31万': 6, '7-18万': 6, '23-45万': 5, '45-60万': 5, '16-26万': 5, '14-21万': 5, '10-22万': 5, '60-96万': 5, '13-21万': 5, '56-84万': 5, '45-90万': 5, '48-84万': 5, '11-18万': 5, '10-21万': 5, '1-2万': 5, '11-14万': 5, '22-42万': 5, '30-36万': 4, '33-46万': 4, '48-80万': 4, '14-22万': 4, '23-38万': 4, '30-45万': 4, '30-54万': 4, '72-108万': 4, '12-22万': 4, '60-105万': 4, '17-33万': 4, '2-4万': 4, '38-75万': 4, '42-78万': 4, '14-28万': 4, '8-17万': 4, '6-12万': 4, '30-50万': 4, '33-65万': 4, '23-52万': 4, '14-30万': 3, '36-42万': 3, '11-22万': 3, '20-42万': 3, '28-42万': 3, '12-29万': 3, '25-42万': 3, '65-104万': 3, '19-38万': 3, '20-29万': 3, '12-30万': 3, '21-29万': 3, '5-7万': 3, '14-26万': 3, '18-48万': 3, '16-24万': 3, '32-56万': 3, '42-54万': 3, '18-31万': 3, '22-43万': 3, '22-34万': 3, '34-67万': 3, '13-24万': 3, '42-72万': 3, '42-56万': 3, '23-39万': 3, '13-16万': 3, '60-72万': 3, '8-14万': 3, '33-59万': 3, '10-16万': 3, '13-23万': 3, '30-46万': 2, '19-30万': 2, '10-20万': 2, '19-26万': 2, '23-33万': 2, '22-31万': 2, '24-40万': 2, '16-23万': 2, '25-35万': 2, '60-84万': 2, '18-34万': 2, '104-143万': 2, '14-19万': 2, '12-17万': 2, '11-19万': 2, '49-70万': 2, '17-28万': 2, '19-22万': 2, '17-26万': 2, '16-30万': 2, '10-17万': 2, '11-21万': 2, '90-135万': 2, '32-64万': 2, '38-60万': 2, '13-39万': 2, '20-41万': 2, '5-10万': 2, '24-49万': 2, '23-46万': 2, '15-30万': 2, '9-18万': 2, '18-23万': 2, '15-22万': 2, '2-5万': 2, '26-38万': 2, '19-36万': 2, '5-6万': 2, '13-18万': 2, '27-53万': 2, '29-41万': 2, '6-8万': 2, '32-66万': 2, '17-32万': 2, '10-24万': 2, '7-10万': 2, '28-35万': 1, '16-21万': 1, '21-28万': 1, '7-20万': 1, '30-38万': 1, '4-6万': 1, '34-60万': 1, '38-45万': 1, '13-22万': 1, '36-46万': 1, '35-63万': 1, '39-46万': 1, '11-17万': 1, '8-10万': 1, '23-47万': 1, '23-60万': 1, '33-39万': 1, '12-20万': 1, '31-49万': 1, '34-55万': 1, '39-59万': 1, '60-90万': 1, '8-13万': 1, '120000-180000万': 1, '36-67万': 1, '26-29万': 1, '44-65万': 1, '19-50万': 1, '70-112万': 1, '52-91万': 1, '33-53万': 1, '49-91万': 1, '15-45万': 1, '29-35万': 1, '15-20万': 1, '68-113万': 1, '38-74万': 1, '10-29万': 1, '16-22万': 1, '20-30万': 1, '23-42万': 1, '17-34万': 1, '75-98万': 1, '36-52万': 1, '24-38万': 1, '20-46万': 1, '16-25万': 1, '17-35万': 1, '20-50万': 1, '16-18万': 1, '26-65万': 1, '12-36万': 1, '9-16万': 1, '42-48万': 1, '26-32万': 1, '23-30万': 1, '10-23万': 1, '39-52万': 1, '24-34万': 1, '38-53万': 1, '48-60万': 1, '17-24万': 1}
scala的薪资分析:
{'面议': 649, '18-36万': 117, '24-48万': 102, '18-30万': 90, '12-18万': 55, '24-36万': 53, '12-24万': 50, '10-18万': 39, '18-24万': 37, '30-60万': 35, '36-60万': 29, '30-42万': 23, '24-42万': 22, '21-35万': 21, '30-48万': 20, '10-14万': 19, '23-45万': 17, '28-56万': 16, '22-36万': 16, '21-42万': 15, '16-30万': 15, '26-52万': 14, '36-72万': 14, '20-33万': 13, '20-39万': 13, '12-22万': 12, '10-12万': 11, '48-72万': 11, '36-54万': 11, '14-28万': 11, '7-14万': 10, '14-30万': 10, '30-36万': 10, '13-20万': 10, '30-54万': 9, '22-30万': 9, '24-60万': 9, '14-24万': 9, '13-26万': 8, '24-30万': 8, '28-49万': 8, '48-84万': 8, '28-42万': 7, '65-104万': 7, '33-65万': 7, '12-30万': 7, '10-19万': 7, '39-52万': 7, '19-30万': 7, '25-49万': 7, '21-49万': 6, '20-26万': 6, '14-29万': 6, '42-70万': 6, '42-84万': 6, '35-56万': 6, '17-33万': 5, '25-35万': 5, '36-48万': 5, '14-22万': 5, '38-60万': 5, '35-70万': 5, '18-48万': 5, '35-49万': 5, '39-65万': 4, '30-53万': 4, '22-34万': 4, '60-96万': 4, '12-36万': 4, '18-23万': 4, '18-35万': 4, '33-46万': 4, '14-21万': 4, '8-17万': 4, '38-75万': 4, '16-31万': 4, '10-24万': 4, '21-28万': 3, '52-78万': 3, '54-90万': 3, '19-50万': 3, '42-60万': 3, '14-35万': 3, '6-10万': 3, '45-75万': 3, '56-84万': 3, '39-78万': 3, '2-4万': 3, '16-24万': 3, '26-36万': 3, '16-26万': 3, '22-42万': 3, '26-46万': 3, '60-84万': 3, '8-12万': 3, '7-12万': 3, '56-98万': 3, '48-56万': 3, '20-36万': 3, '14-25万': 3, '38-53万': 3, '24-41万': 3, '12-19万': 3, '18-26万': 2, '42-72万': 2, '17-25万': 2, '18-25万': 2, '13-21万': 2, '42-78万': 2, '11-21万': 2, '16-32万': 2, '7-10万': 2, '72-108万': 2, '16-22万': 2, '9-16万': 2, '26-39万': 2, '42-56万': 2, '20-29万': 2, '32-64万': 2, '23-39万': 2, '23-38万': 2, '18-42万': 2, '24-34万': 2, '29-58万': 2, '8-14万': 2, '19-36万': 2, '22-43万': 2, '15-30万': 2, '19-42万': 2, '12-14万': 2, '10-17万': 2, '26-51万': 2, '60-105万': 2, '60-72万': 2, '30-38万': 2, '20-28万': 2, '45-90万': 2, '10-13万': 2, '17-24万': 2, '30-40万': 2, '28-36万': 2, '54-108万': 2, '10-16万': 2, '42-80万': 2, '27-53万': 2, '11-22万': 2, '10-20万': 2, '72-96万': 2, '48-54万': 2, '18-28万': 2, '40-80万': 2, '12-29万': 2, '60-90万': 2, '48-80万': 1, '15-22万': 1, '46-78万': 1, '108-132万': 1, '13-22万': 1, '36-66万': 1, '17-26万': 1, '26-29万': 1, '11-28万': 1, '16-23万': 1, '27-45万': 1, '25-42万': 1, '32-44万': 1, '58-72万': 1, '2-5万': 1, '5-6万': 1, '8-13万': 1, '40-64万': 1, '11-14万': 1, '16-21万': 1, '17-30万': 1, '20-52万': 1, '28-63万': 1, '30-43万': 1, '20-60万': 1, '30-68万': 1, '20-38万': 1, '84-112万': 1, '23-46万': 1, '33-52万': 1, '34-48万': 1, '29-45万': 1, '22-39万': 1, '64-112万': 1, '13-24万': 1, '17-28万': 1, '19-26万': 1, '21-29万': 1, '17-23万': 1, '48-96万': 1, '8-18万': 1, '7-13万': 1, '12-23万': 1, '6-8万': 1, '46-65万': 1, '30-45万': 1, '64-96万': 1, '42-66万': 1, '22-29万': 1, '56-88万': 1, '21-56万': 1, '18-18万': 1, '20-42万': 1, '31-48万': 1, '39-70万': 1, '45-99万': 1, '28-70万': 1, '24-32万': 1, '15-23万': 1, '29-48万': 1, '17-34万': 1, '29-63万': 1, '24-38万': 1, '17-27万': 1, '42-48万': 1, '12-20万': 1, '59-78万': 1, '14-26万': 1, '32-48万': 1, '31-50万': 1, '75-120万': 1, '13-23万': 1, '42-49万': 1, '54-78万': 1, '36-42万': 1, '4-6万': 1, '28-50万': 1, '26-65万': 1, '45-68万': 1, '49-70万': 1, '4-7万': 1, '11-18万': 1, '43-68万': 1, '5-7万': 1, '23-29万': 1, '22-56万': 1, '12-17万': 1, '10-22万': 1, '4-4万': 1, '56-75万': 1, '38-45万': 1, '4-10万': 1, '13-33万': 1, '23-33万': 1, '34-38万': 1, '18-34万': 1, '19-38万': 1, '22-32万': 1}
可以看到这个薪资水平真的很恐怖。。。。。(4000块的我瑟瑟发抖啊)。。。
这个薪资拿起来其实并不容易,看下有关职位信息的词云就明白了。


3个词云图分别是python,spark,scala的,可见开发经验是十分重要的啊,不难发现,其实3-5年的就是大佬。所以我还是安心搬砖吧
while(1):
    print("工作需要经验")
    print("找工作")
    if("你有钱"):
        break
print("睡醒了")
介绍下,上面个数据可视化的做法主要使用的为matplotlib的库。至于说词云的话,那个很简单,这个图表的制作其实也不难,主要就是对人家库的应用。都说用python就是站在巨人的肩膀上,我发现被人站在肩膀上,我在巨人的脚脖子上。
from collections import Counter
import pymysql
import re
from decimal import Decimal
import matplotlib.pyplot as plt
from matplotlib.gridspec import GridSpec
from matplotlib import collections, colors, transforms
from matplotlib.ticker import MultipleLocator,FormatStrFormatter
import numpy as np
import pandas as pd
import time#因为多个图片显示加入了睡眠,方便数据观察
import random
from pylab import *

global my_address
my_address = ['北京', '上海', '广州', '深圳', '南京', '杭州', '西安', '天津', '郑州', '成都', '苏州']
def link_mysql():
    config = {
        'host':'127.0.0.1',
        'user':'root',
        'passwd':'1995104',
        'port':8080,
        'db':'lp',
        'charset':'utf8',
    }
    #进行数据库的连接
    conn = pymysql.connect(**config)
    #获取游标
    cur = conn.cursor()
    #数据读取主要读取内容为地区。
    sql = "select address from python;"
    global python_address
    cur.execute(sql)
    python_address = cur.fetchall()
    sql = "select address from spark;"
    global spark_address
    cur.execute(sql)
    spark_address = cur.fetchall()
    # print(spark_address)
    sql = "select address from scala;"
    global scala_address
    cur.execute(sql)
    scala_address = cur.fetchall()
    # print(scala_address)

    #读取数据获取薪资的列数据
    sql = 'select salary from python;'
    global python_salary
    cur.execute(sql)
    python_salary = cur.fetchall()
    sql = 'select salary from scala;'
    global scala_salary
    cur.execute(sql)
    scala_salary = cur.fetchall()
    sql = 'select salary from spark;'
    global spark_salary
    cur.execute(sql)
    spark_salary = cur.fetchall()
    # print(python_salary)
    # print(scala_salary)
    # print(spark_salary)

    # 获取区域内的工资情况,应为城市数据大多分布在北京 上海 深圳 广州 杭州。
    global python_address_salary
    #获取所有的工资数据
    python_address_salary = {'北京':[], '上海':[], '广州':[], '深圳':[],
                             '南京':[], '杭州':[], '西安':[], '天津':[],
                             '郑州':[], '成都':[], '苏州':[]}
    sql = 'select * from python limit {},1;'
    for i in range(0,len(python_address)):
        cur.execute(sql.format(str(i)))
        address_ = cur.fetchall()[0][3]
        #利用正则表达式获取地区
        address_ = re.findall('[\u4e00-\u9fa5]*',address_)
        # print(address)
        cur.execute(sql.format(str(i)))
        salary = cur.fetchall()[0][4]
        # print(salary)
        # address = re.findall('[\u4e00-\u9fa5]*',address)
        #获取对应地区的薪资内容
        for j in range(0,len(my_address)):
            if address_[0] == my_address[j]:
                python_address_salary[my_address[j]].append(salary)
    # print(python_address_salary)
    #scala的数据内容
    global scala_address_salary
    scala_address_salary = {'北京': [], '上海': [], '广州': [], '深圳': [],
                             '南京': [], '杭州': [], '西安': [], '天津': [],
                             '郑州': [], '成都': [], '苏州': []}
    sql = 'select * from scala limit {},1;'
    for i in range(0, len(scala_address)):
        cur.execute(sql.format(str(i)))
        #通过正则表达式获取地址数据
        address_ = cur.fetchall()[0][3]
        address_ = re.findall('[\u4e00-\u9fa5]*', address_)
        # print(address)
        cur.execute(sql.format(str(i)))
        salary = cur.fetchall()[0][4]
        # print(salary)
        # address = re.findall('[\u4e00-\u9fa5]*',address)
        for j in range(0,len(my_address)):
            if address_[0] == my_address[j]:
                scala_address_salary[my_address[j]].append(salary)

    # print(scala_address_salary)

    #spark的数据展示
    global spark_address_salary
    spark_address_salary = {'北京': [], '上海': [], '广州': [], '深圳': [],
                            '南京': [], '杭州': [], '西安': [], '天津': [],
                            '郑州': [], '成都': [], '苏州': []}
    sql = 'select * from spark limit {},1;'
    for i in range(0, len(spark_address)):
        cur.execute(sql.format(str(i)))
        address_ = cur.fetchall()[0][3]
        address_ = re.findall('[\u4e00-\u9fa5]*', address_)
        # print(address)
        cur.execute(sql.format(str(i)))
        salary = cur.fetchall()[0][4]
        # address = re.findall('[\u4e00-\u9fa5]*',address)
        for j in range(0,len(my_address)):
            if address_[0] == my_address[j]:
                spark_address_salary[my_address[j]].append(salary)

    # print(spark_address_salary)
    cur.close()
    conn.close()

def get_address():
    global scala_add
    add = []
    str_my = ''
    #分析scala的主要职聘地址
    for scala in scala_address:
        scala = re.match('[\u4e00-\u9fa5]+',scala[0])
        add.append(scala)
    for m_scala in add:
        if m_scala is not None:
            # print(m_scala.group())
            str_my = str_my+m_scala.group(0)+'\n'
    # print(str_my)
    new_txt = re.split('\W+',str_my)
    result = Counter(new_txt)
    global result_scala_address
    result_scala_address = result.most_common(len(scala_address))
    # print(result_scala_address)
    str_my_b = ''
    add.clear()
    #分析python的地址
    for python in python_address:
        python = re.match('[\u4e00-\u9fa5]+',python[0])
        add.append(python)
    for m_python in add:
        if m_python is not None:
            str_my_b = str_my_b+m_python.group(0)+'\n'
    new_txt = re.split('\W+',str_my_b)
    result = Counter(new_txt)
    global result_python_address
    result_python_address = result.most_common(len(python_address))
    # print(result_python_address)
    str_my_a = ''
    add.clear()
    #分析spark的主要地址
    for spark in spark_address:
        spark = re.match('[\u4e00-\u9fa5]+',spark[0])
        add.append(spark)
    for m_spark in add:
        if m_spark is not None:
            str_my_a = str_my_a+m_spark.group(0)+'\n'
    new_txt = re.split('\W+',str_my_a)
    result = Counter(new_txt)
    global result_spark_address
    result_spark_address = result.most_common(len(spark_address))
    # print(result_spark_address)
    # b = 0
    # for  a in result_python_address:
    #     b =  a[1]+b
    # print(b)
    #获取百分比 百分比在绘制扇形图时已经实现,注释多余程序
    # global n_python,address
    # n_python = []
    # address = []
    # for result in result_python_address:
    #     n_python.append(float(Decimal(result[1]/len(python_address)).quantize(Decimal('0.000'))))
    #     address.append(result[0])
    # n_python = dict(zip(address,n_python))
    # # print(n_python)
    #
    # address.clear()
    # global n_scala
    # n_scala = []
    # for result in result_scala_address:
    #     n_scala.append(float(Decimal(result[1]/len(scala_address)).quantize(Decimal('0.000'))))
    #     address.append(result[0])
    # n_scala = dict(zip(address,n_scala))
    # # print(n_scala)
    #
    # address.clear()
    # global n_spark
    # n_spark = []
    # for result in result_spark_address:
    #     n_spark.append(float(Decimal(result[1]/len(spark_address)).quantize(Decimal('0.000'))))
    #     address.append(result[0])
    # n_spark = dict(zip(address,n_spark))
    # print(n_spark)

#获取薪资
def get_salary():
    str_ = ''
    global result_python_salary
    for python in python_salary:
        str_ = str_+python[0].replace('万','')+' '
    str_.replace('万', ' ')
    result_python_salary = str_
    str_ = ''
    global result_scala_salary
    for scala in scala_salary:
        str_ = str_+scala[0].replace('万','')+' '
    str_.replace('万', ' ')
    result_scala_salary = str_
    str_ = ''
    global result_spark_salary
    for spark in spark_salary:
        str_ = str_+spark[0].replace('万','')+' '
    str_.replace('面议','')
    result_spark_salary = str_

    new_txt = re.split(' ',result_python_salary)
    result = Counter(new_txt)
    result_python_salary = result.most_common(len(result_python_salary))

    new_txt = re.split(' ', result_scala_salary)
    result = Counter(new_txt)
    result_scala_salary = result.most_common(len(result_scala_salary))

    new_txt = re.split(' ', result_spark_salary)
    result = Counter(new_txt)
    result_spark_salary = result.most_common(len(result_spark_salary))

    result1 =  []
    result2 = []
    for result in result_python_salary:
        if result[0] == "":
            continue
        else:
            if (result[0] != '面议'):
                result1.append(result[0] + '万')
            else:
                result1.append(result[0])
            result2.append(result[1])
    result_python_salary = dict(zip(result1,result2))

    result1 =  []
    result2 = []
    for result in result_scala_salary:
        if result[0] == "":
            continue
        else:
            if (result[0] != '面议'):
                result1.append(result[0] + '万')
            else:
                result1.append(result[0])
            result2.append(result[1])
    result_scala_salary = dict(zip(result1,result2))

    result1 =  []
    result2 = []
    for result in result_spark_salary:
        if result[0] == "":
            continue
        else:
            if(result[0] != '面议'):
                result1.append(result[0]+'万')
            else:
                result1.append(result[0])
            result2.append(result[1])
    result_spark_salary = dict(zip(result1,result2))
    #数据表示的内容位各个类型的工资的数量情况
    print(result_python_salary)
    print(result_scala_salary)
    print(result_spark_salary)
    # #
    # print(len(result_python_salary))
    # print(len(result_scala_salary))
    # print(len(result_spark_salary))


def bar_show():

    global x1#每个城市拥有的对应职位数量
    x1 = [1]*len(my_address)
    plt.rcParams['font.sans-serif'] = ['SimHei'] #用来显示汉字
    plt.rcParams['axes.unicode_minus'] = False #用来显示负号
    #绘制默认图纸

    plt.figure(1)#创建图表
    plt.figure(2)#创建图表
    plt.figure(3)#创建图表
    plt.subplots_adjust(hspace=2)
    ax1 = plt.subplot(3,1,1)
    ax2 = plt.subplot(3,1,2)
    ax3 = plt.subplot(3,1,3)
    #获取城市名称和数量
    for result in result_python_address:
        for i in range(0,len(my_address)-1):
            if(result[0] == my_address[i]):
                x1[i] = result[1]#对应获取城市中的职位数据

    # plt.figure(figsize=(10,8))
    #x,y的标签设置
    plt.figure(1)
    plt.sca(ax1)
    ax1.spines['top'].set_visible(False)
    ax1.spines['right'].set_visible(False)
    plt.xlabel('城市名称')
    plt.ylabel('python职位数量/个')
    plt.xticks(rotation=90,)
    # plt.yticks(np.random.randint(0,max(x1),800))
    plt.ylim((0,max(x1)+100))
    plt.yticks(np.arange(0,max(x1)+100,500))
    plt.legend()
    plt.bar(my_address,x1,color='Red')
    # plt.plot(address, x1)
    autolabe(my_address,x1)
    # plt.savefig('python.jpg')
    global x2
    x2 = [1]*len(my_address)
    plt.figure(2)
    plt.sca(ax2)
    ax2.spines['top'].set_visible(False)
    ax2.spines['right'].set_visible(False)
    for result in result_scala_address:
        for i in range(0,len(my_address)-1):
            if(result[0] == my_address[i]):
                x2[i] = result[1]#对应获取城市中的职位数据
    plt.xlabel('城市名称')
    plt.ylabel('scala职位数量/个')
    plt.xticks(rotation=90,)
    # plt.yticks(np.random.randint(0, max(x2), 800))
    plt.ylim((0,max(x2)+100))
    plt.yticks(np.arange(0,max(x2)+100,200))
    plt.legend()
    plt.bar(my_address,x2,color='GREEN')
    # plt.plot(address,x2)
    autolabe(my_address,x2)
    # plt.savefig('scala.jpg')
    global x3
    x3 = [1]*len(my_address)
    plt.figure(3)
    plt.sca(ax3)
    ax3.spines['top'].set_visible(False)
    ax3.spines['right'].set_visible(False)
    for result in result_spark_address:
        for i in range(0,len(my_address)-1):
            if(result[0] == my_address[i]):
                x3[i] = result[1]#对应获取城市中的职位数据
    # x = x1+x2+x3
    # x = {}.fromkeys(x).keys()
    # print(len(x))
    plt.xlabel('城市名称')
    plt.ylabel('spark职位数量/个')
    plt.xticks(rotation=90,)
    # plt.yticks(np.random.randint(0, max(x3), 800))
    plt.ylim((0,max(x3)+100))
    plt.yticks(np.arange(0,max(x3)+100,200))
    plt.legend()
    plt.bar(my_address,x3,color='BLUE')
    # plt.plot(address, x3)
    autolabe(my_address,x3)
    plt.savefig('resulte_address.jpg')
    plt.show()

def pie1_show():
    # grids = GridSpec(3,1)
    plt.figure(1,figsize=(8,12))#创建图表
    # plt.figure(2)#创建图表
    # plt.figure(3)#创建图表
    ax = plt.subplot()
    plt.subplots_adjust(hspace=2)
    plt.rcParams['font.sans-serif'] = ['SimHei'] #用来显示汉字
    plt.rcParams['axes.unicode_minus'] = False #用来显示负号
    plt.pie(x=x1,  # 绘图数据
            labels=my_address,  # 添加标签
            autopct='%.1f%%',  # 设置百分比的格式,这里保留一位小数
            pctdistance=0.8,  # 设置百分比标签与圆心的距离
            labeldistance=1.15,  # 设置标签与圆心的距离
            startangle=180,  # 设置饼图的初始角度
            radius=80,  # 设置饼图的半径
            counterclock=False,  # 是否逆时针,这里设置为顺时针方向
            wedgeprops={'linewidth': 1, 'edgecolor': 'black'},  # 设置饼图内外边界的属性值
            textprops={'fontsize': 15, 'color': 'w'},  # 设置文本标签的属性值
            center=(0, 0),  # 设置饼图的原点
            frame=1)  # 是否显示饼图的图框,这里设置显示
    plt.axis('equal')
    plt.legend(loc='upper left')
    # plt.axis('off') #一行代码实现去除坐标轴
    ax.spines['top'].set_visible(False)
    ax.spines['left'].set_visible(False)
    ax.spines['right'].set_visible(False)
    ax.spines['bottom'].set_visible(False)
    plt.xticks([])
    plt.yticks([])
    plt.title('Python各城市占的职位数量比重',fontsize=20)
    plt.savefig('pie1.jpg')
    plt.show()
    time.sleep(4)
def pie2_show():
    plt.figure(1, figsize=(8, 12))  # 创建图表
    ax = plt.subplot()
    plt.subplots_adjust(hspace=2)
    plt.rcParams['font.sans-serif'] = ['SimHei'] #用来显示汉字
    plt.rcParams['axes.unicode_minus'] = False #用来显示负号
    # plt.pie(x2,labels=address,autopct='%1.0f%%',startangle=90,textprops={'fontsize':8,'color':'w'},
    #         pctdistance= 0.9,radius=0.8,center=(0.5,0.5))
    # 控制x轴和y轴的范围

    plt.pie(x=x2,  # 绘图数据
            labels=my_address,  # 添加标签
            autopct='%.1f%%',  # 设置百分比的格式,这里保留一位小数
            pctdistance=0.8,  # 设置百分比标签与圆心的距离
            labeldistance=1.15,  # 设置标签与圆心的距离
            startangle=180,  # 设置饼图的初始角度
            radius=80,  # 设置饼图的半径
            counterclock=False,  # 是否逆时针,这里设置为顺时针方向
            wedgeprops={'linewidth': 1, 'edgecolor': 'black'},  # 设置饼图内外边界的属性值
            textprops={'fontsize': 15, 'color': 'w'},  # 设置文本标签的属性值
            center=(0, 0),  # 设置饼图的原点
            frame=1)  # 是否显示饼图的图框,这里设置显示
    plt.axis('equal')
    plt.legend(loc='upper left')
    ax.spines['top'].set_visible(False)
    ax.spines['left'].set_visible(False)
    ax.spines['right'].set_visible(False)
    ax.spines['bottom'].set_visible(False)
    plt.xticks([])
    plt.yticks([])
    plt.title('Scala各城市占的职位数量比重',fontsize=20)
    plt.savefig('pie2.jpg')
    plt.show()
    time.sleep(4)
def pie3_show():
    plt.figure(1, figsize=(8, 12))  # 创建图表
    plt.subplots_adjust(hspace=2)
    ax = plt.subplot()
    plt.rcParams['font.sans-serif'] = ['SimHei'] #用来显示汉字
    plt.rcParams['axes.unicode_minus'] = False #用来显示负号
    plt.pie(x=x3,  # 绘图数据
            labels=my_address,  # 添加标签
            autopct='%.1f%%',  # 设置百分比的格式,这里保留一位小数
            pctdistance=0.8,  # 设置百分比标签与圆心的距离
            labeldistance=1.15,  # 设置标签与圆心的距离
            startangle=180,  # 设置饼图的初始角度
            radius=80,  # 设置饼图的半径
            counterclock=False,  # 是否逆时针,这里设置为顺时针方向
            wedgeprops={'linewidth': 1, 'edgecolor': 'black'},  # 设置饼图内外边界的属性值
            textprops={'fontsize': 15, 'color': 'w'},  # 设置文本标签的属性值
            center=(0, 0),  # 设置饼图的原点
            frame=1)  # 是否显示饼图的图框,这里设置显示
    plt.axis('equal')
    plt.legend(loc='upper left')
    #去除坐标的周边的线
    ax.spines['top'].set_visible(False)
    ax.spines['left'].set_visible(False)
    ax.spines['right'].set_visible(False)
    ax.spines['bottom'].set_visible(False)
    plt.xticks([])
    plt.yticks([])
    plt.title('Spark各城市占的职位数量比重',fontsize=20)
    plt.savefig('pie3.jpg')
    plt.show()
#设置显示柱子上的数据
def autolabe(x,y):
    for _x, _y in zip(x, y):
        plt.text(_x, _y, '%d' % _y,
                 ha='center', va='bottom', size=8
                 )
def bar_python():
    # plt.figure(figsize=(19,13))
    fig,ax = plt.subplots()
    plt.rcParams['font.sans-serif'] = ['SimHei'] #用来显示汉字
    plt.rcParams['axes.unicode_minus'] = False #用来显示负号
    #获取Python中的薪资的数量
    salary = [salary for salary in result_python_salary.values()]
    my_type = [my_type for my_type in result_python_salary.keys()]
    # y_pos = np.arange(len(my_type))
    # perfomance = 3+10*np.random.rand(len(my_type))
    # error = np.random.rand(len(my_type))
    # ax.tick_params(which=len(my_type))
    ax.tick_params(axis = "y",width = (max(salary)+20),pad = 3)#设置坐标轴宽度
    ax.tick_params(axis = "x",width = (len(my_type)+20),pad = 3) #设置坐标轴高度

    # ax.barh(y_pos,perfomance,xerr=error,align='center',color="BLUE",ecolor='GREEN')
    # ax.set_yticks(y_pos)
    # ax.set_yticklabels(my_type)
    # ax.invert_yaxis()
    plt.ylim(0,(max(salary)+20))
    # plt.xlim(0,20)
    plt.xticks(rotation=90,)
    # autolabe(my_type,salary)
    ax.plot(my_type,salary,'o')
    for label in ax.get_xticklabels():
        label.set_visible(False)
    for label in ax.get_xticklabels()[::20]:
        label.set_visible(True)

    # plt.savefig("{}.jpg".format(date), dpi=500)
    plt.savefig("python_bar.jpg",dpi=500)
    plt.show()


if __name__ == '__main__':
    link_mysql()
    get_address()
    get_salary()
    bar_show()
    pie1_show()
    pie2_show()
    pie3_show()
    bar_python()