- 期刊: Applied Optics
- 中科院最新分区(2022年12月最新版):4区
- 影响因子(2021-2022):1.905
- 第一作者:宋丽梅
- 通讯作者:Yangang Yang
- 原文链接:Application of deep learning in quantitative analysis of the infrared spectrum of logging gas
目录
论文标题
摘要
引言
方法
A. Introduction to Infrared Spectroscopy (红外光谱学导论)
B. Introduction to Convolutional Neural Networks (卷积神经网络简介)
实验
A. Preparation of Experimental Gas (实验气体制备)
B. Spectrum Acquisition and Preprocessing (频谱采集和预处理)
C. Experiments with Elemental Gases and Mixed Gases (基本气体和混合气体的实验)
结论
论文标题
Application of deep learning in quantitative analysis of the infrared spectrum of logging gas
深度学习在测井气体红外光谱定量分析中的应用
摘要
Infrared spectrum analysis technology can perform fast and nondestructive detection of gas and has been widely used in many fields. This work studies the quantitative analysis technology of the infrared spectrum based on deep learning. The experimental results show that the quantitative analysis model of logging gas established here can reach 100% recognition accuracy for elemental gas; further, the accuracy rate of spectral of mixed gas recognition reached 98%, indicating that the infrared spectrum logging gas detection model based on deep learning can quickly and accurately perform quantitative analysis of logging gas.
红外光谱分析技术能够对气体进行快速、无损的检测,在许多领域得到了广泛的应用。 本文研究了基于深度学习的红外光谱定量分析技术。 实验结果表明,本文建立的测井气定量分析模型对元素气的识别准确率可达100%; 混合气体光谱识别准确率达98%,表明基于深度学习的红外光谱气体检测模型能够快速准确地进行测井气体定量分析。
引言
Oil and gas exploration and development play an important role in energy security, which is mainly divided into mud logging and oil testing [1,2]. Mud logging technology is the “eye” of oil and gas exploration and development. Its main function is to collect the information downhole, including information about the status, formation, pressure, and drill ability of the oil and gas layers downhole. This work mainly studies the gas logging technology, which analyzes the composition and content of hydrocarbons and nonhydrocarbon gases in the logging gas to determine the content and characteristics of oil and gas in the formation. Among them, hydrocarbon gases mainly include methane, ethane, propane, butane, and pentane; nonhydrocarbon gases mainly include oxygen, nitrogen, carbon monoxide, carbon dioxide, hydrogen sulfide, and other gases. However, due to the close positions of the i l characteristic peaks of hydrocarbon gases, there is a phenomenon of spectral peak overlap in the spectral analysis of a variety of alkane mixed gases. Therefore, the qualitative and quantitative analysis of each component gas in the mixed gas has great difficulties [3].
油气勘探开发在能源安全中占有重要地位,主要分为录井和试油两大类[1,2]。 录井技术是油气勘探开发的“眼睛”。 它的主要功能是收集井下信息,包括井下油气层的状态、地层、压力、钻进能力等信息。 本工作主要研究气测录井技术,通过分析录井气中烃类和非烃类气体的组成和含量,确定地层中油气的含量和特征。 其中,烃类气体主要包括甲烷、乙烷、丙烷、丁烷、戊烷; 非烃气体主要包括氧气、氮气、一氧化碳、二氧化碳、硫化氢等气体。 但由于烃类气体的红外光谱特征峰位置相近,在多种烷烃混合气体的光谱分析中存在谱峰重叠现象。 因此,对混合气体中各组分气体的定性和定量分析有很大的困难[3]。
At present, the commonly used quantitative analysis methods of gas infrared spectrum mainly include the partial least-squares discriminant analysis method and support vector machine and genetic algorithms combined with the radial basis function neural network quantitative analysis method.
目前常用的气体红外光谱定量分析方法主要有偏最小二乘判别分析法和支持向量机及遗传算法结合径向基函数神经网络定量分析法。
Partial least squares (PLS) is a chemometric method that combines multiple linear regression with principal component analysis methods. PLS overcomes the common spectral collinearity problem in multiple linear regression methods and also overcomes the problem of insufficient elimination of spectral noise in the principal component analysis method [4–7]. The support vector machine (SVM) is a machine learning algorithm based on statistical learning theory (SLT) [8,9], which focuses on the problem of statistical learning in small samples. It has been used in the infrared spectrum of traditional Chinese medicine identification, chemometrics, and other fields [10,11]. The radial basis function neural network (RBFNN) [12–15] is a three-layer feedforward artificial neural network based on the principle of local approximation [16]; it was first proposed by Moody and Darken. RBFNN has a simple structure and is easy to implement. Its characteristic is that the weight increases with the approach to the center of the function. According to this feature, RBFNN does not need to adjust all the weights during the training process. It only needs to adjust the central part’s weights.
偏最小二乘法(PLS)是一种多元线性回归与主成分分析相结合的化学计量方法。 PLS克服了多元线性回归方法中常见的谱共线性问题,也克服了主成分分析方法中谱噪声消除不足的问题[4-7]。 支持向量机(SVM)是一种基于统计学习理论(SLT)[8,9]的机器学习算法,主要研究小样本下的统计学习问题。 它已应用于中药红外光谱鉴别、化学计量学等领域[10,11]。 径向基函数神经网络(RBFNN)[12-15]是基于局部逼近原理的三层前馈人工神经网络[16]; 它最早是由穆迪和达肯提出的。 RBFNN结构简单,易于实现。 它的特点是权值随着函数中心的逼近而增大。 根据这一特点,RBFNN在训练过程中不需要调整所有权值。 它只需要调整中心部分的重量。
A convolutional neural network (CNN) can well reduce the complexity of the entire model, greatly reduce the number of weights, and, because it is inspired by the mammalian visual system, it simulates vision. The effect is more obvious, especially when using image data for input operations; further, the steps of feature extraction and data reconstruction can be effectively avoided. By comparing with PLS and GA-RBFNN methods, it can be concluded that the quantitative analysis model of logging gas infrared spectrum established by convolutional neural network has certain advantages in prediction accuracy and prediction time.
卷积神经网络(CNN)可以很好地降低整个模型的复杂度,大大减少权值的数目,并且由于它受哺乳动物视觉系统的启发,可以模拟视觉。 效果更加明显,尤其是在使用图像数据进行输入操作时; 进一步,可以有效地避免特征提取和数据重构的步骤。 通过与PLS和GA-RBFNN方法的比较,可以得出卷积神经网络建立的测井气体红外光谱定量分析模型在预测精度和预测时间上具有一定的优势。
方法
A. Introduction to Infrared Spectroscopy (红外光谱学导论)
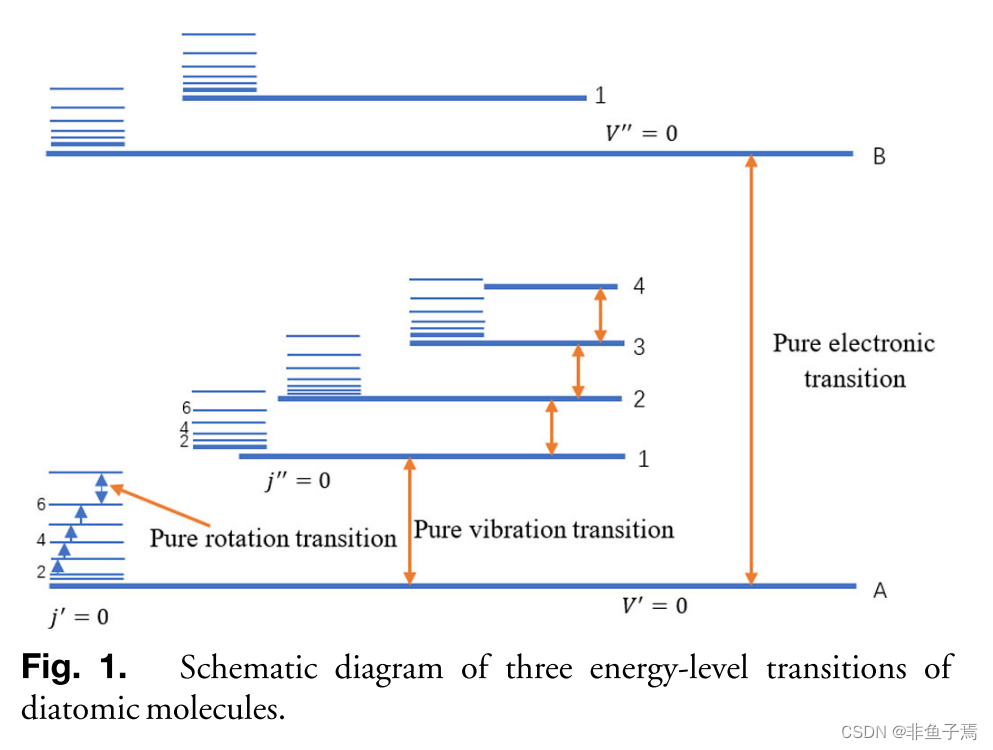
Infrared spectroscopy analysis technology collects and analyzes information such as the relative atomic vibration and molecular rotation of the measured substance. Different molecules absorb the corresponding infrared light, which will cause the vibration of the intermolecular chemical bond, and the state of the molecule will be changed by the energy level transition. The existence of molecular vibrational levels is a condition for infrared absorption, when the infrared radiation frequency is equal to the product of the difference between the vibration quantum number and the molecular vibration frequency; further, the molecule can absorb the infrared radiation and generate the corresponding infrared absorption spectrum. Taking diatoms as an example, the vibration energy levels ofmolecules are introduced. We consider the stretching motion between two atoms as a simple harmonic motion along the bond axis direction. The vibration levels ofdiatomic molecules are shown in Fig. 1.
红外光谱分析技术收集和分析被测物质的相对原子振动和分子旋转等信息。 不同的分子吸收相应的红外光,会引起分子间化学键的振动,分子的状态会因能级跃迁而改变。 当红外辐射频率等于振动量子数与分子振动频率之差的乘积时,分子振动能级的存在是红外吸收的条件; 此外,该分子能够吸收红外辐射并产生相应的红外吸收光谱。 以硅藻为例,介绍了分子的振动能级。 我们把两个原子之间的拉伸运动看作是沿键轴方向的简谐运动。 用图表示了双原子分子的振动能级 1.
Near-infrared spectrum technology has been widely applied in oil fields of the chemical industry at home and abroad and brought great economic benefits in the late 1980s. The Process Analysis Center inWashington, USA, had a lot of research work of oil quality analysis [17]; in addition, studies show that NIR analysis of octane number on the time and cost efficiency are significant and can be used for online control analysis. Shao Bo used infrared spectroscopy to detect the relevant properties of a finished gasoline tank, which could quickly and accurately determine the content of octane number and aromatic hydrocarbon in a single time within 5 min. Shi Yuehua used infrared spectroscopyand combined the principal component regression algorithm to quickly measure the octane content in gasoline [18]. With the rapid development of analytical technology, the application of near-infrared spectroscopy has also been expanded. Choquette studied the use of infrared spectroscopy to determine the content of oxides in gasoline [19]. In developed countries, most refineries use near-infrared spectroscopy online analysis technology in various chemical processes, which can greatly reduce costs and improve product quality.
近红外光谱技术在国内外化学工业油田得到了广泛的应用,并在20世纪80年代末产生了巨大的经济效益。 美国华盛顿过程分析中心进行了大量的油品质量分析研究工作[17]; 此外,研究表明,近红外光谱分析辛烷值在时间和成本效率上都有显着性,可以用于在线控制分析。 邵波利用红外光谱检测一个成品汽油罐的相关性质,可在5分钟内,单次快速准确测定辛烷值和芳烃含量。 石月华利用红外光谱法,结合主成分回归算法,快速测定汽油中的辛烷值[18]。 随着分析技术的飞速发展,近红外光谱的应用也得到了拓展。 Choquette研究了用荧光光谱法测定汽油中的羰基化合物含量[19]。 在发达国家,大部分炼油厂在各种化工过程中使用近红外光谱在线分析技术,可大幅降低成本,提高产品质量。
B. Introduction to Convolutional Neural Networks (卷积神经网络简介)
CNN is mainly inspired by the structure of a mammalian visual system. Based on this inspiration, Hubel and Wiesel proposed a visual structural model based on the visual cortex of cats in 1962. In 1980, a hierarchical organizational structure called neocognition, which could be applied to image processing, was first proposed by Fukushima. In 1988, CNN was used by Toshiteru Hommato identify spatio–temporal bipolar patterns [20]. Yann LeCun used CNN for tasks such as handwriting recognition and text recognition [21,22] and proposed the famous LeNet-5 network structure in 1989, which can complete the task of digital classification. The traditional convolutional neural network [23,24] is a single scale structure, which includes multiple layers of feature extraction stages and classifiers. The input data are subjected to layer-by-layer feature extraction and learning; in addition, features with the same scale receptive field as the input image are finally input into the classifier. As a special multilayer perceptron, CNN’s specialty is mainly reflected in the following three aspects: First, the lower neurons are only connected to some of the upper neurons, instead of connecting to all neurons in the upper layer; second, to share weights in the same layer of neurons in order to reduce the parameters required for training; finally, we use subsampling operations to make the network more robust and achieve the purpose of dimensionality reduction and prevent overfitting. Based on the above three points, the convolutional neural network can reduce the complexity of the entire model very well; it can also greatly reduce the number of weights, and, because it is inspired by the mammalian visual system, the effect is more obvious in simulating vision. It is a step that can effectively avoid feature extraction and data reconstruction when using image data for input operations.
CNN主要受哺乳动物视觉系统结构的启发。 基于这一灵感,Hubel和Wiesel于1962年提出了一种基于猫视皮层的视觉结构模型。 1980年,一种可应用于图像处理的被称为认知机(NeoCognition)的分层组织结构首次由福岛提出。 1988年,Toshiteru Hommato使用CNN识别时空双极模式[20]。 Yann LeCun将CNN用于手写识别和文本识别[21,22],并于1989年提出了著名的Lenet-5网络结构,可以完成数字分类任务。 传统的卷积神经网络[23,24]是单尺度结构,包含多层特征提取阶段和分类器。 对输入数据进行逐层特征提取和学习; 此外,与输入图像具有相同尺度感受野的特征最终被输入到分类器中。 作为一种特殊的多层感知器,CNN的特长主要体现在以下三个方面:第一,下层神经元只连接到上层神经元中的一部分,而不是连接到上层所有神经元; 第二,在同一层神经元中共享权值,以减少训练所需的参数; 最后,我们使用子采样操作使网络更加鲁棒,达到降维和防止过拟合的目的。 基于以上三点,卷积神经网络可以很好地降低整个模型的复杂度; 它还可以大大减少权重的数量,而且,由于它受到哺乳动物视觉系统的启发,在模拟视觉方面效果更加明显。 它是利用图像数据进行输入操作时可以有效避免特征提取和数据重构的步骤。
The convolutional neural network model of the infrared spectral classification of logging gas designed in this work uses the LeNet-5 network architecture, and an improvement is made on this basis. The network model used mainly includes an input layer, convolutional layer, pooling layer, fully connected layer, and output layer. The input layer is the acquired gas infrared spectrum data; the output layer is the gas type and concentration information included in the input data. The network model in this work consists of three convolutional layers, two pooling layers, and one fully connected layer. The size of the convolution kernel of the convolution layer is 7 × 7, and the size of the convolution kernel of the pooling layer is 2 × 2. This work uses TensorFlow to build a convolutional neural network structure. The first, third, and fifth layers are convolution layers, the second and fourth layers are pooling layers, the sixth and seventh layers are fully connected layers, and the last layer is the output layer.
本文设计的测井气体红外光谱分类卷积神经网络模型采用Lenet-5网络结构,并在此基础上进行了改进。 所使用的网络模型主要包括输入层、卷积层、池化层、全连接层和输出层。 输入层为获取的气体红外光谱数据; 输出层是输入数据中包含的气体类型和浓度信息。 本文的网络模型由三个卷积层、两个池层和一个全连通层组成。 卷积层的卷积核大小为7×7,池化层的卷积核大小为2×2。 本工作使用TensorFlow构建卷积神经网络结构。 第一、三、五层为卷积层,第二、四层为池层,第六、七层为全连接层,最后一层为输出层。
Parameters in the neural network are important parts of the classification or regression problem, while in TensorFlow, variables are the parameters used to save and update the neural network. Variables also need to be assigned an initial value, and random numbers are often used to initialize variables in TensorFlow. In this work, the truncated_normal random number generator was used to assign random numbers to the initial value, and the random number generator was used to generate normally distributed random numbers.However, if the random value deviated from the mean value by more than two standard deviations, the random operation would be repeated.
神经网络中的参数是分类或回归问题的重要组成部分,而在TensorFlow中,变量是用来保存和更新神经网络的参数。 变量也需要赋一个初始值,在TensorFlow中经常使用随机数来初始化变量。 本文利用 truncated_normal 随机数生成器对初始值进行随机数赋值,并利用随机数生成器生成正态分布随机数,但如果随机数与均值的偏差超过两个标准差,则会重复随机操作。
实验
A. Preparation of Experimental Gas (实验气体制备)
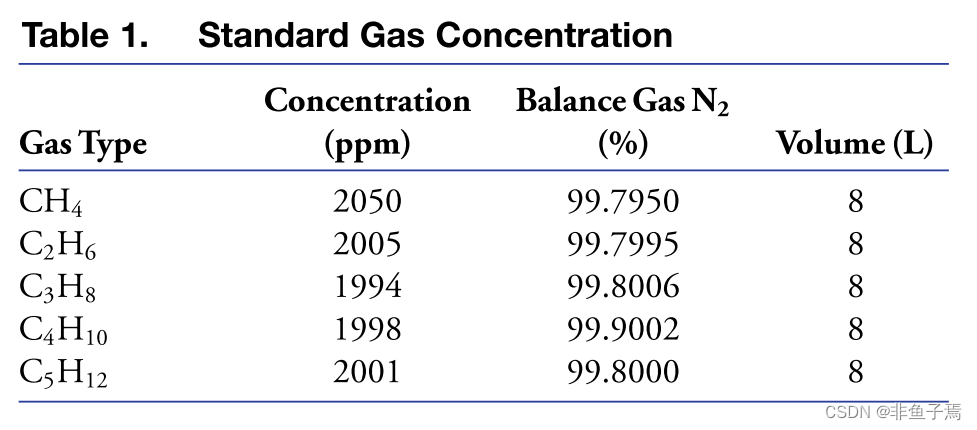
The mud logging gas sample used in this work is composed of the logging gas actually collected at the logging site and the gas sample configured by the laboratory-simulated logging site environment. All the gases configured in the laboratory use Dalian Date Gas Co. Ltd. The concentrations of the provided alkane gas and nitrogen are shown in Table 1. Each standard gas is stored in the original steel cylinder and stored in a ventilated and dark environment. Each gas is stored separately and equipped with corresponding protective measures to ensure the safety ofthe experiment.
本工作所用的录井气样由现场实际采集的录井气和实验室模拟的现场环境配置的气样组成。 实验室配置的所有气体均使用大连达特气体有限公司,所提供的烷烃、气体和氮气浓度如表1所示。 每种标准气体都储存在原来的钢瓶内,并储存在通风黑暗的环境中。 每种气体单独存放,并配备相应的防护措施,确保实验安全。
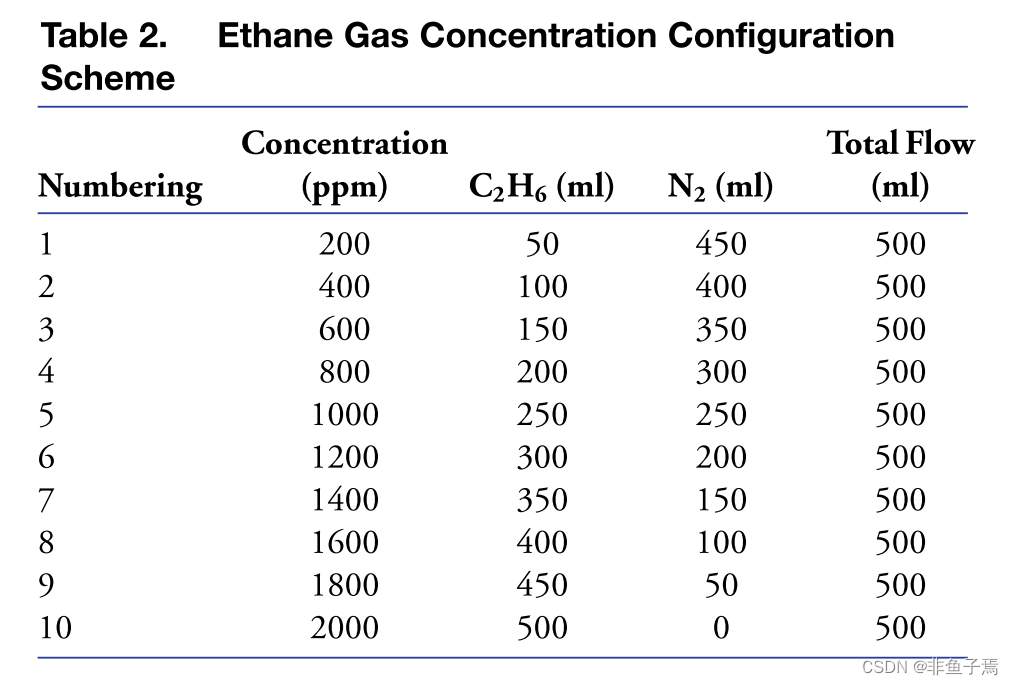
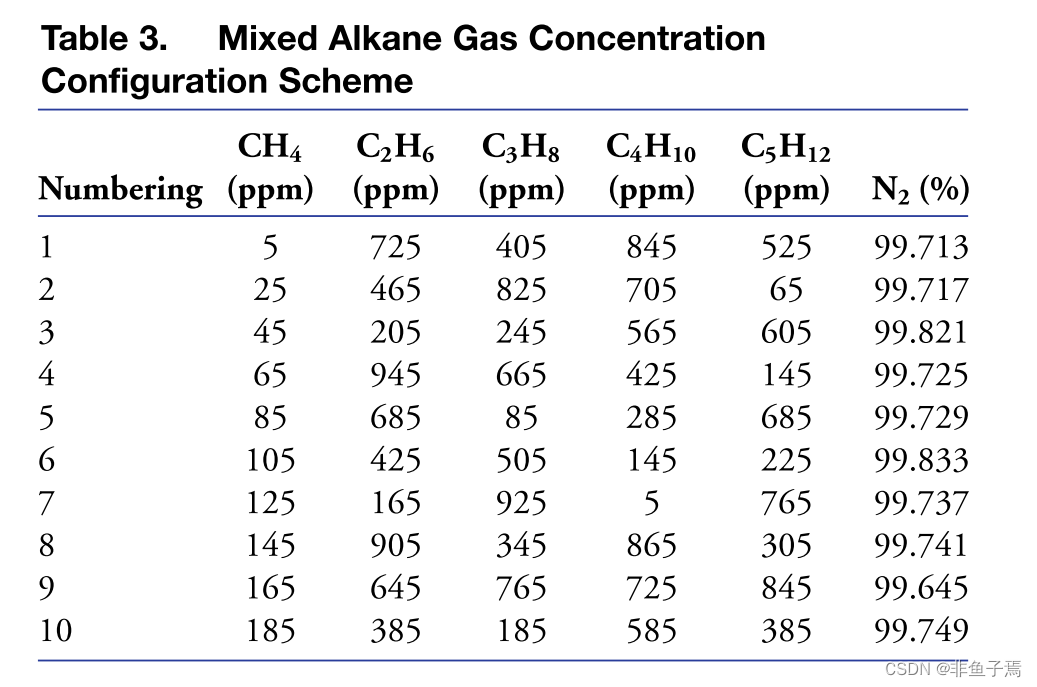
In this work, a total of 75 different gas samples with different concentrations are configured. Each group of gas samples is collected five times. The gas data obtained for each sample are the average value of five measurements, which further reduces the experimental error. Among the 75 sample gases, there are 50 elemental gases, and the remaining 25 are mixed-gas samples. In the single substance gas, eight groups of samples are randomly selected from the 10 sets of data of each gas as the training set data, and the remaining two groups are used as the test set data. The 25 mixed gases also use each mixed gas to randomly select eight groups as the training set as the division method of the prediction set. The single-component gas concentration design uses the concentration gradient method. The ethane concentration gradient design scheme is shown in Table 2. The remaining four elemental alkane designs refer to the ethane ratio method, and some mixed gas design schemes are shown inTable 3.
本工作共配置了75种不同浓度的气体样品。 每组气体样品采集五次。 每个样品得到的气体数据为五次测量的平均值,进一步减小了实验误差。 75种样品气体中,元素气体50种,其余25种为混合气体样品。 在单物质气体中,从每种气体的10组数据中随机抽取8组样本作为训练集数据,其余两组作为测试集数据。 25种混合气体也用每种混合气体随机选取8组作为训练集,作为预测集的划分方法。 单组分气体浓度设计采用浓度梯度法。 乙烷浓度梯度设计方案如表2所示。 其余四种元素烷烃设计参照乙烷比法,部分混合气体设计方案见表3。
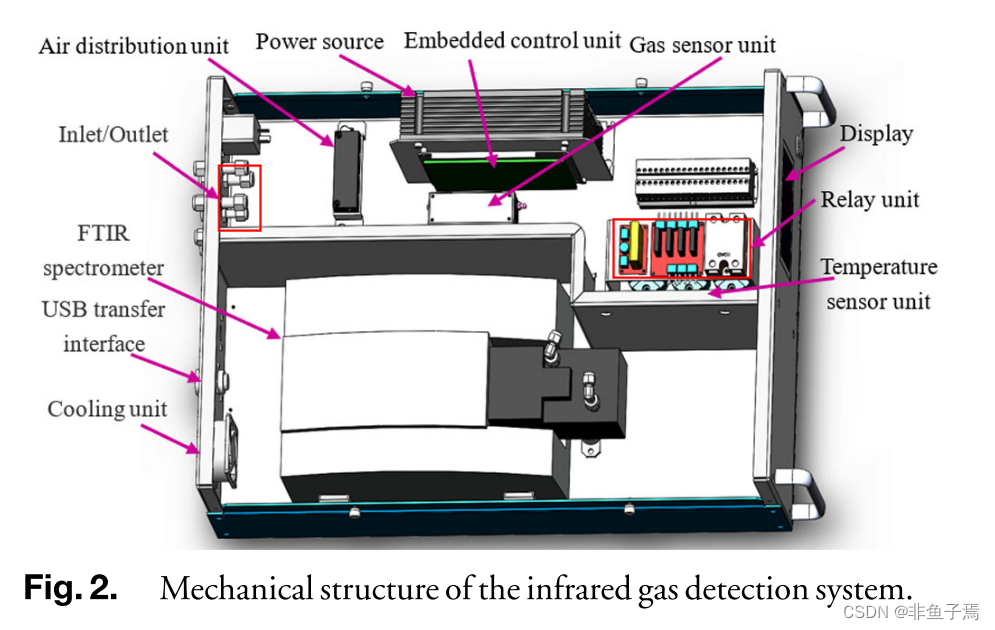
In this work, the Fourier transform infrared spectroscopy (FTIR) logging gas detection system of our design and a multichannel gas mixing device are used to conduct the configuration of experimental sample gas and the collection of infrared spectrum data. The FTIR logging gas detection system mainly includes the following parts: gas pretreatment unit, temperature sensor unit, gas path allocation unit, gas filter unit, hydrogen, oxygen, hydrogen sulfide sensor unit, computer communication unit, gas pool, infrared spectrum detection unit, the embedded control units, relay unit, and the cooling unit; further, the FTIR detection system structure design, 3D model in the design of the system unit, can be generated under the condition of the optimal processing figure for actual production and processing machine. Figure 2 shows the 3D mechanical structure diagram ofthe system.
本文利用所设计的傅里叶变换红外光谱(FTIR)测井气体检测系统和多通道气体混合装置进行实验样品气体的组态和红外光谱数据的采集。 FTIR测井气体检测系统主要包括以下几个部分:气体预处理单元、温度传感器单元、气路分配单元、气体过滤单元、氢、氧、硫化氢传感器单元、计算机通信单元、气藏、红外光谱检测单元、嵌入式控制单元、继电器单元、冷却单元; 进一步,对FTIR检测系统进行结构设计,在设计系统单元时,可以生成在实际生产加工机器条件下的最优加工图形。 图2显示了系统的三维机械结构图。
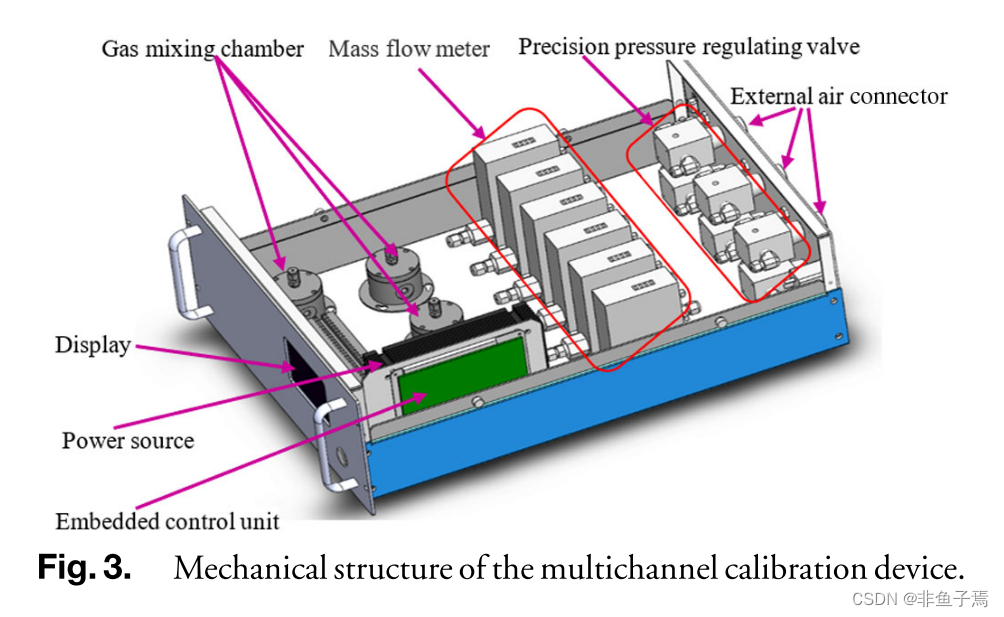
The mechanical structure of the multichannel gas mixing device designed in this work is shown in Fig. 3. The main structure of the device includes a gas mixing chamber, a pressure regulating valve, and a mass flow meter. Mixing of six different gases can be achieved at the same time. In order to ensure the accuracy of the configured experimental samples, an Agilent 6820 meteorological chromatograph was used to verify the accuracy. The experimental results show that the maximum relative error of the sample gas concentration obtained by the configuration is 4.72%, and the average relative error is 2.4%. This shows that the multichannel ventilation device designed in this work has high accuracy and can be used to prepare experimental gases.
本文所设计的多通道气体混合装置的机械结构在图中给出 3. 该装置的主要结构包括气体混合室、压力调节阀和质量流量计。 可以同时实现六种不同气体的混合。 为了保证配置实验样品的准确性,使用安捷伦6820气象色谱仪进行了准确性验证。 实验结果表明,用该构型得到的样品气体浓度的最大相对误差为4.72%,平均相对误差为2.4%。 这表明本工作设计的多通道通风装置具有较高的精度,可用于制备实验气体。
Before carrying out spectrum acquisition, we first introduce nitrogen into the gas pool and flush the gas pool to avoid residual gas from affecting the spectrum collection experiment. When performing a spectrum collection, we use nitrogen as the experimental equilibrium gas and after the end of an experiment.Nitrogen is flushed to the gas cell for 1 min to completely remove the previous experimental gas.During the experiment, it is necessary to keep the operating temperature ofthe spectrometer stable at 46℃ and the internal pressure of the spectrometer at 0.1 Kpa to avoid large fluctuations in the internal pressure of the spectrometer. The data of each group were collected five times; then, the average value was obtained as the result of this group of experiments.
在进行光谱采集前,我们首先在气藏中引入氮气,并对气藏进行冲洗,避免残留气体影响光谱采集实验。 在进行光谱采集时,我们以氮气作为实验平衡气体,在实验结束后,将氮气冲入气室1min,以完全清除先前的实验气体。在实验过程中,必须保持光谱仪的工作温度稳定在46℃,光谱仪的内压稳定在0.1kPa,以避免光谱仪内压的大幅波动。 每组数据收集5次; 然后,得到平均值作为这组实验的结果。
B. Spectrum Acquisition and Preprocessing (频谱采集和预处理)
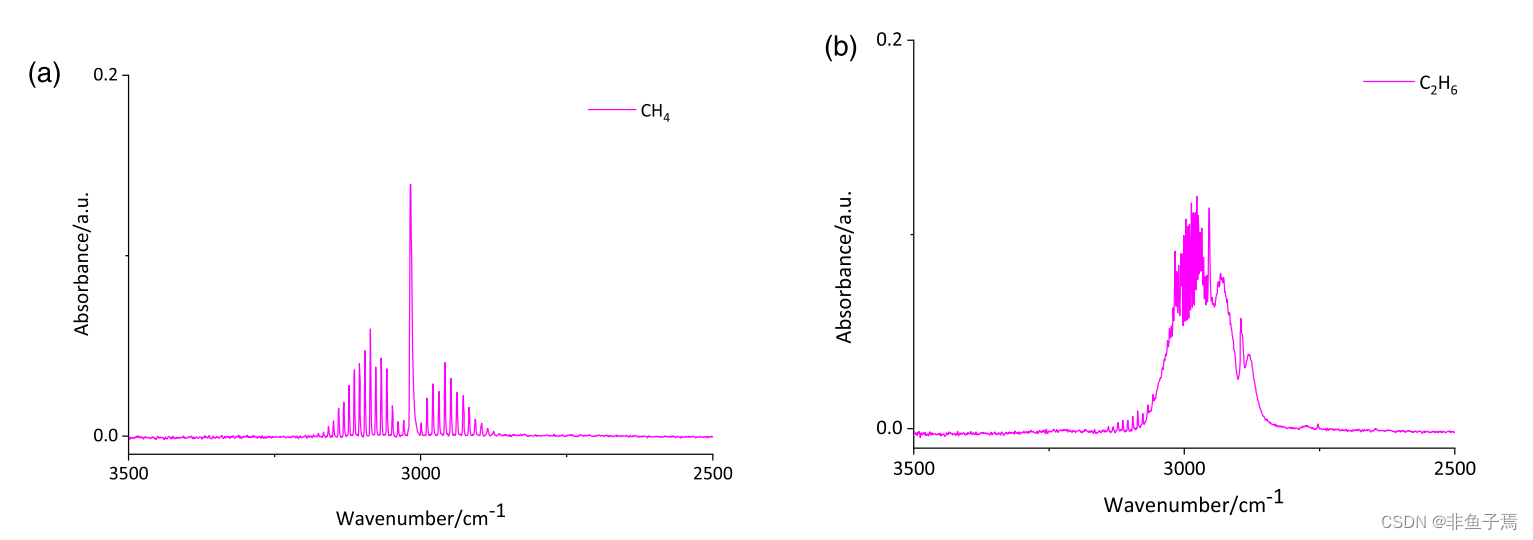
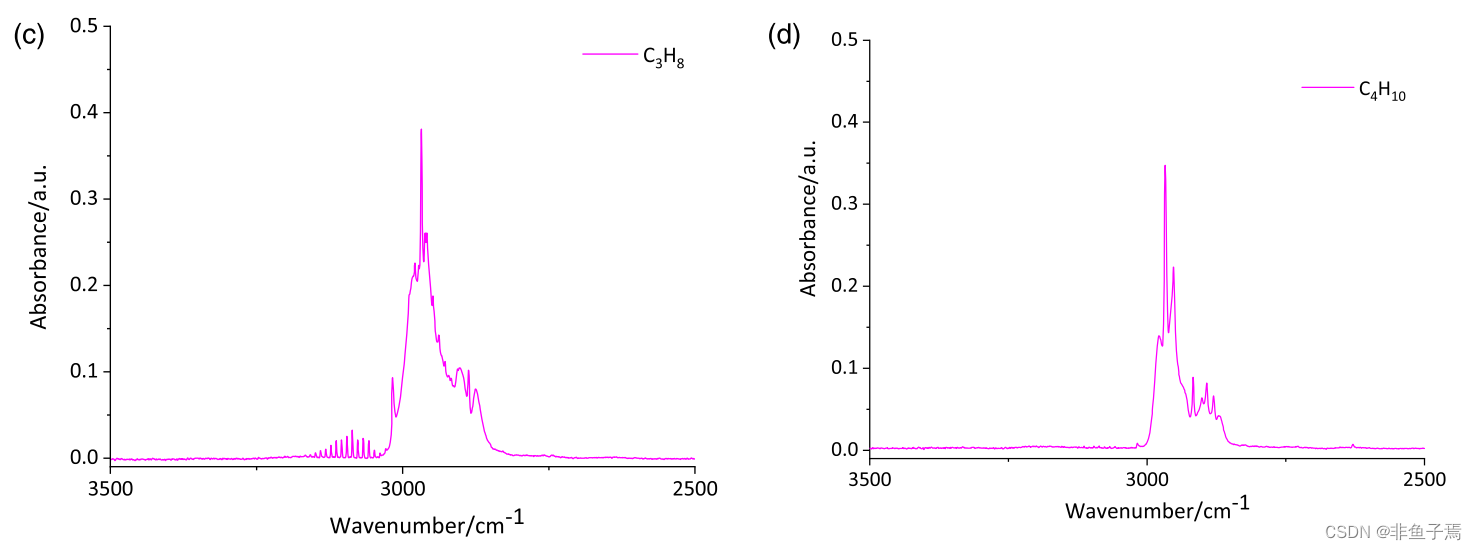
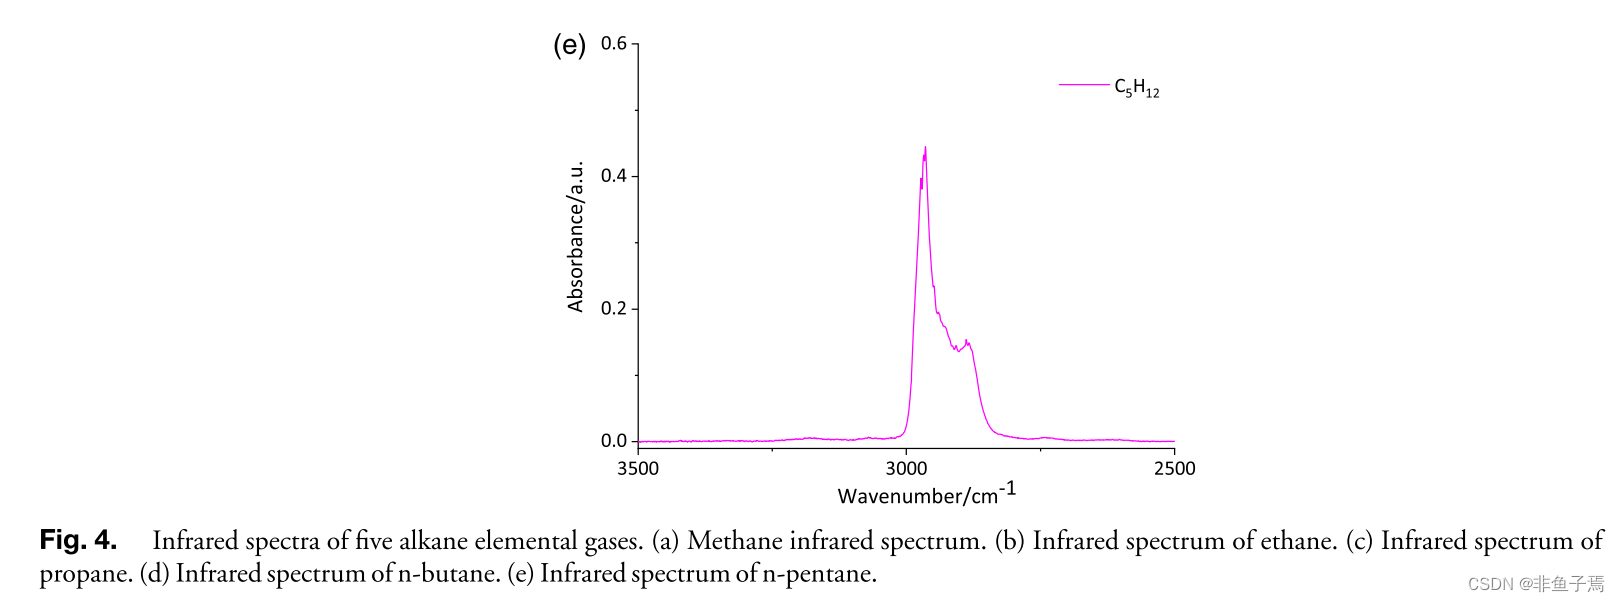
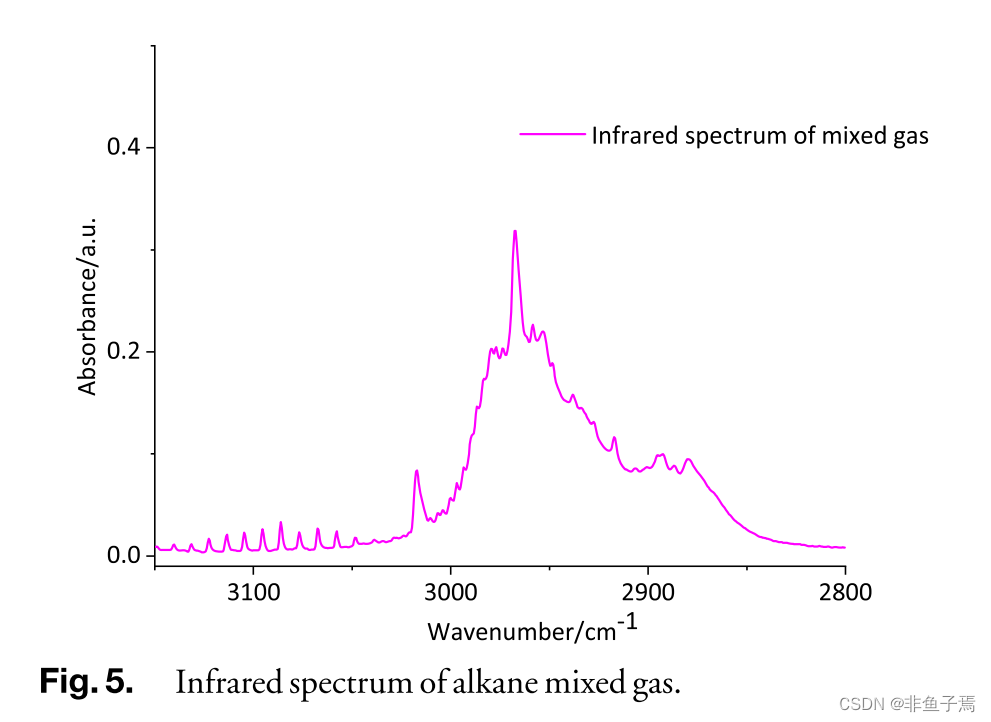
The infrared spectrometer used in this work is a Fourier infrared spectrometer produced by the Bruker Corp. The parameters are working voltage: 24 V; spectral resolution: 1  ; wavenumber range: 4000 − 400 ; gas cell temperature: 46℃; total sample gas flow: 500 ml/min; gas cell inlet pressure: 0.1 Kpa; further, each set of data is collected five times, and the average value of five times is taken as the sample spectrum. The infrared spectrum of the collected elemental gas (taking the 3500 − 2500 band as an example) is shown in Fig. 4, and the infrared spectrumofthe mixed gas is shown in Fig. 5.
本工作所用的红外光谱仪是Bruker公司生产的傅立叶红外光谱仪,参数为:工作电压:24 V; 光谱分辨率:1 ; 波数范围:4000-400 ; 气室温度:46°C; 总样气流量:500mL/min; 气室入口压力:0.1kPa; 此外,每组数据采集五次,取平均值作为样本谱。 所收集元素气体的红外光谱(以3500-2500 波段为例)显示在图 4、在图中显示了混合气体的红外光谱 5.
Modeling and analyzing the infrared s large amoupectrum require ant of sample data; in order to obtain a highly accurate model, the selection of the training set is an important link. The accuracy of the mud logging gas infrared spectrum training model is not getting higher and higher as the number of samples increases. On the contrary, the accuracy of the trained model may decrease due to the increase in the number of training samples. This is because, with the increase of training samples, the number of interference factors introduced into the model will also increase, and the existence of these interference factors may mask the useful information in the infrared spectrum, leading to the degradation ofmodel performance. At the same time, the existence of a large number of similar and redundant sample data will inevitably lead to a large increase in the amount ofmodeling operations, which in turn will lead to an increase in modeling time and required storage space. There are three common methods for sample selection: sample selection methods based on statistical sampling, sample selection methods based on nearest neighbors, and sample selection methods based on density.
红外光谱的建模和分析需要大量的样本数据; 为了获得高精度的模型,训练集的选取是一个重要的环节。 录井气体红外光谱训练模型的精度并不是随着样本数的增加而越来越高。 相反,训练模型的精度可能会因为训练样本数的增加而降低。 这是因为,随着训练样本的增加,引入到模型中的干扰因素也会增加,这些干扰因素的存在可能会掩盖红外光谱中的有用信息,导致模型性能的下降。 同时,大量相似和冗余样本数据的存在,必然导致建模运算量的大幅增加,进而导致建模时间和所需存储空间的增加。 常用的样本选择方法有三种:基于统计抽样的样本选择方法、基于最近邻的样本选择方法和基于密度的样本选择方法。
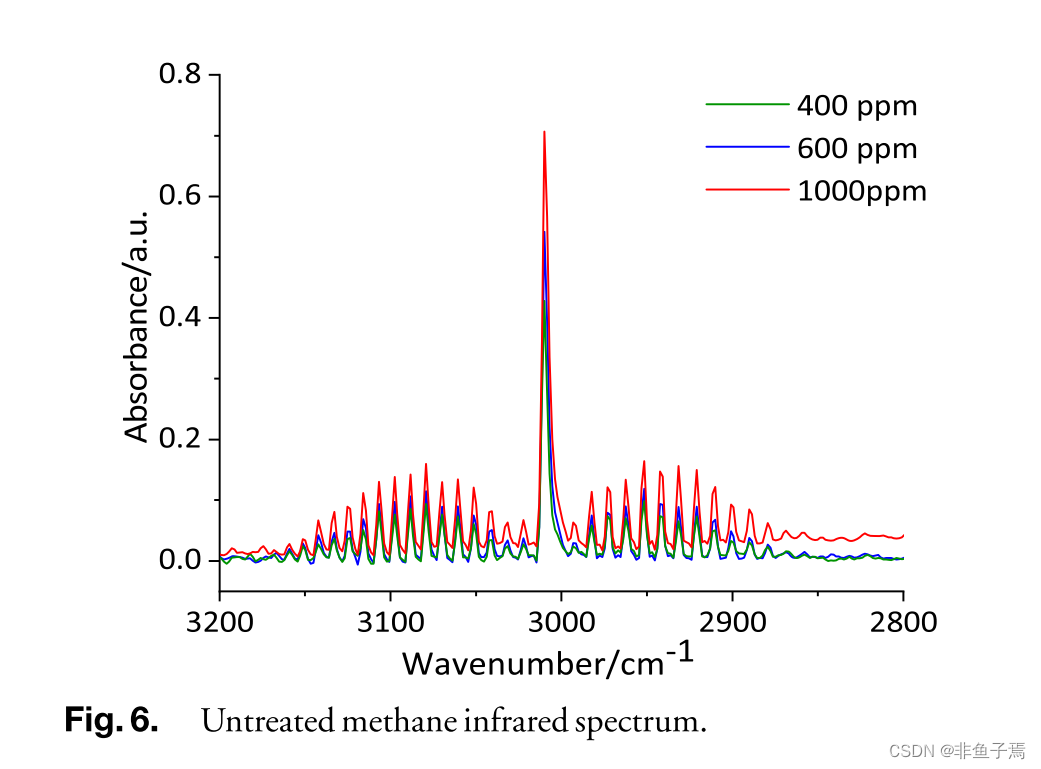
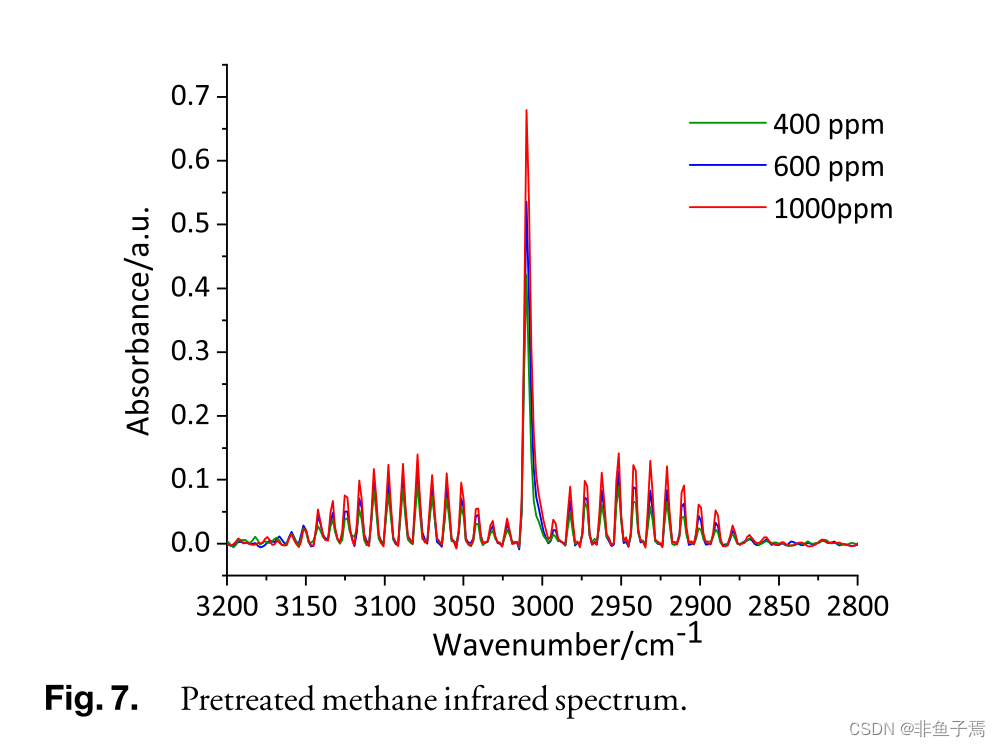
Before establishing a quantitative analysis model of the logging gas infrared spectrum, we first pre-process the collected logging gas infrared spectrum, as shown in Fig. 6. The three sets of data are methane samples with concentrations of 400, 600, and 1000 ppm, respectively. In the spectrum, the characteristic spectral peaks in the 3200 − 2800 band were selected as a display example. It can be clearly seen from the figure that the collected data not only have a large amount of glitch noise but also a baseline drift phenomenon. This work uses the SG-arPLS method [25] to preprocess the spectrum. The preprocessed infrared spectrum is shown in Fig. 7. After preprocessing, the sample noise in the infrared spectrum is reduced, the baseline drift of the infrared spectrum is effectively removed, and the convolutional neural network is used for modeling, all of which have a certain positive significance. The preprocessed spectral data are exported. The size of the spectral information vector ofeach sample is 2215 × 1, and the data export format is csv.
在建立测井气体红外光谱定量分析模型之前,我们首先对采集到的测井气体红外光谱进行预处理,如图6所示。这三组数据分别是浓度为400ppm、600 ppm和1000ppm的甲烷样品。在光谱中,选取3200 ~ 2800 波段的特征谱峰作为显示示例。从图中可以清楚地看到,采集的数据不仅存在大量的毛刺噪声,而且存在基线漂移现象。本工作采用SG-arPLS方法[25]对光谱进行预处理。预处理后的红外光谱如图7所示。经过预处理,降低了红外光谱中的样本噪声,有效去除了红外光谱的基线漂移,并采用卷积神经网络进行建模,具有一定的积极意义。将预处理后的光谱数据导出。每个样本的光谱信息向量大小为2215 × 1,数据导出格式为csv。
Before training the model of the convolutional neural network, it is necessary to preprocess the data set and then divide the preprocessed data set. The workflow is as follows:
1. Use pandas to load the preprocessed data set from the csv file and store it as data corresponding to label.
2. Divide the data set based on the principle of crossvalidation; also divide the data set into a training set and a test set according to the ratio of4:1.
在训练卷积神经网络模型之前,需要对数据集进行预处理,然后对预处理后的数据集进行划分。工作流程如下:
1. 使用熊猫从csv文件中加载预处理后的数据集,并将其存储为标签对应的数据。
2. 基于交叉验证原则对数据集进行划分;按照4:1的比例将数据集划分为训练集和测试集。
In this work, the purpose of modeling training using convolutional neural networks is to estimate network parameters by solving the problem of minimizing the loss function. The training process is consistent with traditional convolutional neural networks and is divided into forward propagation and back propagation in two parts; in addition, the weights in all filters are trained using backpropagation.
在本工作中,使用卷积神经网络建模训练的目的是通过求解最小损耗函数来估计网络参数。训练过程与传统卷积神经网络一致,分为正向传播和反向传播两部分;此外,所有过滤器中的权值都使用反向传播进行训练。
C. Experiments with Elemental Gases and Mixed Gases (基本气体和混合气体的实验)
The characteristic peaks of the alkane elemental gas are different. The design scheme of the alkane elemental gas experiment is shown in the third part, with an initial difference of 200 ppm as the initial concentration, 2000 ppm as the end concentration, and 200 ppm as the concentration gradient. Ten sets of data were sampled for each gas using a mud logging gas infrared spectrumanalysis system.
烷烃单质气的特征峰不同。第三部分给出了烷烃单质气实验的设计方案,初始差值为200ppm,末浓度为2000ppm,浓度梯度为200ppm。使用泥浆测井气体红外光谱分析系统对每种气体采集了10组数据。
Taking the ethane (C2H6) elemental gas as an example, the standard gas shown in Table 1 was used to configure the experimental sample gas with different concentrations of the ethane elemental gas at the flow ratio in Table 2. The parameters used for the infrared spectrometer: working voltage: 24 V; spectral resolution: 1 ; wavenumber range: 4000 − 400 ; gas cell temperature: 46℃; total sample gas flow: 500 ml/min; gas cell inlet pressure: 0.1 Kpa.
以乙烷(C2H6)元素气为例,采用表1所示的标准气配制表2流量比下不同浓度的乙烷元素气实验样气。红外光谱仪使用的参数:工作电压:24v;光谱分辨率:1 ;波数范围:4000−400 ;气体电池温度:46℃;总进样气量:500ml /min;气室入口压力:0.1 Kpa。
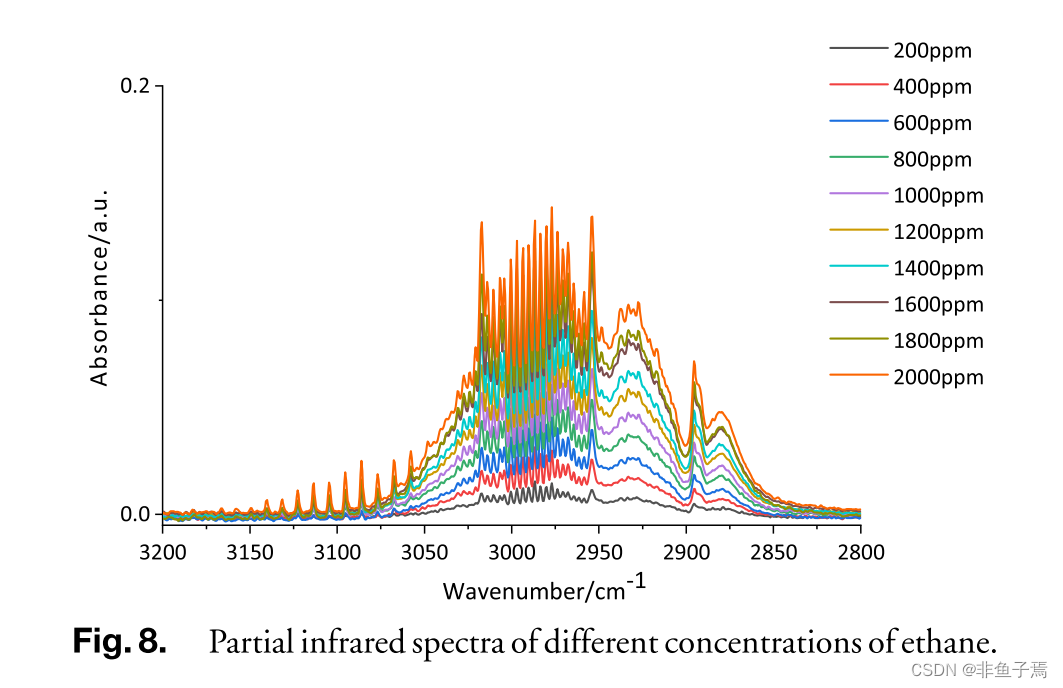
After the temperature of the infrared spectrometer, the flow rate of the gas path and the internal pressure of the gas pool are stabilized, and an alkane gas spectrum acquisition experiment is performed. The measured spectral data are shown in Fig. 8. Selecting the characteristic peaks in the 3200 − 2800 spectral band, it can be seen from the figure that, as the gas concentration increases, the light intensity also increases.
红外光谱仪温度稳定后,气路流量和气藏内部压力稳定,进行烷烃气光谱采集实验。实测光谱数据如图8所示。选取3200 ~ 2800 波段的特征峰,从图中可以看出,随着气体浓度的增加,光强也随之增加。
After the temperature of the infrared spectrometer, the flow rate ofthe gas path and the internal pressure ofthe gas pool are stabilized, and an alkane gas spectrum acquisition experiment is performed. The measured spectral data are shown in Fig. 8. Selecting the characteristic peaks in the 3200 − 2800 spectral band, it can be seen from the figure that, as the gas concentration increases, the light intensity also increases. The infrared spectrum acquisition steps for the remaining four alkane elemental gases are similar to those for ethane. Each elementary gas is divided into 10 groups of different concentrations, and 10 concentration spectra are collected for each concentration. A total of 500 sets of experimental spectral data are used. All experimental data of elemental gases and mixed gases are classified using the KS division algorithm. Eight experimental samples were randomly selected from the group of 10 data as the training set data, and two experimental samples were used as the prediction set data.
红外光谱仪温度稳定后,气路流量和气藏内部压力稳定,进行烷烃气光谱采集实验。实测光谱数据如图8所示。选取3200 ~ 2800 波段的特征峰,从图中可以看出,随着气体浓度的增加,光强也随之增加。其余四种烷烃元素气体的红外光谱采集步骤与乙烷相似。每个元素气体被分成10组不同浓度的气体,每个浓度采集10个浓度谱。共使用了500组实验光谱数据。采用KS分割算法对单质气体和混合气体的实验数据进行分类。从10个数据中随机抽取8个实验样本作为训练集数据,2个实验样本作为预测集数据。
It is necessary to adjust the experimental parameters before the simple gas experiment to achieve the optimal experimental effect. Finally, the relevant parameters of the model are as follows: the size of the convolution kernel is 5 × 1, and the depth is 32. The step size in carrying out the convolution operation is 1. The basic learning rate was(is) 0.001. Batch size (number of samples for each training) is 8. The number of iterations is 1000, and the regularization coefficient (the coefficient of regularization term in the loss function that describes the complexity of the model) is 0.0001. The attenuation rate of learning rate was 0.958. The average sliding decay rate is 0.99.
在进行简单的气体实验前,有必要对实验参数进行调整,以达到最佳的实验效果。最后,模型的相关参数为:卷积核的大小为5 × 1,深度为32。卷积运算的步长为1。基本学习率为0.001。批量(每次训练的样本数量)为8。迭代次数为1000次,正则化系数(描述模型复杂性的损失函数中的正则项系数)为0.0001。学习速率衰减率为0.958。平均滑动衰减率为0.99。
Similarly, the relevant parameters of the model finally determined by the experiment on mixed gas are: the size of the convolution kernel is 5 × 1, and the depth is 32. The step size in carrying out the convolution operation is 1. The basic learning rate was 0.001. Batch size (number of samples for each training) is 6. The number of iterations is 1750, and the regularization coefficient (the coefficient of regularization term in the loss function that describes the complexity of the model) is 0.0001. The attenuation rate of learning rate is 0.96. The average sliding decay rate is 0.99.
同样,混合气体实验最终确定的模型相关参数为:卷积核大小为5 × 1,深度为32。卷积运算的步长为1。基本学习率为0.001。批量(每次培训的样本数量)为6。迭代次数为1750次,正则系数(描述模型复杂性的损失函数中的正则项系数)为0.0001。学习速率的衰减率为0.96。平均滑动衰减率为0.99。
In order to find the optimal parameter combination, this thesis uses a random grid search cross-validation framework (RSG-CV) to screen different parameter combinations during the training process and performs parameter optimization operations before elemental and mixed gas training. To obtain the combination of parameters with the highest training accuracy, we use the alkane elemental gas training set and the alkane mixed gas training set to modify the model, respectively, and apply it to the corresponding test set data to obtain the final prediction accuracy.
为了找到最优的参数组合,本文采用随机网格搜索交叉验证框架(RSG-CV)在训练过程中筛选不同的参数组合,并在元素训练和混合气体训练前进行参数优化操作。为了获得训练精度最高的参数组合,我们分别使用烷烃元素气训练集和烷烃混合气训练集对模型进行修改,并将其应用到相应的测试集数据中,获得最终的预测精度。
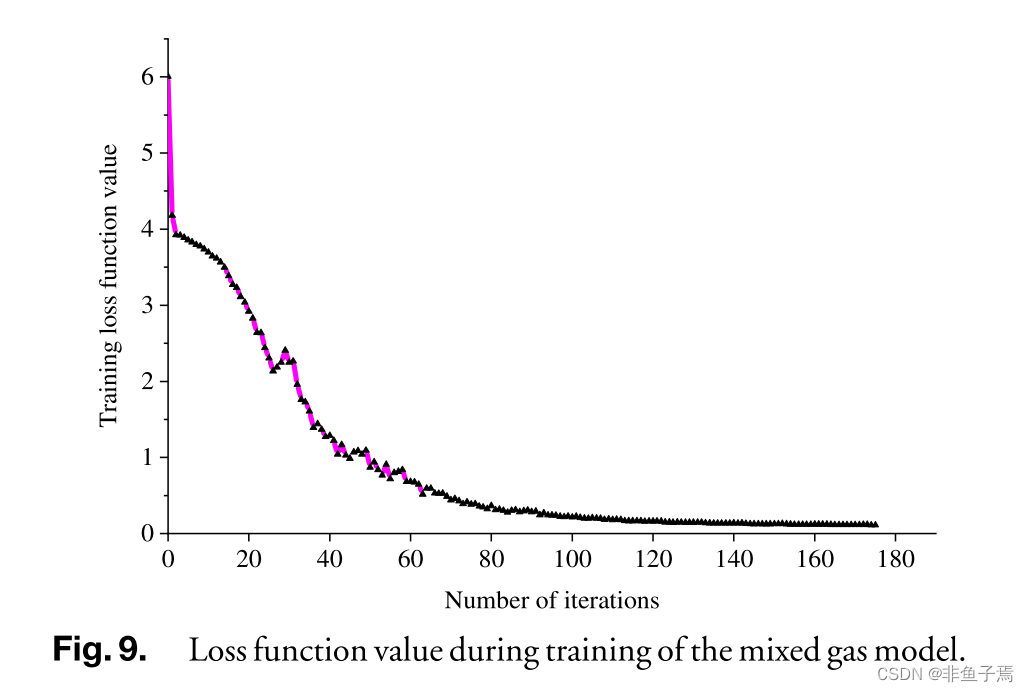
The change of the training loss function value of the mixed gas experimental model during network training is shown in Fig. 9. In order to avoid overfitting, the problem is mainly solved from two aspects. In the first aspect, by supplementing the training data set, the training data set is expanded to avoid the occurrence of overfitting; in the second aspect, by adjusting the model structure, the design of the convolutional layer and the pooling layer during the experiment adjust and prevent overfitting by adding a dropout layer. It can be seen from the figure that the training loss function value curve of the convolutional neural network shows a smooth macroscopic downward trend; further, the trend of convergence gradually with the continuous increase of the number of training iterations shows that the convolutional neural network learning state is good; thus, there is no overfitting phenomenon.
混合气体实验模型在网络训练过程中的训练损失函数值变化如图9所示。为了避免过拟合,主要从两个方面来解决问题。在第一个方面,通过补充训练数据集,对训练数据集进行扩展,避免了过拟合的发生;第二,通过调整模型结构,实验中卷积层和池化层的设计通过增加丢失层来调整和防止过拟合。从图中可以看出,卷积神经网络的训练损失函数值曲线呈现平稳的宏观下降趋势;进一步,随着训练迭代次数的不断增加,卷积神经网络逐渐收敛的趋势表明卷积神经网络的学习状态良好;因此,不存在过拟合现象。
结论
For the purpose of further evaluating the performance of the method used in this thesis, we compared the convolutional neural network with the radial basis neural network and the PLS-DA method commonly used in mathematical analysis of chemometrics. These two methods are selected for comparison. The reason for this is that the interpretable models provided by the two have acceptable prediction accuracy. This thesis also considers the logic regression method (LR). The LR method can be approximately regarded as the last layer of a convolutional neural network; it is also understood as a simple neural network without a hidden layer, and the input data directly reaches the output layer through an excitation function. The comparison between convolutional neural network and partial least-squares discriminant analysis method (PLS-DA) and radial basis neural network can explain the advantages of deep learning in the infrared spectrum detection of logging gas; further, with the convolutional neural network and logistic regression in comparison, the importance of convolutional layers can be studied directly. In each method, cross-validation is used to achieve the highest accuracy of the model. The convolutional neural network modeling and analysis are performed separately for elemental gas and mixed gas in the logging gas.
为了进一步评价本文方法的性能,我们将卷积神经网络与径向基神经网络以及化学计量学数学分析中常用的PLS-DA方法进行了比较。选择这两种方法进行比较。这是因为两者提供的可解释模型具有可接受的预测精度。本文还考虑了逻辑回归方法(LR)。该方法可以近似地看作是卷积神经网络的最后一层;也可以理解为一个简单的神经网络,没有隐含层,输入数据通过一个激励函数直接到达输出层。通过卷积神经网络与偏最小二乘判别分析方法(PLS-DA)和径向基神经网络的比较,可以说明深度学习在测井气红外光谱检测中的优势;进一步,通过对卷积神经网络和逻辑回归的比较,可以直接研究卷积层的重要性。在每种方法中,交叉验证被用来实现模型的最高准确性。对测井气中的元素气和混合气分别进行了卷积神经网络建模和分析。
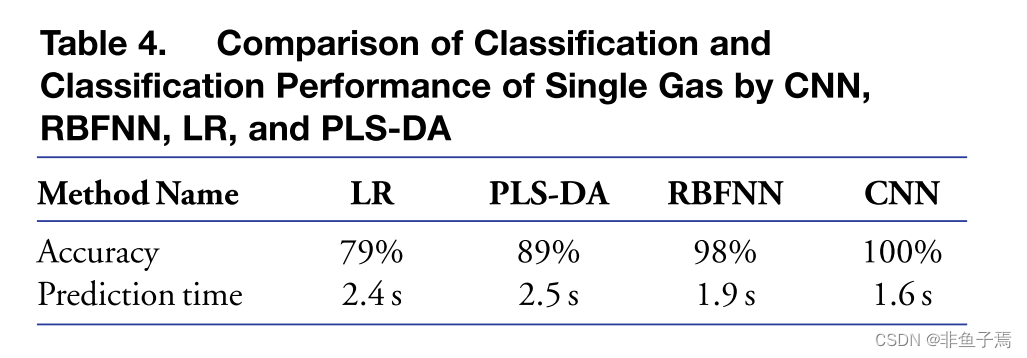
The 500 simple substance gas effective samples and 250 multicomponent mixed gas samples that are simulated in the field environment using a multichannel gas mixing device in a laboratory environment are divided into a training set and a prediction set, and the principles of the training set and the prediction set are obtained samples, which have similar statistical characteristics. The number of training set samples used to build the elemental gas prediction model is 400, and the number of test set samples is 100, which are used to test the performance of the prediction model obtained by training. The number of samples in the training set of the mixed gas is 200, the number of samples in the test set is 50, the ratio of the number of samples in the training set to the total number of samples is 0.8, the cross-validated data are included in the training set, and all experiments are repeated five times as well as the test process; further, the average of the results obtained five times after the test is done is the final result of the experiment. Table 4 shows the comparison of the classification performance of four kinds of modeling models for elemental gas classification. Table 5 shows the comparison of the determination performance of multicomponent mixed gas modeling.
利用多通道气体混合装置在实验室环境中模拟野外环境中的500个单质气体有效样本和250个多组分混合气体样本,将其分为训练集和预测集,得到训练集和预测集原理样本,两者具有相似的统计特征。建立元素气体预测模型所使用的训练集样本数为400个,测试集样本数为100个,用于测试训练得到的预测模型的性能。混合气体训练集中样本数为200,测试集中样本数为50,训练集中样本数与总样本数之比为0.8,训练集中包含交叉验证的数据,所有实验重复5次,并进行测试过程;此外,测试完成后得到的5次结果的平均值就是实验的最终结果。表4为四种元素气分类建模模型的分类性能比较。多组分混合气体模型测定性能比较如表5所示。
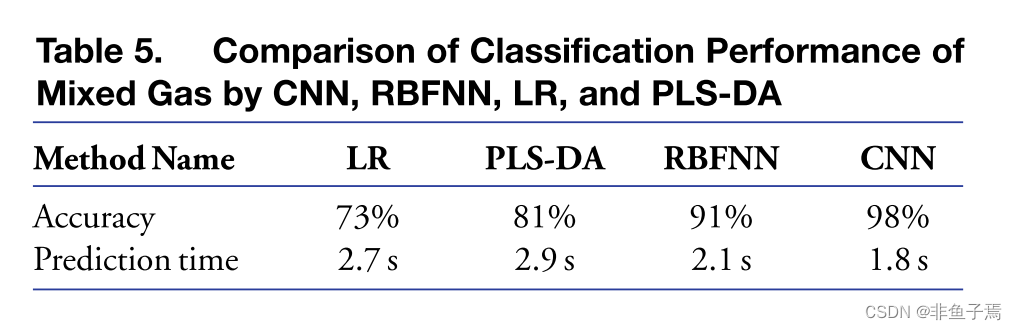
As shown in Tables 4 and 5, after modeling and analyzing the elemental gas with CNN, the identification rate of the spectral data of the prediction set can reach 100%; for the other three modeling methods, the prediction accuracy is slightly lower. For the mixed gas, under the conditions of the same spectral data of the modeling set and the same pretreatment method, the modeling effect achieved by CNN is the best, and the relevant indexes are better than the traditional modeling methods. After CNN training was carried out on the training set data modeling, experiment data of the test set the accuracy of prediction is 98%, while traditional PLS–DA classification algorithm and LR algorithm and the accuracy of RBFNN and convolution neural network has the larger gap, in the case of using the same data set and test set of multicomponent mixed gas prediction accuracy was 83%, 73%, 91%, respectively. To sum up, compared with the traditional algorithm, the method presented in this work can significantly improve the prediction accuracy of logging gas with single and multicomponent mixtures.
如表4和表5所示,利用CNN对元素气体进行建模分析后,预测集光谱数据的识别率可以达到100%;其他三种建模方法的预测精度略低。对于混合气体,在建模集光谱数据相同、预处理方法相同的条件下,CNN获得的建模效果最好,相关指标优于传统建模方法。对训练集数据建模进行CNN训练后,测试集的实验数据预测准确率为98%,而传统的PLS-DA分类算法和LR算法与rbfnn和卷积神经网络的准确率有较大差距,在使用相同数据集和测试集的情况下,多组分混合气体的预测准确率分别为83%、73%、91%。综上所述,与传统算法相比,该方法能显著提高测井气体单组分和多组分混合预测精度。

声明:上述内容不进行任何商业用途,如有影响,请联系作者。
本文内容由网友自发贡献,版权归原作者所有,本站不承担相应法律责任。如您发现有涉嫌抄袭侵权的内容,请联系:hwhale#tublm.com(使用前将#替换为@)