👨🎓个人主页:研学社的博客
💥💥💞💞欢迎来到本博客❤️❤️💥💥
🏆博主优势:🌞🌞🌞博客内容尽量做到思维缜密,逻辑清晰,为了方便读者。
⛳️座右铭:行百里者,半于九十。
📋📋📋本文目录如下:🎁🎁🎁
目录
💥1 概述
📚2 运行结果
🎉3 参考文献
🌈4 Matlab代码实现

💥1 概述
未来UAM的应用中,视觉引导将能够辅助卫星导航、无线电导航完成飞行全过程的定位。起降过程中,依靠垂直起降场的特殊标识,可以辅助起降阶段的定位和引导;而在城市上空巡航过程中,由于城市环境图像特征和纹理非常丰富,视觉导航也是易于实现的。辅助导航系统可以设计为非安全关键设备,因此DAL-C级以下的研制保证等级即可满足要求。
📚2 运行结果


部分代码:
figure;
subplot(3,1,1);plot(Time,p_array);title('p');grid on;
subplot(3,1,2);plot(Time,q_array);title('q');grid on;
subplot(3,1,3);plot(Time,r_array);title('r');grid on;
figure;
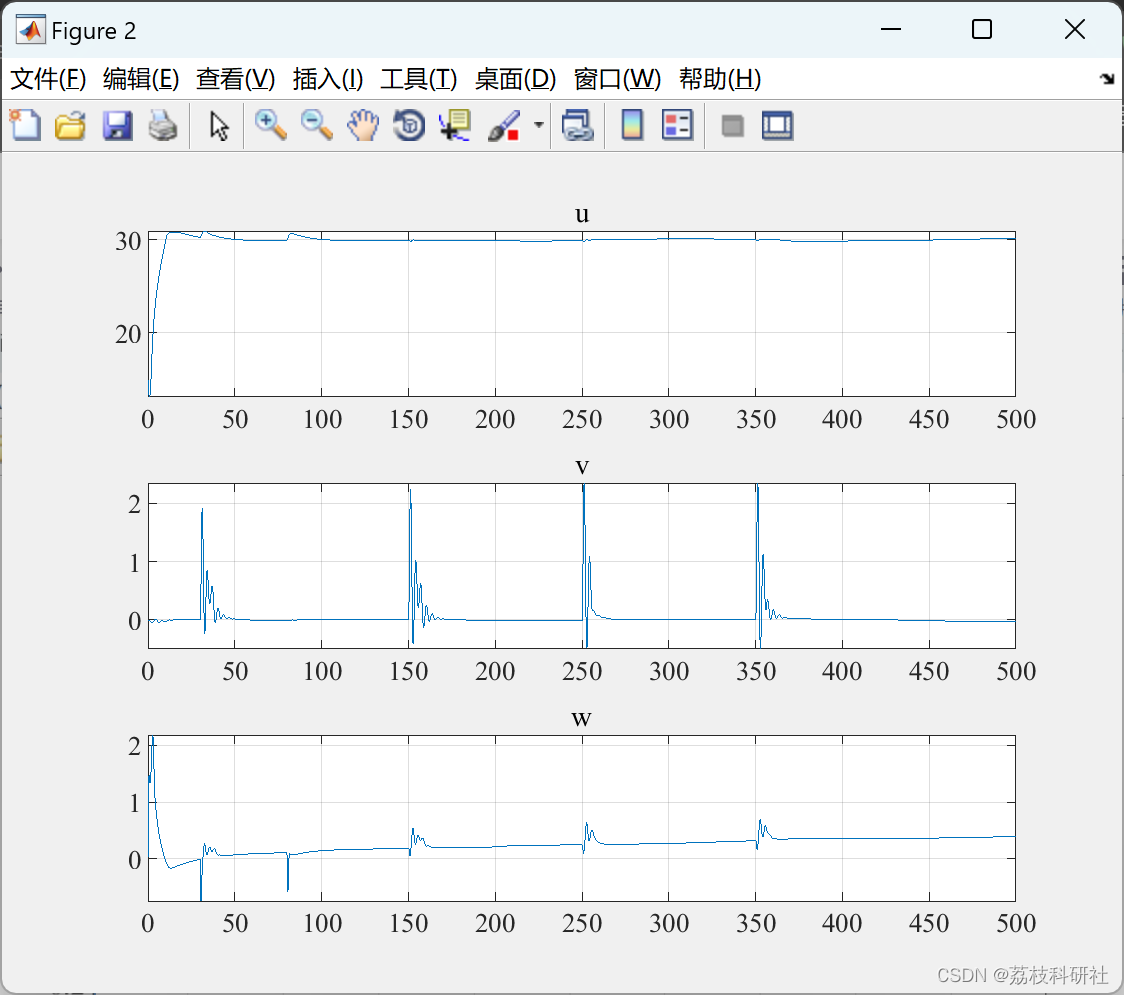
subplot(3,1,1);plot(Time,u_array);title('u');grid on;
subplot(3,1,2);plot(Time,v_array);title('v');grid on;
subplot(3,1,3);plot(Time,w_array);title('w');grid on;
figure;
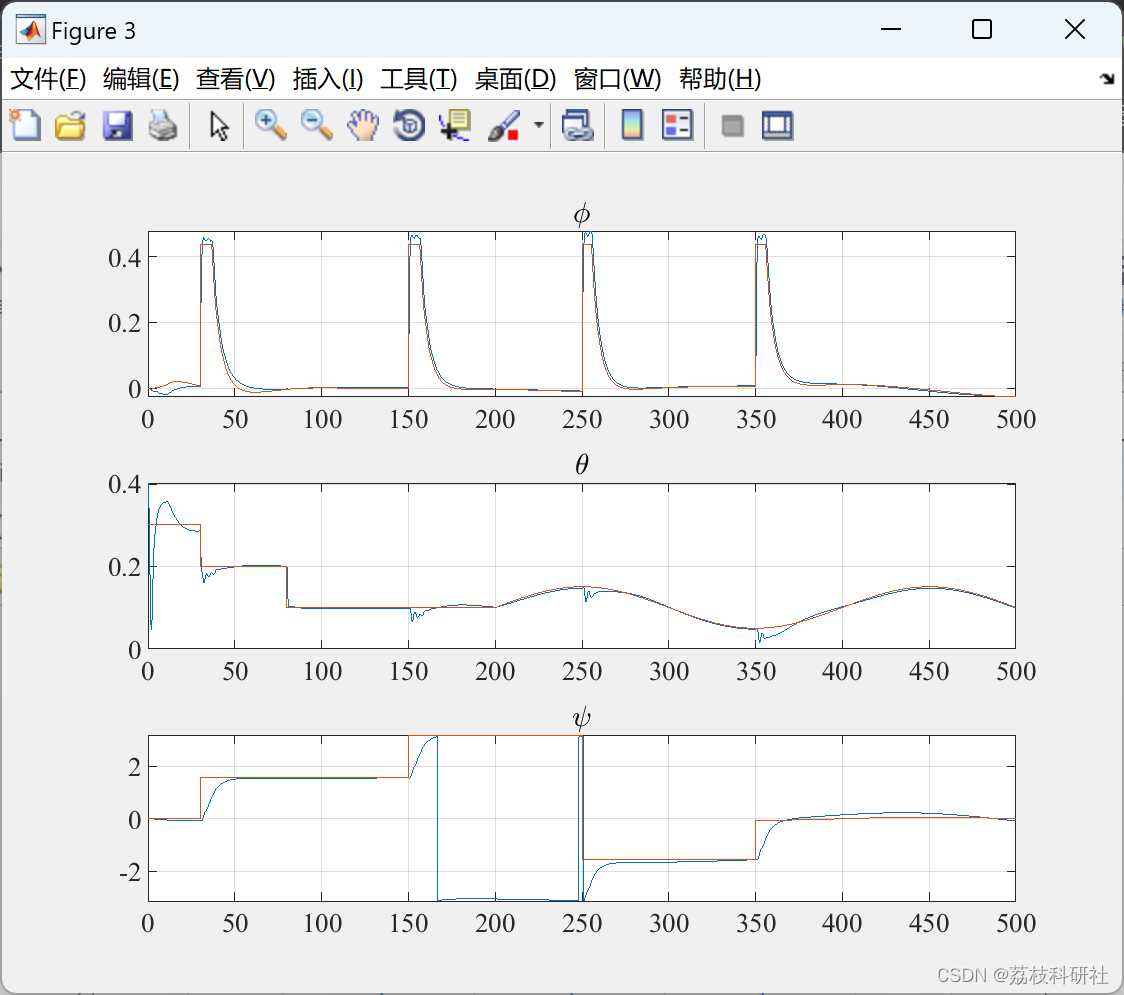
subplot(3,1,1);plot(Time,Phi_array,Time,Phi_ref_array);title('\phi');grid on;
subplot(3,1,2);plot(Time,Theta_array,Time,Theta_ref_array);title('\theta');grid on;
subplot(3,1,3);plot(Time,Psi_array,Time,Psi_ref_array);title('\psi');grid on;
figure;
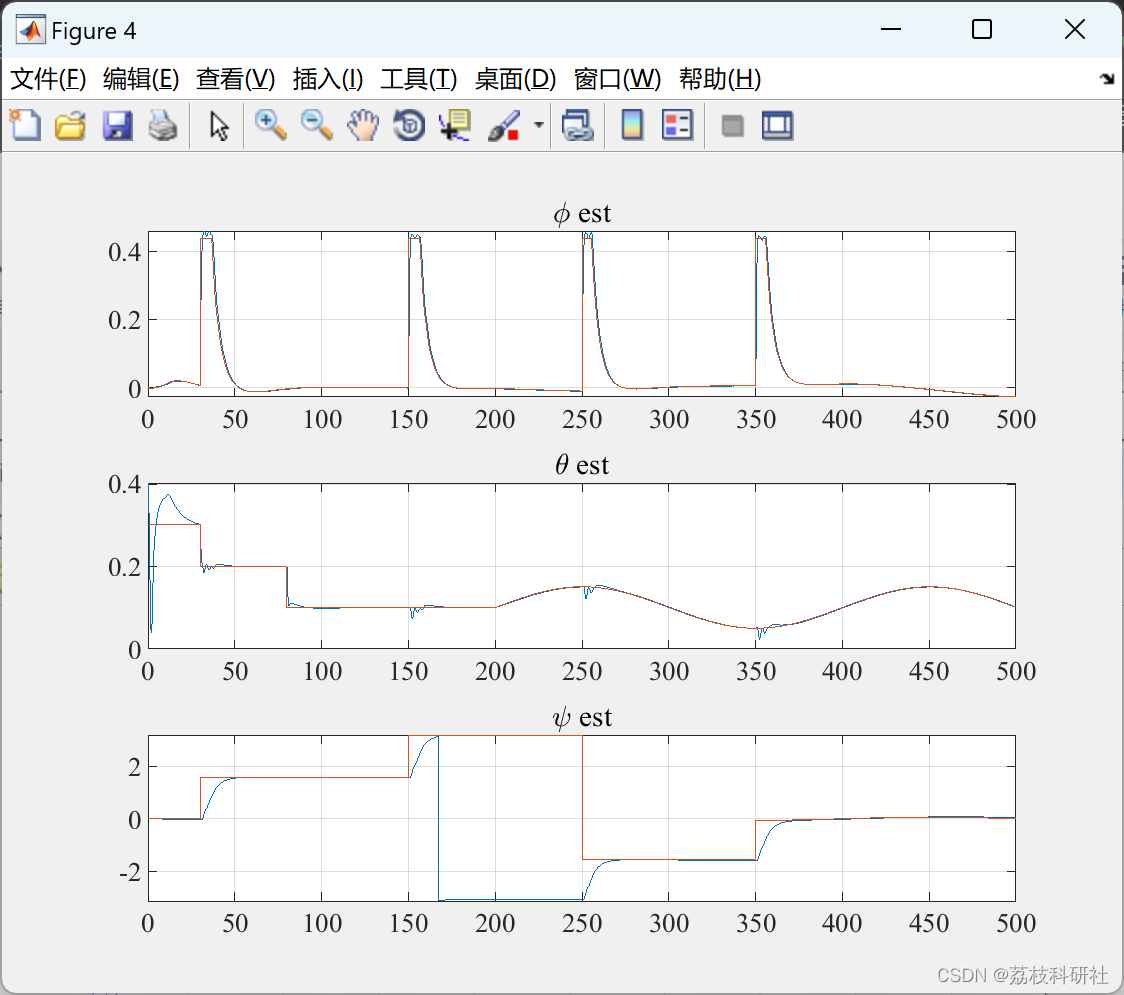
subplot(3,1,1);plot(Time,Phi_est_array,Time,Phi_ref_array);title('\phi est');grid on;
subplot(3,1,2);plot(Time,Theta_est_array,Time,Theta_ref_array);title('\theta est');grid on;
subplot(3,1,3);plot(Time,Psi_est_array,Time,Psi_ref_array);title('\psi est');grid on;
figure
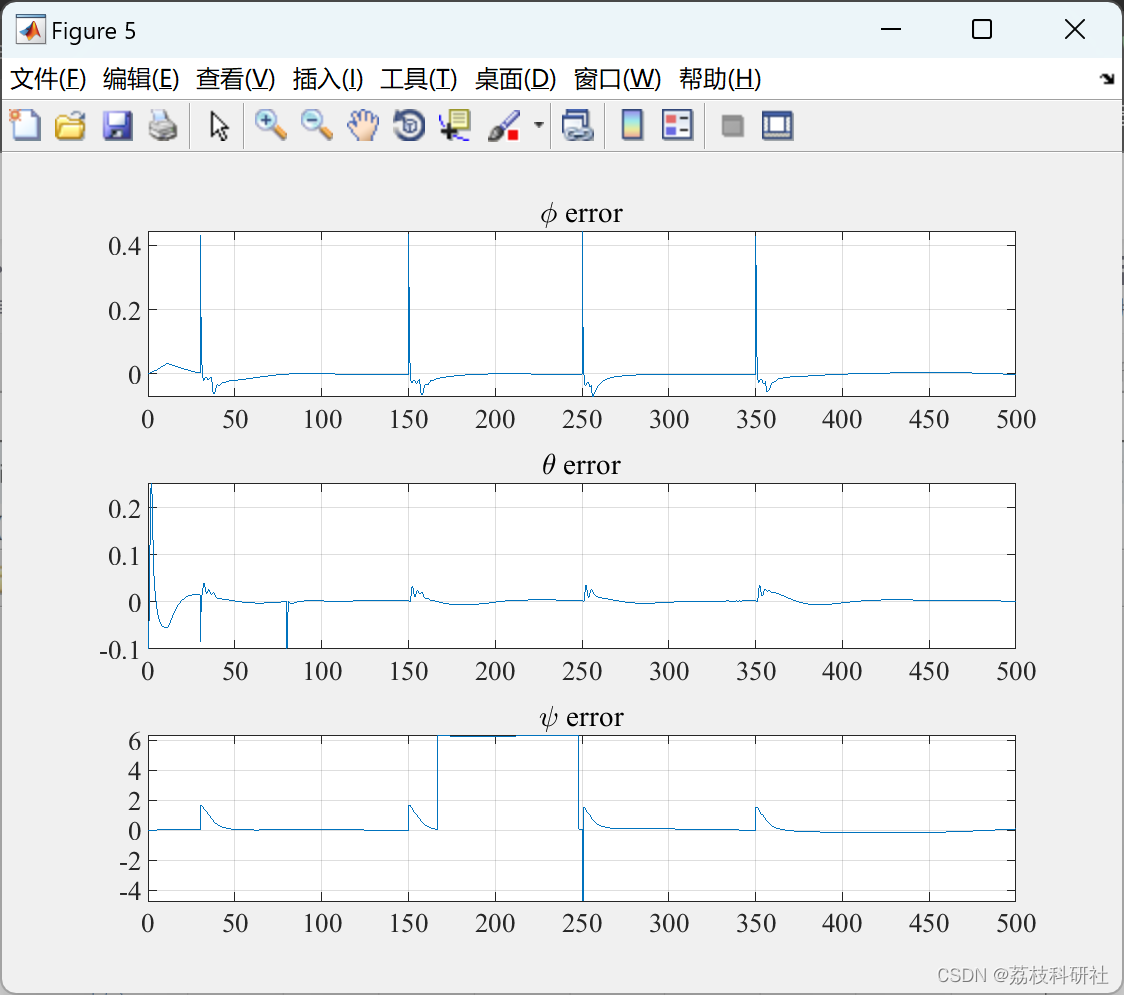
subplot(3,1,1);plot(Time,Phi_ref_array - Phi_array);title('\phi error');grid on;
subplot(3,1,2);plot(Time,Theta_ref_array - Theta_array);title('\theta error');grid on;
subplot(3,1,3);plot(Time,Psi_ref_array - Psi_array);title('\psi error');grid on;
figure
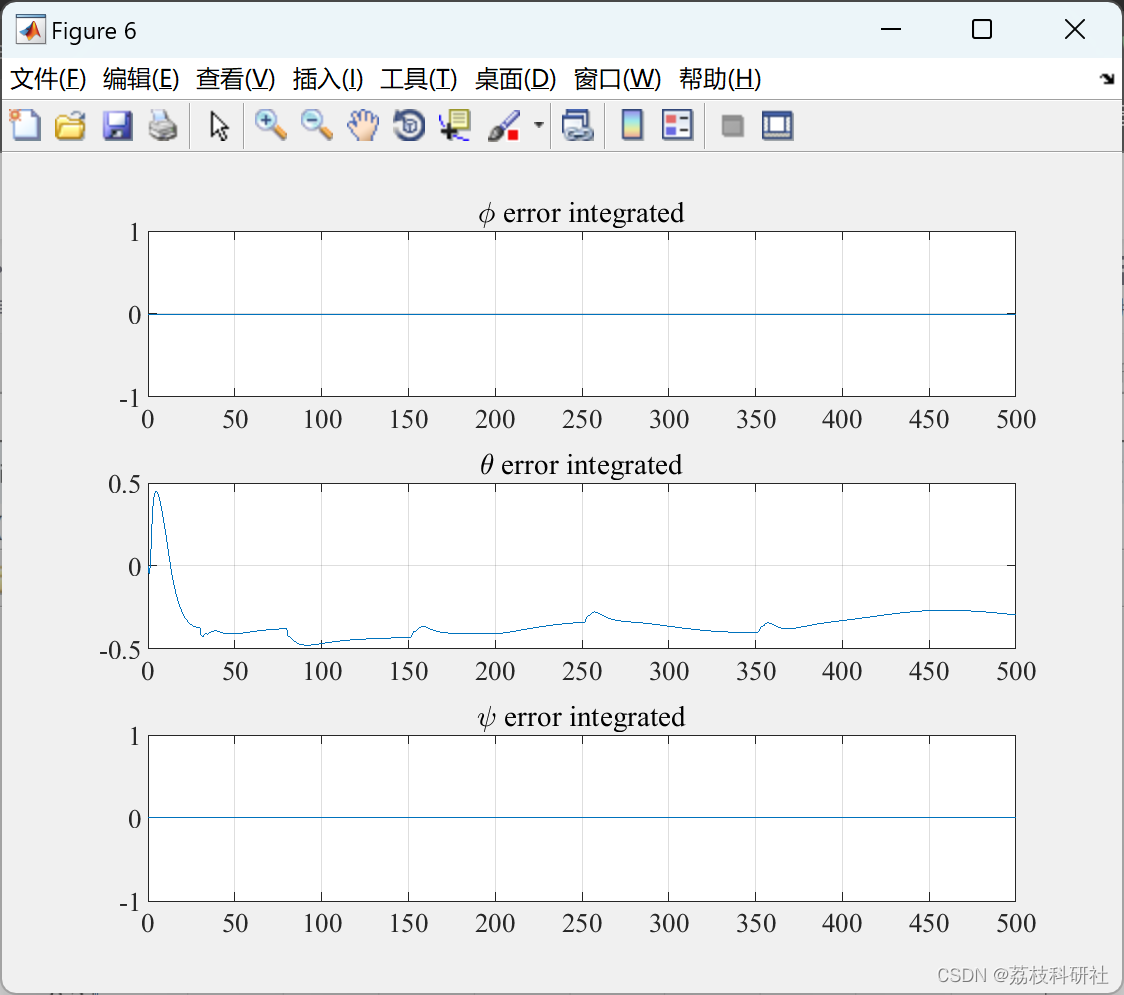
subplot(3,1,1);plot(Time,Phi_error_integer_array);title('\phi error integrated');grid on;
subplot(3,1,2);plot(Time,Theta_error_integer_array);title('\theta error integrated');grid on;
subplot(3,1,3);plot(Time,Psi_error_integer_array);title('\psi error integrated');grid on;
figure;
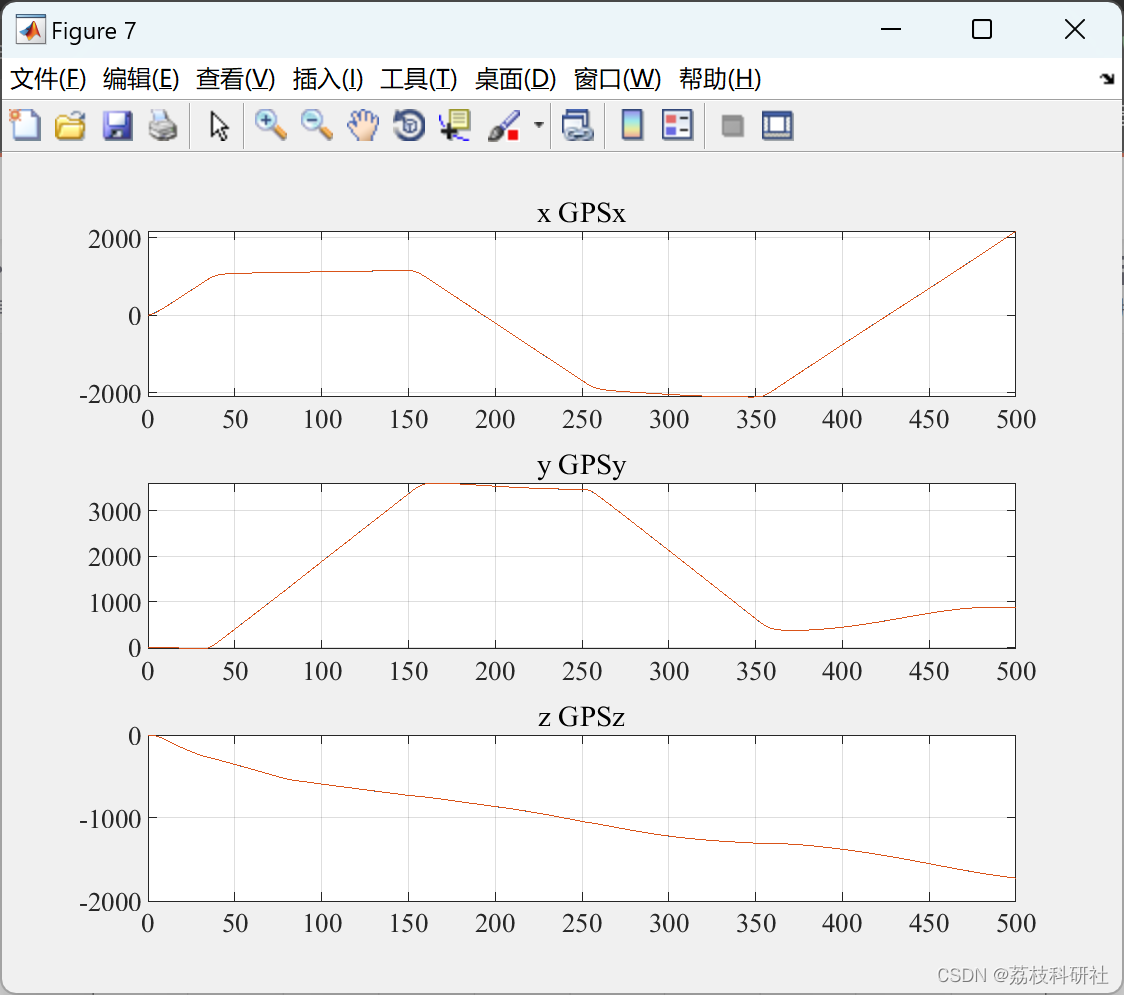
subplot(3,1,1);plot(Time,x_array,Time,GPS_n_array);title('x GPSx');grid on;
subplot(3,1,2);plot(Time,y_array,Time,GPS_e_array);title('y GPSy');grid on;
subplot(3,1,3);plot(Time,z_array,Time,GPS_d_array);title('z GPSz');grid on;
figure;
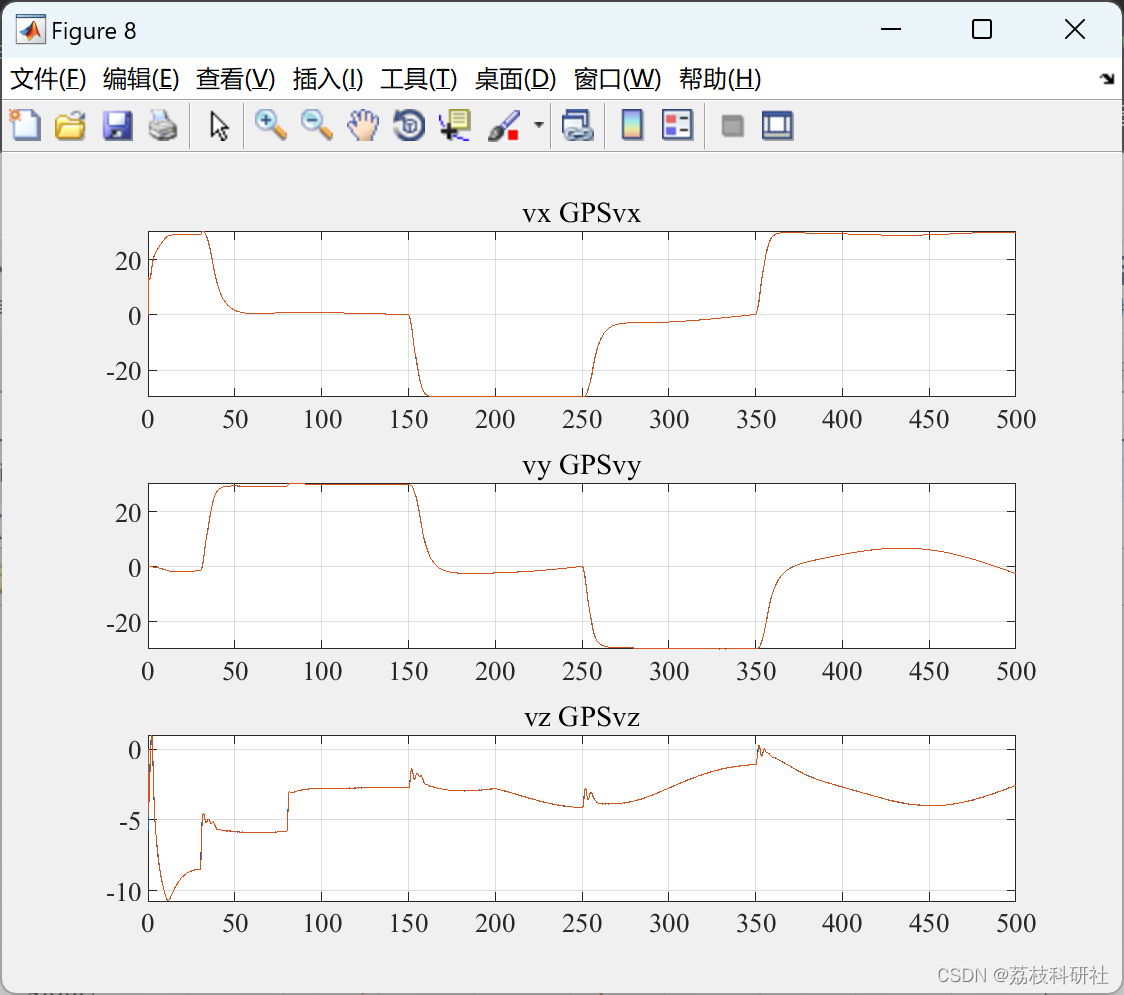
subplot(3,1,1);plot(Time,x_dot_array,Time,GPS_Vn_array);title('vx GPSvx');grid on;
subplot(3,1,2);plot(Time,y_dot_array,Time,GPS_Ve_array);title('vy GPSvy');grid on;
subplot(3,1,3);plot(Time,z_dot_array,Time,GPS_Vd_array);title('vz GPSvz');grid on;
figure;
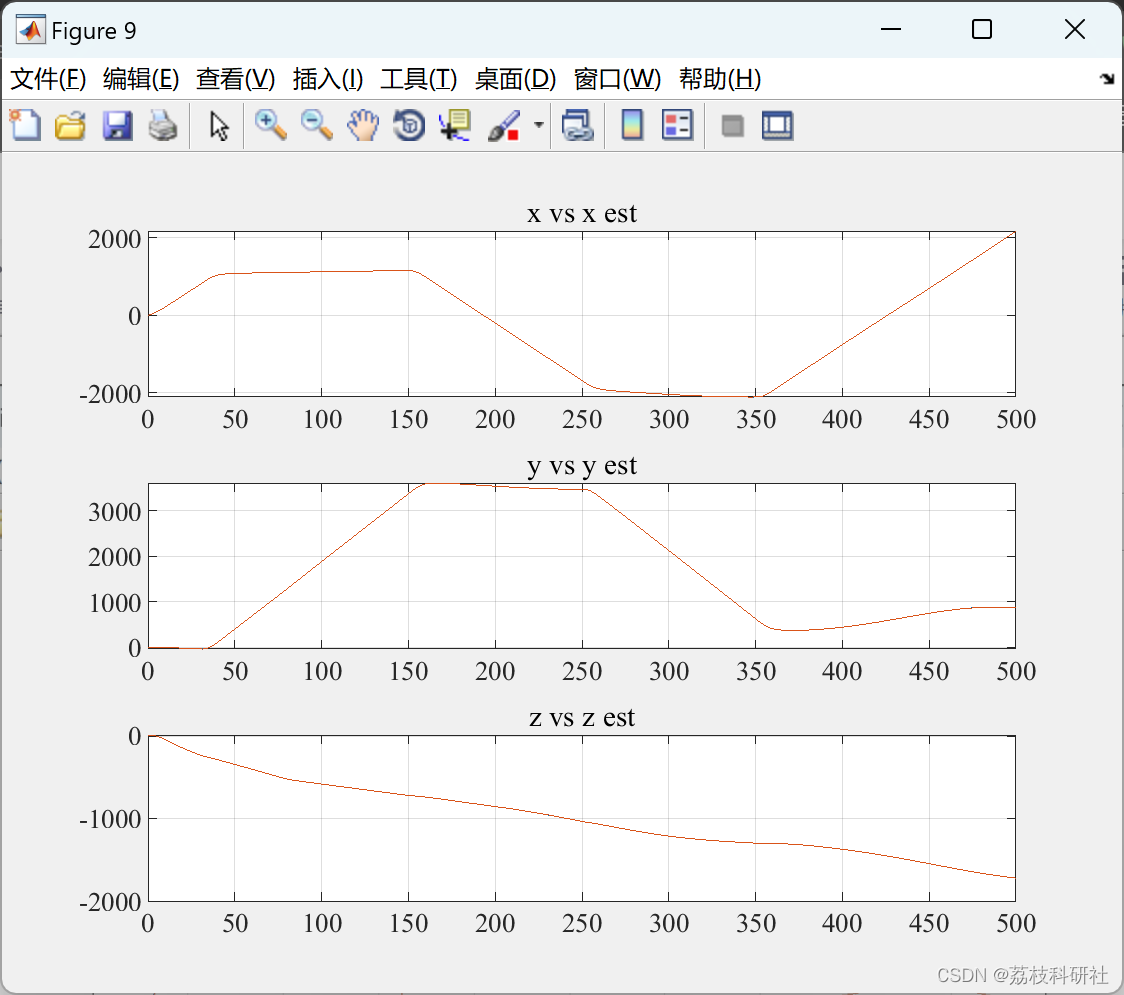
subplot(3,1,1);plot(Time,x_array,Time,x_est_array);title('x vs x est');grid on;
subplot(3,1,2);plot(Time,y_array,Time,y_est_array);title('y vs y est');grid on;
subplot(3,1,3);plot(Time,z_array,Time,z_est_array);title('z vs z est');grid on;
figure;
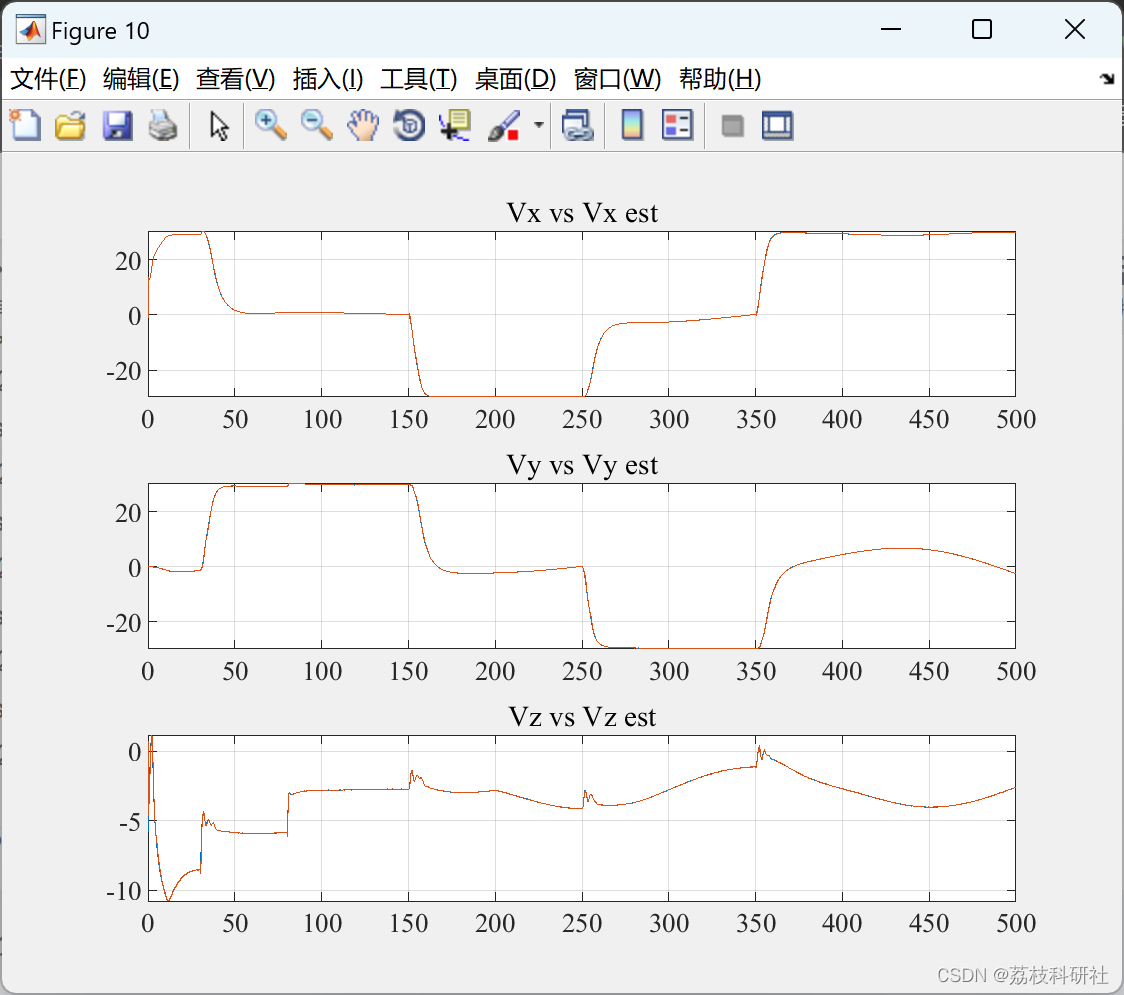
subplot(3,1,1);plot(Time,x_dot_array,Time,x_dot_est_array);title('Vx vs Vx est');grid on;
subplot(3,1,2);plot(Time,y_dot_array,Time,y_dot_est_array);title('Vy vs Vy est');grid on;
subplot(3,1,3);plot(Time,z_dot_array,Time,z_dot_est_array);title('Vz vs Vz est');grid on;
figure;
plot3(x_array,y_array,-z_array);title('Trajectory');grid on;
figure;
subplot(2,1,1);plot(Time,Alpha_array);title('\alpha');grid on;
subplot(2,1,2);plot(Time,Beta_array);title('\beta');grid on;
figure;
subplot(3,1,1);plot(Time,D_array);title('D');grid on;
subplot(3,1,2);plot(Time,Y_array);title('Y');grid on;
subplot(3,1,3);plot(Time,L_array);title('L');grid on;
figure;
subplot(3,1,1);plot(Time,Ml_array);title('Ml');grid on;
subplot(3,1,2);plot(Time,Mm_array);title('Mm');grid on;
subplot(3,1,3);plot(Time,Mn_array);title('Mn');grid on;
figure;
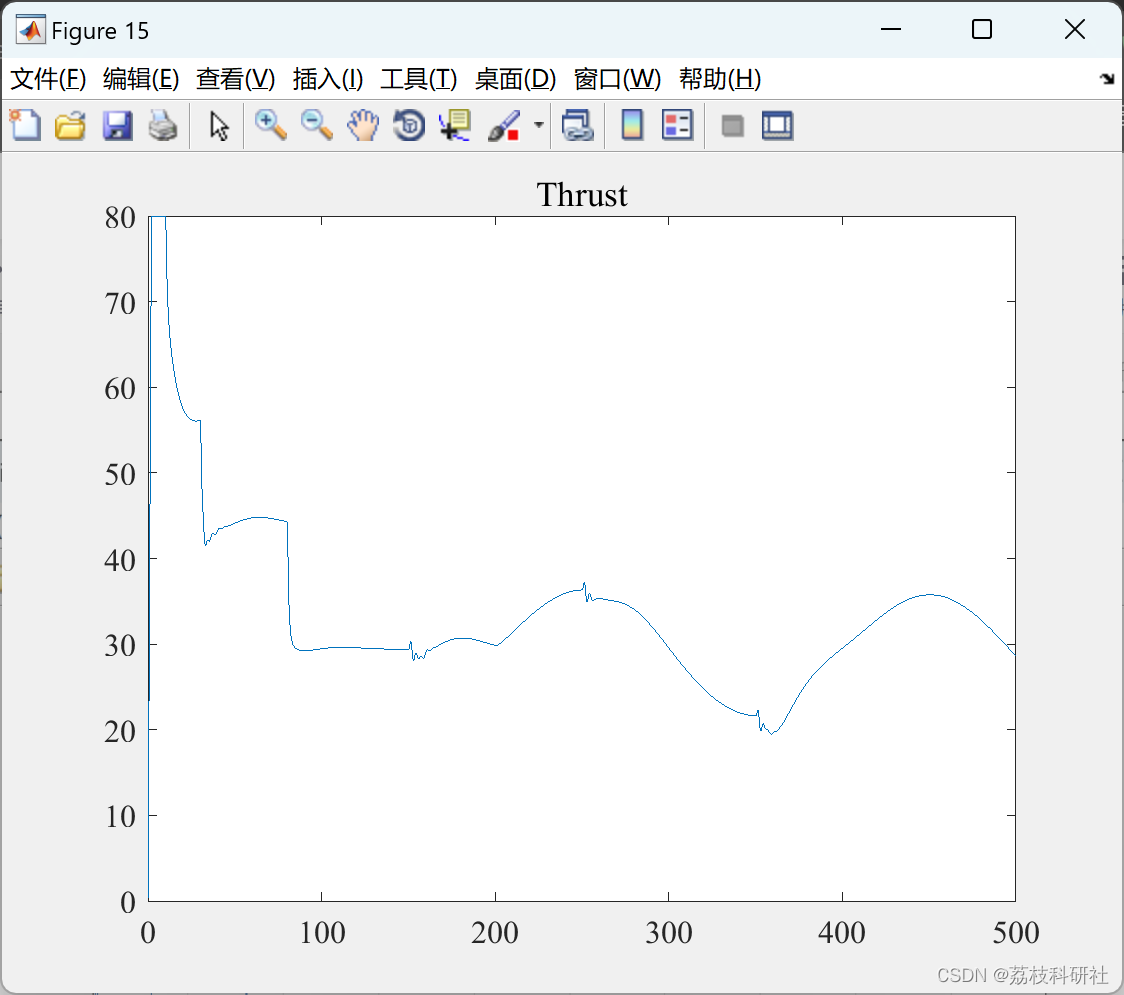
plot(Time,T_array);title('Thrust');
figure;
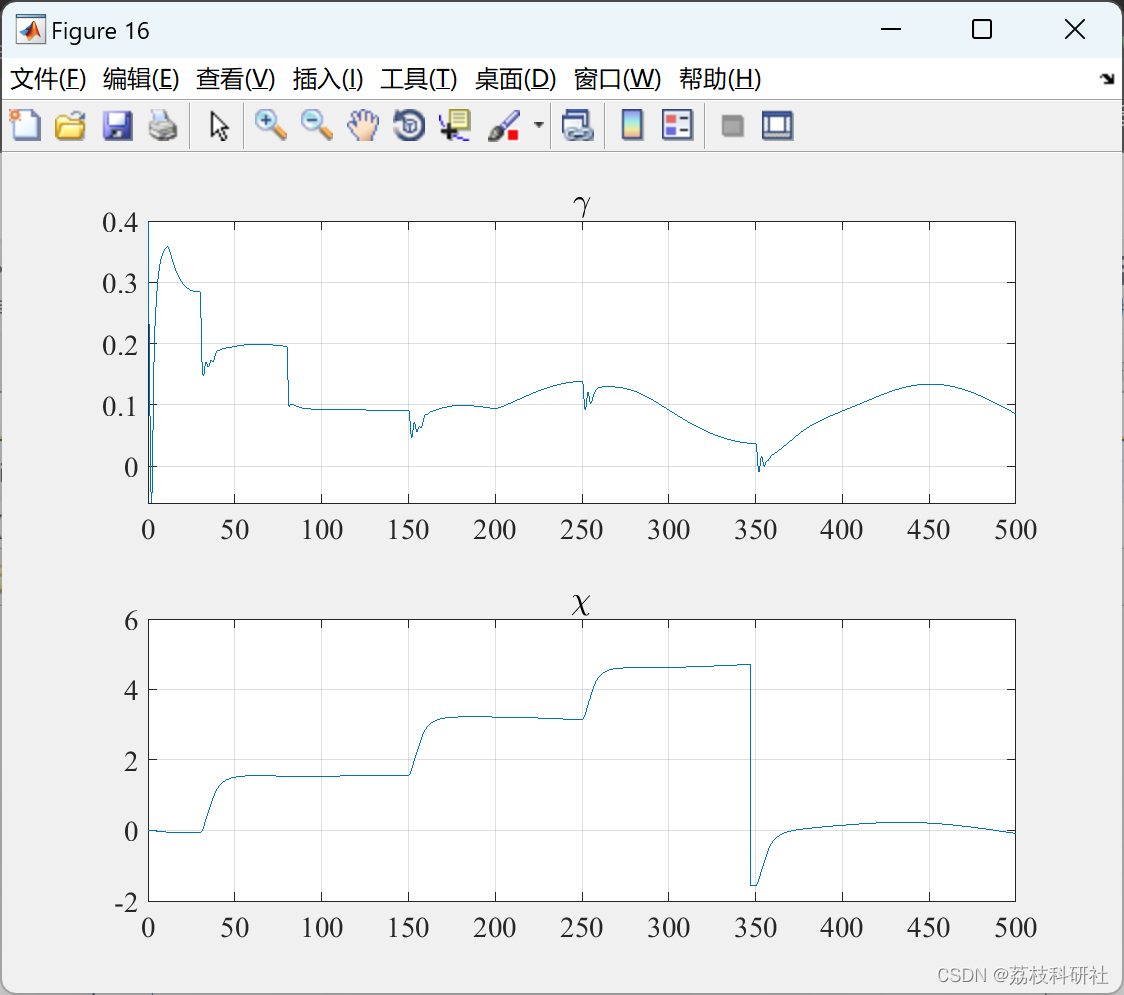
subplot(2,1,1);plot(Time,Gamma_array);title('\gamma');grid on;
subplot(2,1,2);plot(Time,Chi_array);title('\chi');grid on;
figure;
subplot(4,1,1);plot(Time,Da_array);title('\deltaa');grid on;
subplot(4,1,2);plot(Time,De_array);title('\deltae');grid on;
subplot(4,1,3);plot(Time,Dr_array);title('\deltar');grid on;
subplot(4,1,4);plot(Time,DT_array);title('\deltat');grid on;
figure;
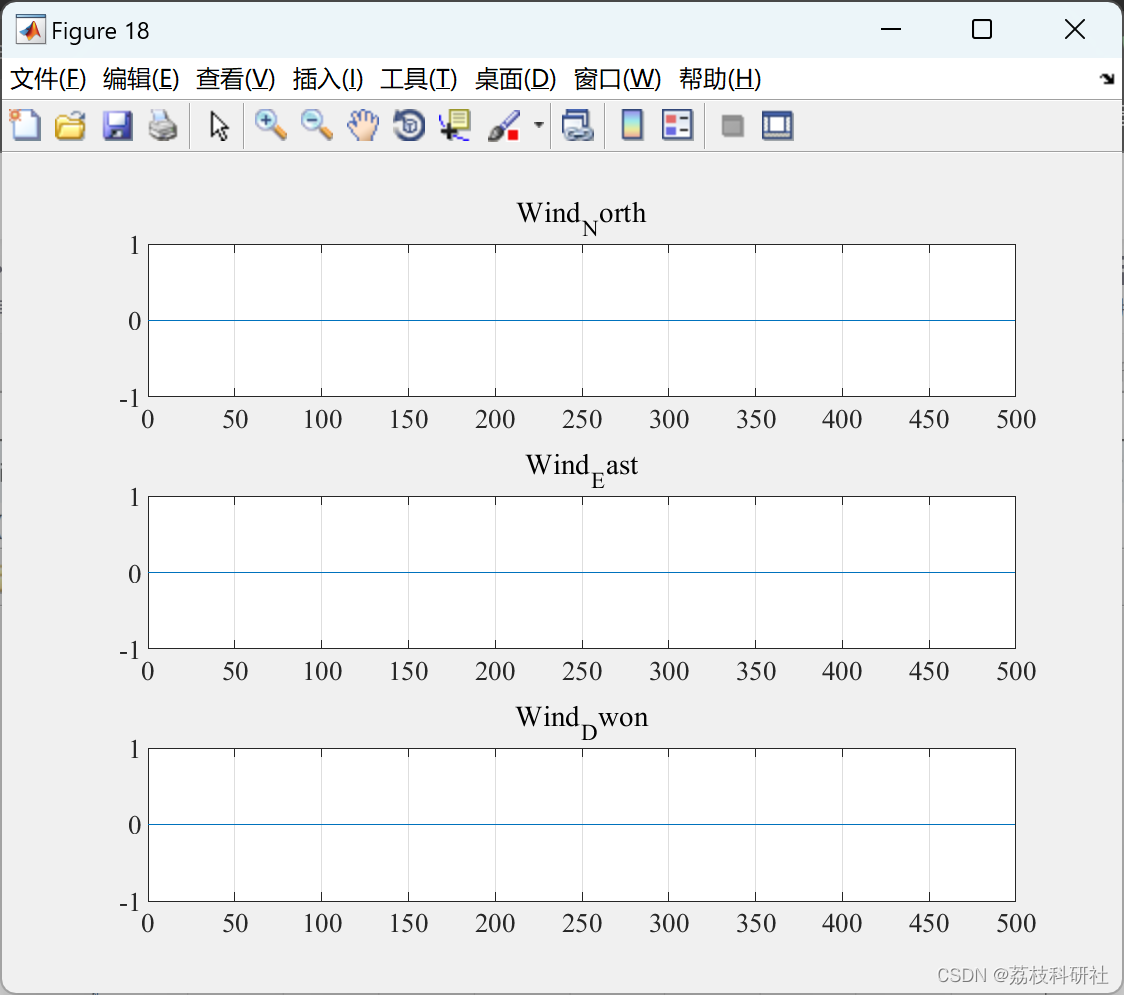
subplot(3,1,1);plot(Time,Wind_Vx_array);title('Wind_North');grid on;
subplot(3,1,2);plot(Time,Wind_Vy_array);title('Wind_East');grid on;
subplot(3,1,3);plot(Time,Wind_Vz_array);title('Wind_Dwon');grid on;
figure;
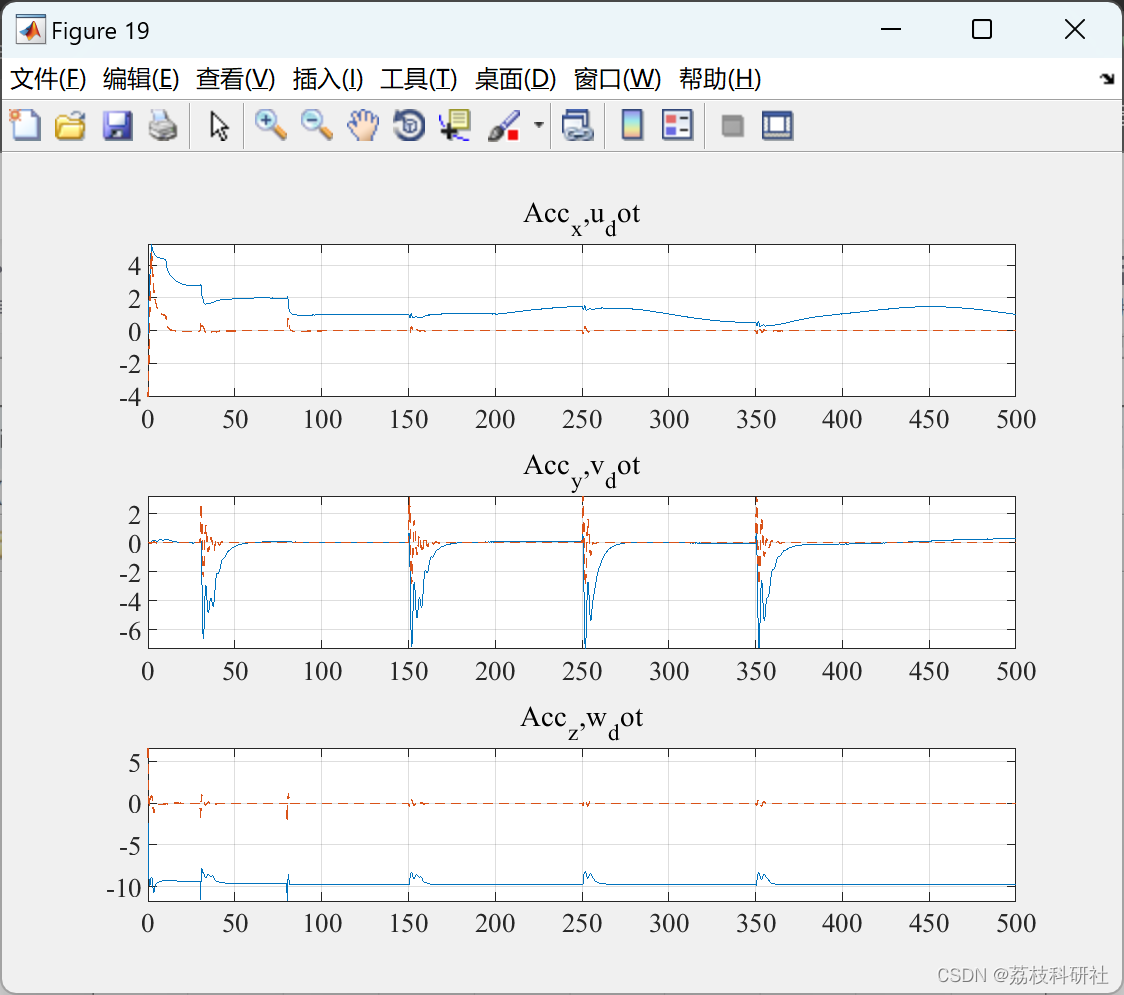
subplot(3,1,1);plot(Time,Acc_x_array,Time,u_dot_array,'--');title('Acc_x,u_dot');grid on;
subplot(3,1,2);plot(Time,Acc_y_array,Time,v_dot_array,'--');title('Acc_y,v_dot');grid on;
subplot(3,1,3);plot(Time,Acc_z_array,Time,w_dot_array,'--');title('Acc_z,w_dot');grid on;
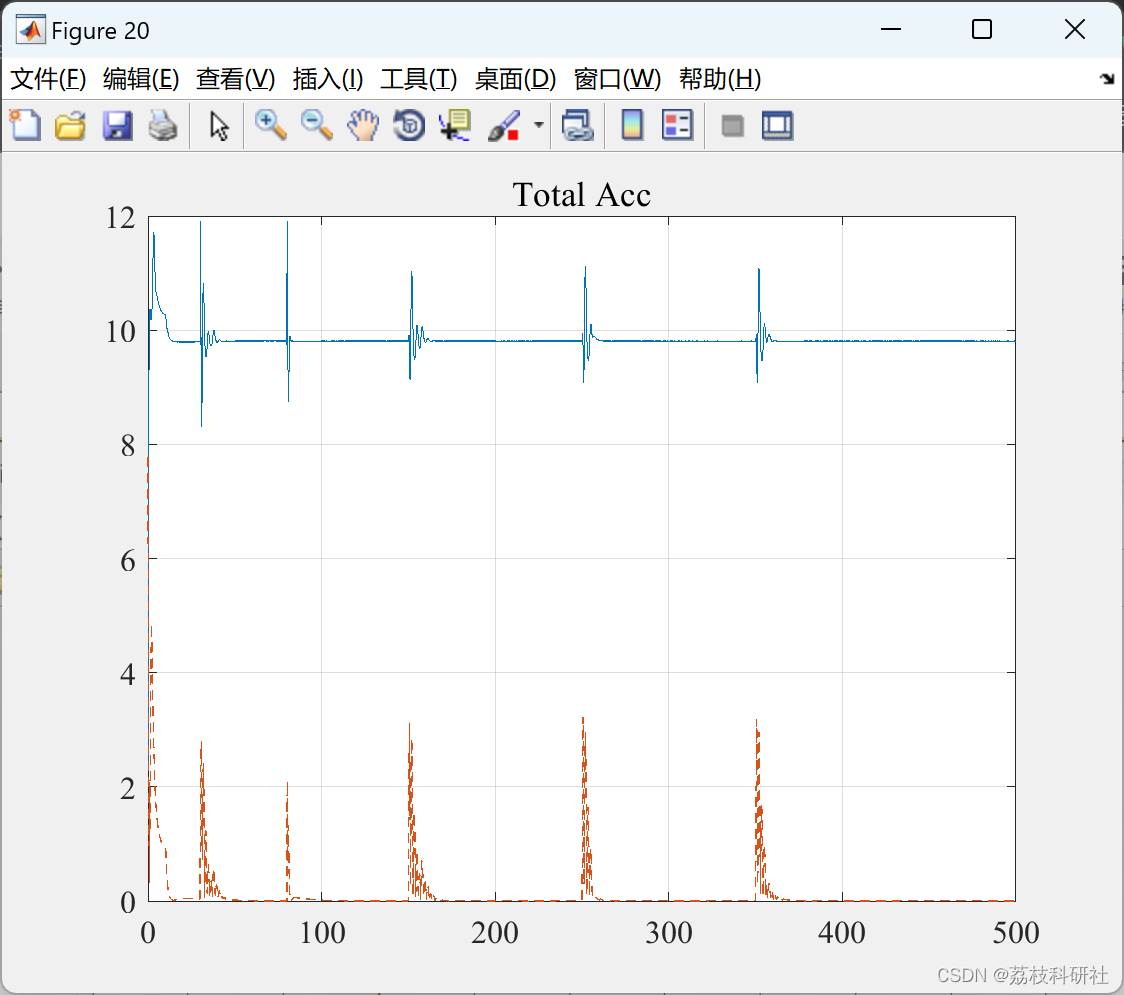
figure;plot(Time,sqrt(Acc_x_array.^2+Acc_y_array.^2+Acc_z_array.^2), ...
Time,sqrt(u_dot_array.^2+v_dot_array.^2+w_dot_array.^2),'--');title('Total Acc');grid on;
% figure;
% subplot(3,1,1);plot(Time,u_dot_array);title('u_dot');grid on;
% subplot(3,1,2);plot(Time,v_dot_array);title('v_dot');grid on;
% subplot(3,1,3);plot(Time,w_dot_array);title('w_dot');grid on;
figure;
subplot(3,1,1);plot(Time,Phi_array,Time,Phi_est_array);title('Phi est');grid on;
subplot(3,1,2);plot(Time,Theta_array,Time,Theta_est_array);title('Theta est');grid on;
subplot(3,1,3);plot(Time,Psi_array,Time,Psi_est_array);title('Psi est');grid on;
figure;
subplot(3,1,1);plot(Time,V_array);title('V_array');grid on;
subplot(3,1,2);plot(Time,V_error_array);title('V_error_array');grid on;
subplot(3,1,3);plot(Time,V_error_integer_array);title('V_error_integer_array');grid on;
% figure;
% subplot(3,1,1);plot(Time,Phi_est_array);title('Phi est');grid on;
% subplot(3,1,2);plot(Time,Theta_est_array);title('Theta est');grid on;
% subplot(3,1,3);plot(Time,Psi_est_array);title('Psi est');grid on;
tempstr = ['Max Phi error: ',num2str(max(abs(Phi_array - Phi_est_array))*180/pi),' Average error: ',num2str(mean(abs(Phi_array - Phi_est_array)))];disp(tempstr);
tempstr = ['Max Theta error: ',num2str(max(abs(Theta_array - Theta_est_array))*180/pi),' Average error: ',num2str(mean(abs(Theta_array - Theta_est_array)))];disp(tempstr);
temp = Psi_array - Psi_est_array;
for i=1:1:idata
if(temp(i)>pi)
temp(i) = temp(i) - 2*pi;
elseif(temp(i)<-pi)
temp(i) = temp(i) + 2*pi;
end
end
tempstr = ['Max Psi error: ',num2str(max(abs(temp))*180/pi),' Average error: ',num2str(mean(abs(Psi_array - Psi_est_array)))];disp(tempstr);
tempstr = ['Max x error: ',num2str(max(abs(x_array-x_est_array))),' Average error: ',num2str(mean(abs(x_array-x_est_array)))];disp(tempstr);
tempstr = ['Max y error: ',num2str(max(abs(y_array-y_est_array))),' Average error: ',num2str(mean(abs(y_array-y_est_array)))];disp(tempstr);
tempstr = ['Max z error: ',num2str(max(abs(z_array-z_est_array))),' Average error: ',num2str(mean(abs(z_array-z_est_array)))];disp(tempstr);
tempstr = ['Max vx error: ',num2str(max(abs(x_dot_array-x_dot_est_array))),' Average error: ',num2str(mean(abs(x_dot_array-x_dot_est_array)))];disp(tempstr);
tempstr = ['Max vy error: ',num2str(max(abs(y_dot_array-y_dot_est_array))),' Average error: ',num2str(mean(abs(y_dot_array-y_dot_est_array)))];disp(tempstr);
tempstr = ['Max vz error: ',num2str(max(abs(z_dot_array-z_dot_est_array))),' Average error: ',num2str(mean(abs(z_dot_array-z_dot_est_array)))];disp(tempstr);
🎉3 参考文献
部分理论来源于网络,如有侵权请联系删除。
[1]林彤.燃煤电站锅炉巡检无人机飞控及三维规划研究[J].电站系统工程,2023,39(01):31-34.
🌈4 Matlab代码实现
本文内容由网友自发贡献,版权归原作者所有,本站不承担相应法律责任。如您发现有涉嫌抄袭侵权的内容,请联系:hwhale#tublm.com(使用前将#替换为@)