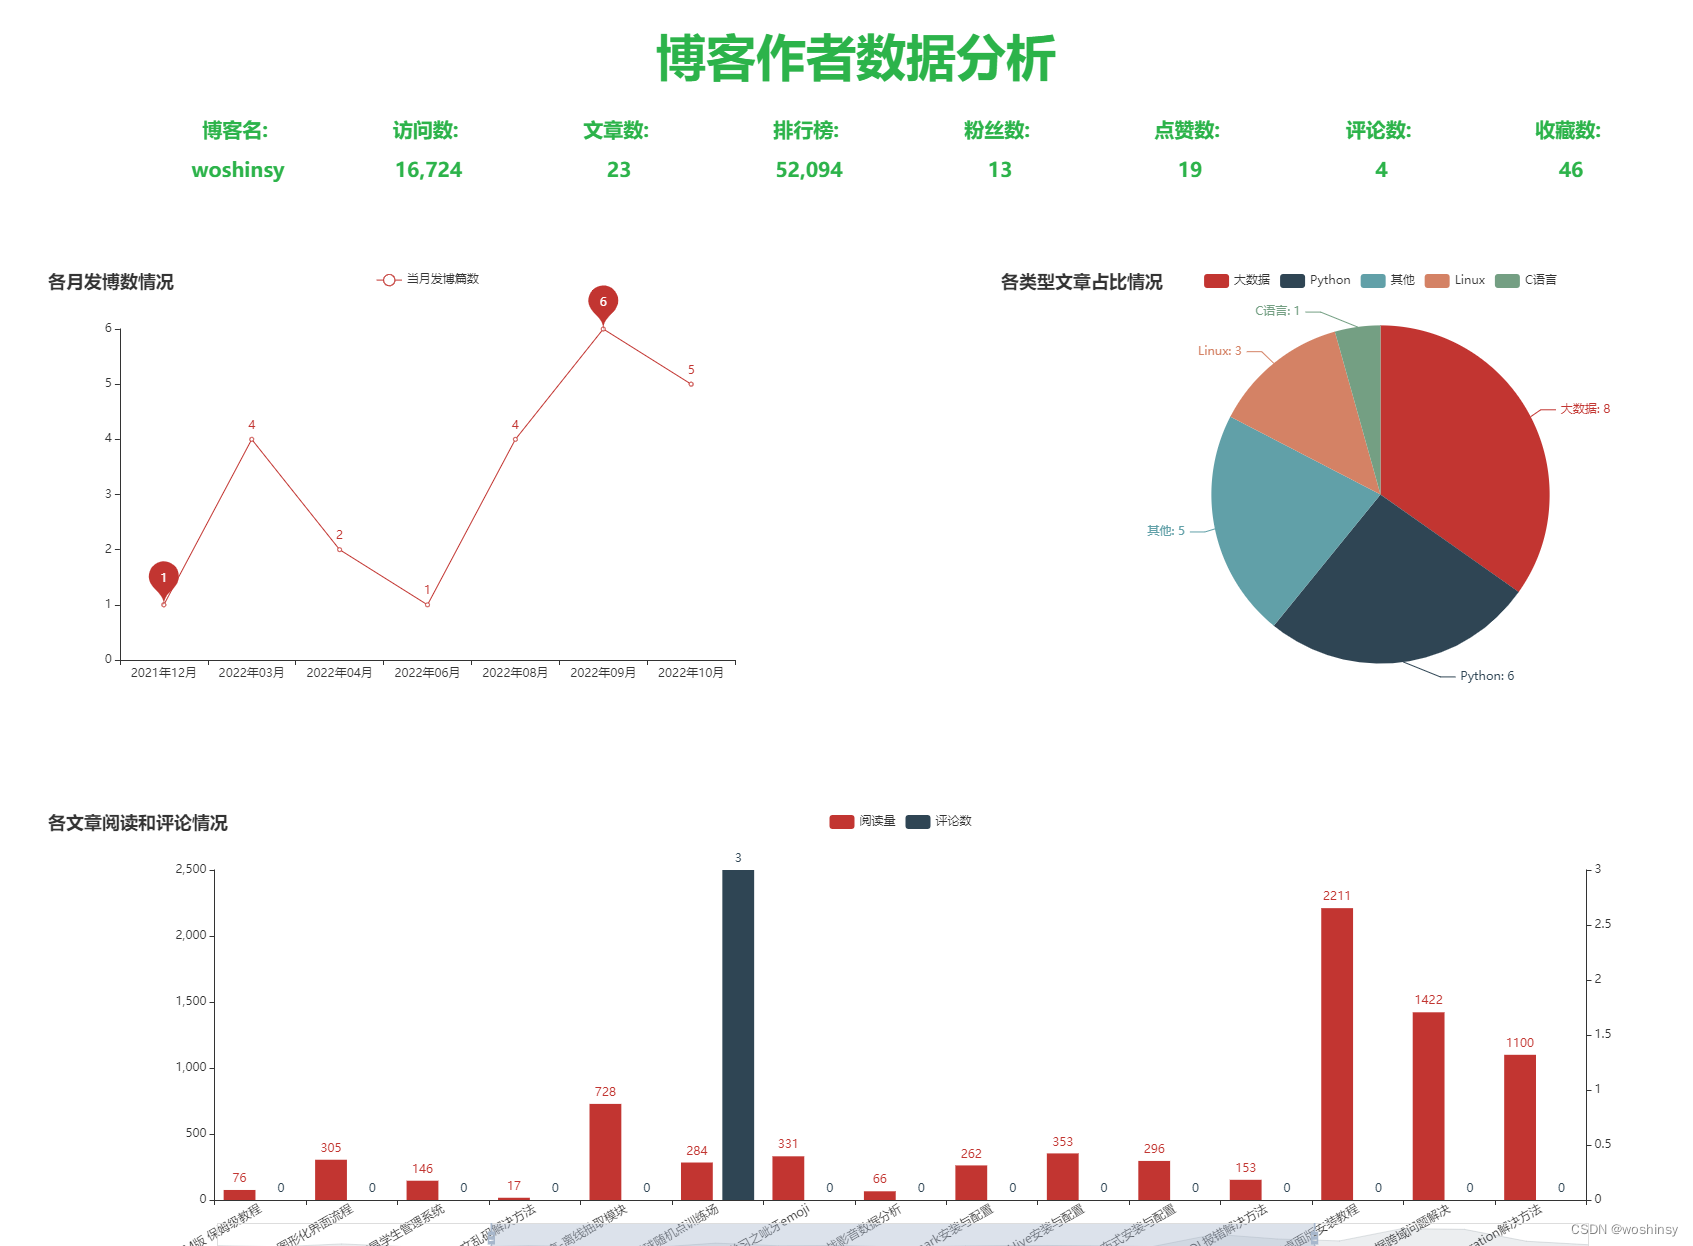
博客数据分析大屏可视化实现的效果:
一、核心功能设计
学习笔记分享:
博客作者数据分析实现的思路大致为爬虫(用户通过控制台输入用户博客地址和博客文章地址)和大屏可视化展示两方面。
接下来我们可以通过以下几步实现需求:
- 定义好相关列表准备存储相关信息
- 读取用户收入的博客地址和博客文章地址
- 使用Beautifulsoup解析器的find_all()来进行解析,使用find()和append()实现关键字和数值的查找
- 可视化部分读取excel爬取的数据
- 使用PyEchart实现博客作者详细信息和文章信息图表
二、准备工作
1. Requests
Requests官方文档:requests
requests是一个很实用的Python HTTP客户端库,爬虫和测试服务器响应数据时经常会用到,requests是Python语言的第三方的库,专门用于发送HTTP请求。
2. PyEchart
PyEchart官方文档:pyechart
Echarts是一个由百度开源的商业级数据图表,它是一个纯JavaScript的图表库,可以为用户提供直观生动,可交互,可高度个性化定制的数据可视化图表,赋予了用户对数据进行挖掘整合的能力。
三、实现步骤
(一)、爬虫部分实现
1. 获取网页数据并返回
核心设计代码如下:
def get_html(url):
try:
headers = {
'User-Agent': 'Mozilla/5.0 (MSIE 10.0; Windows NT 6.1; Trident/5.0)',
}
r = requests.get(url,headers=headers)
r.raise_for_status()
r.encoding = r.apparent_encoding
return r.text
except:
return '错误'
2. 爬取博客作者和文章相关数据
核心设计代码如下:
def author_info():
head_img = []
author_name = []
visitor_num = []
article_num = []
rank_num = []
fans_num = []
like_num = []
comment_num = []
fav_num = []
url = input("请输入博客用户地址:")
print(url)
html = get_html(url)
soup = BeautifulSoup(html, 'html.parser')
tx = soup.find('div', class_='user-profile-avatar').find('img')['src']
head_img.append(str(tx))
yhm = soup.find('div', class_='user-profile-head-name').find('div').get_text()
author_name.append(str(yhm))
fwl = soup.find_all('div', class_='user-profile-statistics-num')[0].get_text()
visitor_num.append(fwl)
print(visitor_num)
wzs = soup.find_all('div', class_='user-profile-statistics-num')[1].get_text()
article_num.append(wzs)
print(article_num)
phb = soup.find_all('div', class_='user-profile-statistics-num')[2].get_text()
rank_num.append(phb)
print(rank_num)
fss = soup.find_all('div', class_='user-profile-statistics-num')[3].get_text()
fans_num.append(fss)
print(fans_num)
dzs = soup.find('ul', class_='aside-common-box-achievement').find_all('span')[0].get_text()
like_num.append(dzs)
print(like_num)
pls = soup.find('ul', class_='aside-common-box-achievement').find_all('span')[1].get_text()
comment_num.append(pls)
print(comment_num)
scs = soup.find('ul', class_='aside-common-box-achievement').find_all('span')[-1].get_text()
fav_num.append(scs)
print(fav_num)
info = {'头像': head_img, '用户名': author_name, '访问数': visitor_num,'文章数': article_num, '排行榜': rank_num, '粉丝数': fans_num,'点赞数': like_num, '评论数': comment_num, '收藏数': fav_num}
info_blog_file = pandas.DataFrame(info)
info_blog_file.to_excel('info_blog_author.xlsx', sheet_name="博客数据分析")
return head_img, author_name, visitor_num,article_num,rank_num,fans_num,like_num,comment_num,fav_num
def blog_info():
names = []
looks = []
writedown= []
blog_type = []
blog_time = []
headers = {
'User-Agent': 'Mozilla/5.0 (MSIE 10.0; Windows NT 6.1; Trident/5.0)',
}
base_url = input("请输入博客文章地址:")
r = requests.get(base_url+"1", headers=headers, timeout=3)
max_page = int(re.findall(r'var listTotal = (\d+);', r.text)[0])//40+1
count = 0
for i in range(1, max_page + 1):
url = base_url + str(i)
r = requests.get(url, headers=headers)
soup = BeautifulSoup(r.text, 'html.parser')
articles = soup.find("div", class_='article-list').find_all('div',class_='article-item-box csdn-tracking-statistics')
for tag in articles:
title = tag.find('h4').find('a').get_text(strip=True)[2:]
names.append(str(title))
the_type = '其他'
article_types = ['C语言', '大数据', 'Python', 'Linux']
for article_type in article_types:
if article_type in title:
the_type = article_type
break
blog_type.append(str(the_type))
issuing_time = tag.find('span', class_="date").get_text(strip=True)
blog_time.append(issuing_time)
num_list = tag.find_all('span', class_="read-num")
read_num = num_list[0].get_text(strip=True)
looks.append(read_num)
if len(num_list) > 1:
comment_num = num_list[1].get_text(strip=True)
writedown.append(comment_num)
else:
comment_num = 0
writedown.append(comment_num)
count += 1
print(names)
print(blog_type)
print(looks)
print(writedown)
time.sleep(random.choice([1, 1.1, 1.3]))
info = {'文章名': names,'文章类型': blog_type, '发博时间': blog_time, '阅读量': looks, '评论数': writedown}
info_blog_file = pandas.DataFrame(info)
info_blog_file.to_excel('info_blog.xlsx', sheet_name="博客文章数据分析")
return names,blog_type,blog_time, looks, writedown
if __name__ == '__main__':
author_info()
print('作者信息获取成功')
blog_info()
print('博客信息获取成功')
(二)、可视化部分实现
1. 读取存储至excel表格的数据
excel_data = pd.read_excel("info_blog.xlsx")
excel_data_author = pd.read_excel("info_blog_author.xlsx")
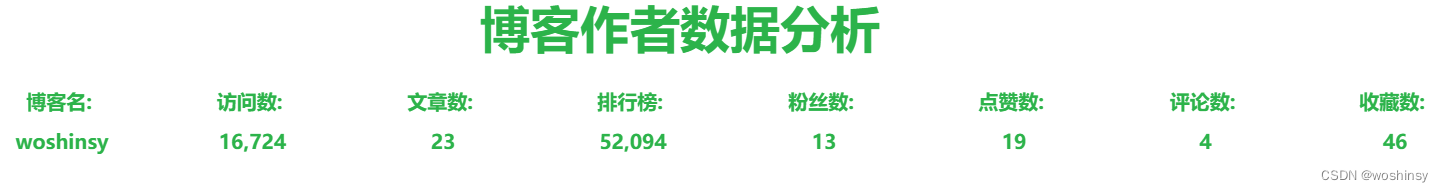
2. 绘制上半部分作者详细信息
def tab0(name, color):
c = (Pie().
set_global_opts(
title_opts=opts.TitleOpts(title='博客名:\n\n '+name, pos_left='center', pos_top='center',
title_textstyle_opts=opts.TextStyleOpts(color=color, font_size=20))))
return c
def tab2(name, color):
c = (Pie().
set_global_opts(
title_opts=opts.TitleOpts(title='访问数:\n\n '+name, pos_left='center', pos_top='center',
title_textstyle_opts=opts.TextStyleOpts(color=color, font_size=20))))
return c
def tab3(name, color):
c = (Pie().
set_global_opts(
title_opts=opts.TitleOpts(title='文章数:\n\n '+name, pos_left='center', pos_top='center',
title_textstyle_opts=opts.TextStyleOpts(color=color, font_size=20))))
return c
def tab4(name, color):
c = (Pie().
set_global_opts(
title_opts=opts.TitleOpts(title='排行榜:\n\n '+name, pos_left='center', pos_top='center',
title_textstyle_opts=opts.TextStyleOpts(color=color, font_size=20))))
return c
def tab5(name, color):
c = (Pie().
set_global_opts(
title_opts=opts.TitleOpts(title='粉丝数:\n\n '+name, pos_left='center', pos_top='center',
title_textstyle_opts=opts.TextStyleOpts(color=color, font_size=20))))
return c
def tab6(name, color):
c = (Pie().
set_global_opts(
title_opts=opts.TitleOpts(title='点赞数:\n\n '+name, pos_left='center', pos_top='center',
title_textstyle_opts=opts.TextStyleOpts(color=color, font_size=20))))
return c
def tab7(name, color):
c = (Pie().
set_global_opts(
title_opts=opts.TitleOpts(title='评论数:\n\n '+name, pos_left='center', pos_top='center',
title_textstyle_opts=opts.TextStyleOpts(color=color, font_size=20))))
return c
def tab8(name, color):
c = (Pie().
set_global_opts(
title_opts=opts.TitleOpts(title='收藏数:\n\n '+name, pos_left='center', pos_top='center',
title_textstyle_opts=opts.TextStyleOpts(color=color, font_size=20))))
return c
def tab1(name, color):
c = (Pie().
set_global_opts(
title_opts=opts.TitleOpts(title=name, pos_left='center', pos_top='center',
title_textstyle_opts=opts.TextStyleOpts(color=color, font_size=50))))
return c
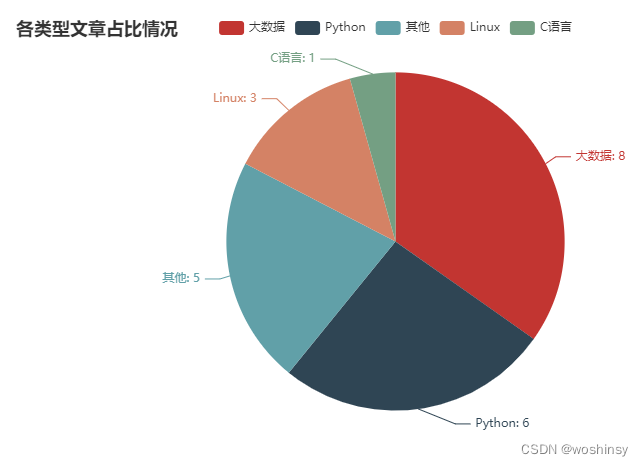
3. 绘制饼图 文章类型占比情况
def blog_type_radius():
type_cate = excel_data["文章类型"].value_counts()
cate = type_cate.index.tolist()
data = []
for v in type_cate:
data.append(v)
c = (
Pie()
.add("", [list(z) for z in zip(cate, data)])
.set_global_opts(title_opts=opts.TitleOpts(title="各类型文章占比情况"))
.set_series_opts(label_opts=opts.LabelOpts(formatter="{b}: {c}"))
)
return c
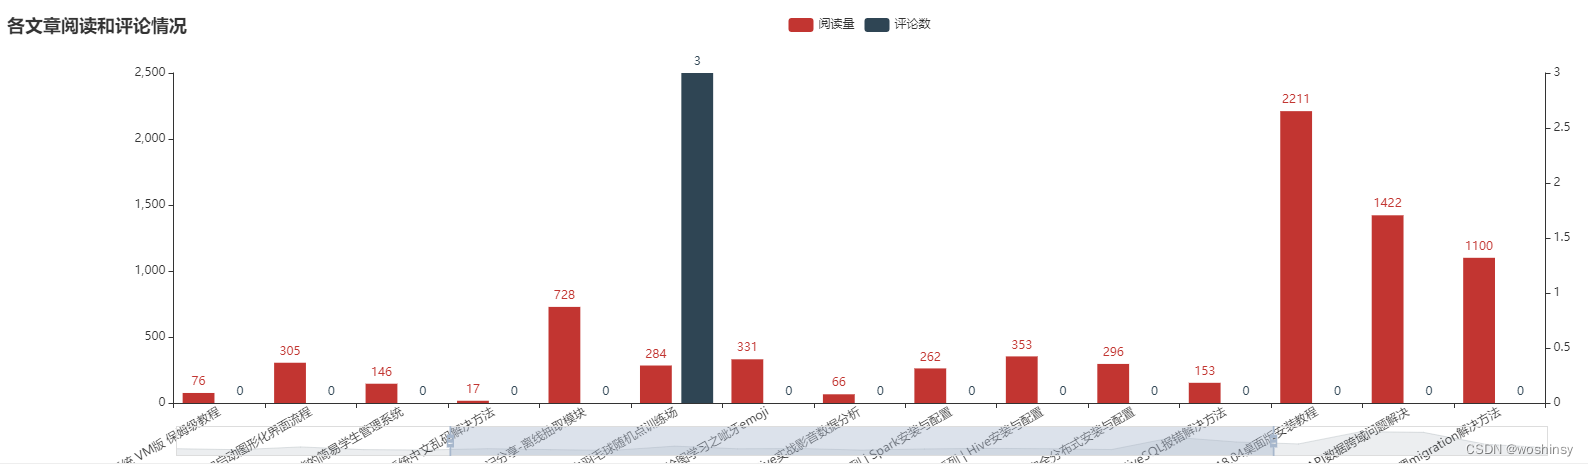
4. 绘制柱状图 文章阅读量和评论数情况
def blog_Bar():
y_data_1 = excel_data["阅读量"].tolist()
y_data_2 = excel_data["评论数"].tolist()
chart = Bar(init_opts = opts.InitOpts(width="1600px")).set_global_opts(
title_opts=opts.TitleOpts(title="各文章阅读和评论情况"),
datazoom_opts=opts.DataZoomOpts(type_="slider"),
xaxis_opts=opts.AxisOpts(axislabel_opts={"rotate": 30,"interval":"0"})
).set_series_opts(label_opts=opts.LabelOpts(position="right"))
chart.add_xaxis(excel_data["文章名"].tolist())
chart.add_yaxis(
'阅读量',
y_data_1,
yaxis_index=0
)
chart.add_yaxis(
'评论数',
y_data_2,
yaxis_index=1
)
chart.extend_axis(yaxis=opts.AxisOpts())
return chart
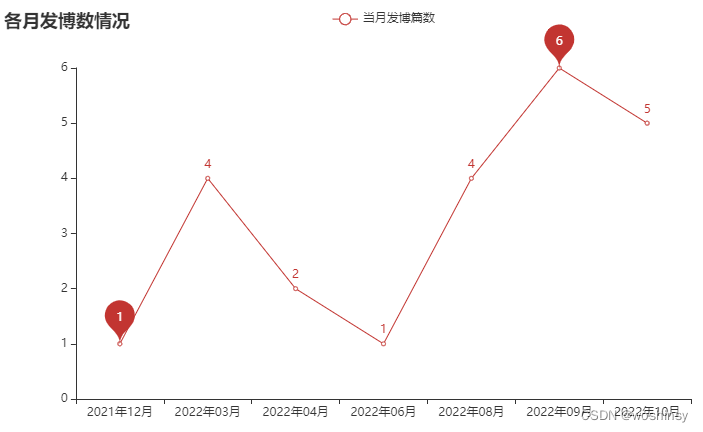
5. 绘制线图 当月发博数情况
def blog_line():
month_blog = excel_data["发博时间"].apply(lambda x: x[:7].split('-')[0] + "年" + x[:7].split('-')[-1] + "月").value_counts(sort=False)
month_blog.sort_index(inplace=True)
x_data = month_blog.index.tolist()
y_data = []
for v in month_blog:
y_data.append(v)
c = (
Line()
.add_xaxis(x_data)
.add_yaxis("当月发博篇数", y_data, is_connect_nones=True,markpoint_opts=opts.MarkPointOpts(data=[opts.MarkPointItem(type_="min"),opts.MarkPointItem(type_="max")]))
.set_global_opts(title_opts=opts.TitleOpts(title="各月发博数情况"))
)
return c
6. 四表合并 博客数据分析大屏可视化
page = Page()
page.add(
tab0(excel_data_author["用户名"][0],"#2CB34A"),
tab2(str(excel_data_author["访问数"][0]),"#2CB34A"),
tab3(str(excel_data_author["文章数"][0]),"#2CB34A"),
tab4(str(excel_data_author["排行榜"][0]),"#2CB34A"),
tab5(str(excel_data_author["粉丝数"][0]),"#2CB34A"),
tab6(str(excel_data_author["点赞数"][0]),"#2CB34A"),
tab7(str(excel_data_author["评论数"][0]),"#2CB34A"),
tab8(str(excel_data_author["收藏数"][0]),"#2CB34A"),
blog_line(),
tab1("博客作者数据分析", "#2CB34A"),
blog_type_radius(),
blog_Bar(),
)
page.render("博客数据分析大屏可视化.html")
print("生成大屏成功")
with open("博客数据分析大屏可视化.html", "r+", encoding='utf-8') as html:
html_bf = BeautifulSoup(html, 'lxml')
divs = html_bf.select('.chart-container')
divs[0]["style"] = "width:10%;height:10%;position:absolute;top:12%;left:10%;"
divs[1]["style"] = "width:10%;height:10%;position:absolute;top:12%;left:20%;"
divs[2]["style"] = "width:10%;height:10%;position:absolute;top:12%;left:30%;"
divs[3]["style"] = "width:10%;height:10%;position:absolute;top:12%;left:40%;"
divs[4]["style"] = "width:10%;height:10%;position:absolute;top:12%;left:50%;"
divs[5]["style"] = "width:10%;height:10%;position:absolute;top:12%;left:60%;"
divs[6]["style"] = "width:10%;height:10%;position:absolute;top:12%;left:70%;"
divs[7]["style"] = "width:10%;height:10%;position:absolute;top:12%;left:80%;"
divs[8]["style"] = "width:40%;height:50%;position:absolute;top:30%;left:5%;"
divs[9]["style"] = "width:35%;height:10%;position:absolute;top:2%;left:30%;"
divs[10]["style"] = "width:40%;height:50%;position:absolute;top:30%;left:55%;"
divs[11]["style"] = "width:90%;height:50%;position:absolute;top:90%;left:5%;"
body = html_bf.find("body")
body["style"] = "background-image: "
html_new = str(html_bf)
html.seek(0, 0)
html.truncate()
html.write(html_new)
html.close()
本文内容由网友自发贡献,版权归原作者所有,本站不承担相应法律责任。如您发现有涉嫌抄袭侵权的内容,请联系:hwhale#tublm.com(使用前将#替换为@)