善用工具
http://blog.csdn.net/aganlengzi/article/details/62893533
本文主要试用的gperftool相关介绍可见:https://github.com/gperftools/gperftools/wiki
gperftools性能分析通过抽样方法完成,默认是1秒100个样本,so,一个样本是10毫秒,即时间单位是10毫秒.
之所以要在这里特别说明,是因为需要注意到:如果程序运行时间不到10ms,那么得到的结果可能会和开始执行的时候不同.
0.系统信息
sjc@sjc-pc:~/baidu/gperftool/test$ uname -a
Linux sjc-pc 3.19.0-25-generic #26~14.04.1-Ubuntu SMP Fri Jul 24 21:16:20 UTC 2015 x86_64 x86_64 x86_64 GNU/Linux
还有就是处理器是amdx2…
1.安装文件
.
├── gperftools-2.0
├── gperftools-2.0.tar.gz
├── libunwind-0.99-beta
├── libunwind-0.99-beta.tar.gz
├── readme.txt
└── test
下载:http://pan.baidu.com/s/1jIFl1qu
2.安装过程:
2.1.gperftools在64位系统上需要unwind库的支持,所以需要先安装libunwind,而且对版本有了要求:libunwind-0.99-beta
./configure --prefix=/home/sjc/tools/gperftools -CFLAGS=-U_FORTIFY_SOURCE
NOTE: In Ubuntu 8.10 and later versions, -D_FORTIFY_SOURCE=2 is set by default, and is activated when -O is set to 2 or higher. This enables additional compile-time and run-time checks for several libc functions. To disable, specify either -U_FORTIFY_SOURCE or -D_FORTIFY_SOURCE=0.D_FORTIFY_SOURCE的级别设置越高,对overflow等的检查也更严格.
sudo make
sudo make install
以上,libunwind库会被安装到prefix指定的路径下.
2.2.编译安装gperftools-2.0:
NOTE: 之所以安装版本2.0而不是目前最新的2.5,是因为在编译2.5版本的时候,总是会出现:
undefined "_ULx86_64_getcontext"之类错误,分析后认为,gperftools库需要libunwind提供一些符号的支持,
但是在libunwind中不存在这些符号,这就尴尬了,这种尴尬的原因我猜想是2.5版本是对应更高的unwind库版本的(未验证,也可能和我自己的平台环境有关系).
顺着这个思路,将gperftool的版本降为2.0版本.
./configure --prefix=/home/sjc/tools/gperftools
sudo make
NOTE: 如果错误显示:
In function ‘void ListerThread(ListerParams*)’:
error: invalid conversion from ‘void ()(int, siginfo_t, void*)’ to ‘void ()(int, siginfo, void*)’ [-fpermissive]
修改linuxthreads.cc:static void SignalHandler(int signum, siginfo_t *si, void *data) {
为 static void SignalHandler(int signum, siginfo *si, void *data) {
编译可过.
sudo make install
NOTE: 之前忘了执行install[捂脸]第二天早上来还手动将需要的头文件和lib复制到prefix目录下,也是醉了
2.3.为了图形分析还需要安装Graphviz
用于绘制DOT语言脚本描述的图形,gperftools依靠此工具生成图形分析结果。
sudo apt-get install graphviz
以上步骤安装成功后:
sjc@sjc-pc:~/tools/gperftools$ tree -L 2
.
├── bin
│   └── pprof
├── include
│   ├── google
│   ├── gperftools
│   ├── libunwind-common.h
│   ├── libunwind-dynamic.h
│   ├── libunwind.h
│   ├── libunwind-ptrace.h
│   ├── libunwind-x86_64.h
│   └── unwind.h
├── lib
│   ├── libprofiler.a
│   ├── libprofiler.la
│   ├── libprofiler.so -> libprofiler.so.0.3.0
│   ├── libprofiler.so.0 -> libprofiler.so.0.3.0
│   ├── libprofiler.so.0.3.0
│   ├── libtcmalloc.a
│   ├── libtcmalloc_and_profiler.a
│   ├── libtcmalloc_and_profiler.la
│   ├── libtcmalloc_and_profiler.so -> libtcmalloc_and_profiler.so.4.1.0
│   ├── libtcmalloc_and_profiler.so.4 -> libtcmalloc_and_profiler.so.4.1.0
│   ├── libtcmalloc_and_profiler.so.4.1.0
│   ├── libtcmalloc_debug.a
│   ├── libtcmalloc_debug.la
│   ├── libtcmalloc_debug.so -> libtcmalloc_debug.so.4.1.0
│   ├── libtcmalloc_debug.so.4 -> libtcmalloc_debug.so.4.1.0
│   ├── libtcmalloc_debug.so.4.1.0
│   ├── libtcmalloc.la
│   ├── libtcmalloc_minimal.a
│   ├── libtcmalloc_minimal_debug.a
│   ├── libtcmalloc_minimal_debug.la
│   ├── libtcmalloc_minimal_debug.so -> libtcmalloc_minimal_debug.so.4.1.0
│   ├── libtcmalloc_minimal_debug.so.4 -> libtcmalloc_minimal_debug.so.4.1.0
│   ├── libtcmalloc_minimal_debug.so.4.1.0
│   ├── libtcmalloc_minimal.la
│   ├── libtcmalloc_minimal.so -> libtcmalloc_minimal.so.4.1.0
│   ├── libtcmalloc_minimal.so.4 -> libtcmalloc_minimal.so.4.1.0
│   ├── libtcmalloc_minimal.so.4.1.0
│   ├── libtcmalloc.so -> libtcmalloc.so.4.1.0
│   ├── libtcmalloc.so.4 -> libtcmalloc.so.4.1.0
│   ├── libtcmalloc.so.4.1.0
│   ├── libunwind.a
│   ├── libunwind-generic.a -> libunwind-x86_64.a
│   ├── libunwind-generic.so -> libunwind-x86_64.so
│   ├── libunwind.la
│   ├── libunwind-ptrace.a
│   ├── libunwind-setjmp.a
│   ├── libunwind-setjmp.la
│   ├── libunwind-setjmp.so -> libunwind-setjmp.so.0.0.0
│   ├── libunwind-setjmp.so.0 -> libunwind-setjmp.so.0.0.0
│   ├── libunwind-setjmp.so.0.0.0
│   ├── libunwind.so -> libunwind.so.7.0.0
│   ├── libunwind.so.7 -> libunwind.so.7.0.0
│   ├── libunwind.so.7.0.0
│   ├── libunwind-x86_64.a
│   ├── libunwind-x86_64.la
│   ├── libunwind-x86_64.so -> libunwind-x86_64.so.7.0.0
│   ├── libunwind-x86_64.so.7 -> libunwind-x86_64.so.7.0.0
│   ├── libunwind-x86_64.so.7.0.0
│   └── pkgconfig
└── share
    ├── doc
    └── man
注意到bin路径下是有一个pprof工具的,这是后面分析数据的时候需要使用.
方便起见,可以将它添加到系统变量中:
vi /etc/profile
export PATH="$PATH:/home/sjc/tools/gperftools/bin/"
source /etc/profile
NOTE: 这里的pprof实际上是一个perl脚本,需要在环境中安装perl.除此之外,这个pprof(gperftools-2.0中编译生成的)是有问题的…和版本有关,使用gperftools-2.5版本的pprof是没有问题的.
所以经过一些尝试后,我将gperftools-2.5编译出来的pprof替换了这个pprof.
3.使用
下面就是使用它的profiler了,我想要使用的是分析程序中的热点函数,看是不是能进行优化处理.
NOTE: 初衷是看到milo大神的json教程说程序优化中的分析情况.
使用的方法有多种:
1.可以直接调用提供的API(在需要测试的代码的前后分别调用ProfilerStart()和ProfilerStop())
2.可以以静态链接方式进行链接并在执行的时候通过环境变量指定分析文件的输出路径:
CPUPROFILE=file/path ./myprogram
3.动态链接方式,这种方式一般不使用。
下文使用的是第一种方式:第二种方式也可以使用下面的代码,只需要将代码中关于gperftool相关的内容去掉,并且在执行的时候指定环境变量的值就可以了。
sjc@sjc-pc:~/baidu/gperftool/test$ tree -L 1
.
├── build
├── CMakeLists.txt
└── test.cpp
test.cpp:
#include <google/profiler.h>
void test1() {
int i = 0;
while (i < 1000) i++;
}
void test2() {
int i = 0;
while (i < 2000) i++;
}
void test3() {
for (int i = 0; i < 100000; ++i){
test1();
test2();
}
}
int main() {
ProfilerStart("test.prof");
test3();
ProfilerStop();
return 0;
}
CMakeLists.txt:
cmake_minimum_required(VERSION 2.8)
project (testperf)
ADD_EXECUTABLE(testperf test.cpp)
INCLUDE_DIRECTORIES(/home/sjc/tools/gperftools/include)
FIND_LIBRARY(PTHREAD_LIB NAMES pthread PATHS "/usr/lib/x86_64-linux-gnu/")
MESSAGE(STATUS "Library path PTHREAD_LIB is " ${PTHREAD_LIB})
FIND_LIBRARY(UNWIND_LIB NAMES unwind PATHS "/home/sjc/tools/gperftools/lib/")
MESSAGE(STATUS "Library path UNWIND_LIB is " ${UNWIND_LIB})
FIND_LIBRARY(PROFILER_LIB NAMES profiler PATHS "/home/sjc/tools/gperftools/lib/")
MESSAGE(STATUS "Library path PROFILER_LIB is " ${PROFILER_LIB})
TARGET_LINK_LIBRARIES(testperf ${PTHREAD_LIB})
TARGET_LINK_LIBRARIES(testperf ${UNWIND_LIB})
TARGET_LINK_LIBRARIES(testperf ${PROFILER_LIB})
SET(EXECUTABLE_OUTPUT_PATH ${PROJECT_BINARY_DIR}/bin)
编译:
sjc@sjc-pc:~/baidu/gperftool/test$ mkdir build
sjc@sjc-pc:~/baidu/gperftool/test$ cd build
sjc@sjc-pc:~/baidu/gperftool/test/build$ cmake ..
sjc@sjc-pc:~/baidu/gperftool/test/build$ make
sjc@sjc-pc:~/baidu/gperftool/test/build$ cd bin
sjc@sjc-pc:~/baidu/gperftool/test/build/bin$ ls
testperf  test.prof
sjc@sjc-pc:~/baidu/gperftool/test/build/bin$ ./testperf
PROFILE: interrupts/evictions/bytes = 68/22/1936
sjc@sjc-pc:~/baidu/gperftool/test/build/bin$ pprof --text ./testperf test.prof > test.txt
Using local file ./testperf.
Using local file test.prof.
Removing _L_unlock_13 from all stack traces.
sjc@sjc-pc:~/baidu/gperftool/test/build/bin$ pprof --pdf ./testperf test.prof > test.pdf
Using local file ./testperf.
Using local file test.prof.
Removing _L_unlock_13 from all stack traces.
sjc@sjc-pc:~/baidu/gperftool/test/build/bin$ tree -L 1
.
├── test.pdf
├── testperf
├── test.prof
└── test.txt
sjc@sjc-pc:~/baidu/gperftool/test/build/bin$ cat test.txt
Total: 68 samples
      42  61.8%  61.8%       42  61.8% test2
      26  38.2% 100.0%       26  38.2% test1
       0   0.0% 100.0%       68 100.0% __libc_start_main
       0   0.0% 100.0%       68 100.0% _start
       0   0.0% 100.0%       68 100.0% main
       0   0.0% 100.0%       68 100.0% test3
上面文本中输出的内容是对程序中每一个函数的CPU使用时间分析
总体来看,总共有68个时间样本,每个样本时间是10ms,其中test1和test2分别占了26和42样本时间,
即260ms和420ms.
数据有两大列:
左:不包含内部其他函数调用所消耗的CPU时间(内联函数除外)如果函数内部没有任何调用,那么就和右列相等
右:整个函数消耗的CPU时间,包括函数内部其他函数调用所消耗的CPU时间
每行按照数据顺序:
1 分析样本数量(不包含其他函数调用)
2 分析样本百分比(不包含其他函数调用)
3 目前为止的分析样本百分比(不包含其他函数调用)
4 分析样本数量(包含其他函数调用)
5 分析样本百分比(包含其他函数调用)
6 函数名
不是太好懂.可以结合pdf生成的图来看比较好懂:
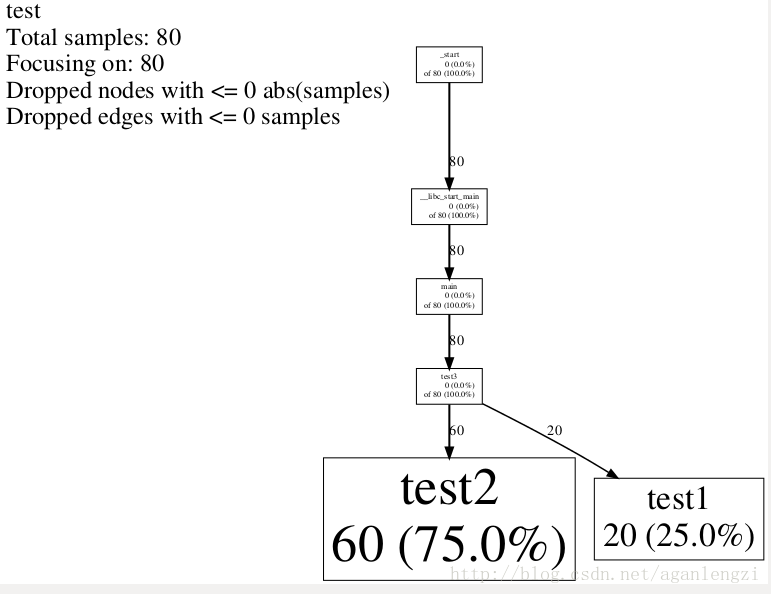
图形风格输出结果中:
每个节点代表一个函数,节点数据格式:
Class Name
Method Name
local (percentage) #不包含内部其他函数调用所消耗的CPU时间(内联函数除外)
of cumulative (percentage) #整个函数消耗的CPU时间,包括函数内部其他函数调用所消耗的CPU时间,如果与local相同,则不打印
有向边由调用者指向被调用者,有向边上的时间表示被调用者所消耗的CPU时间
还可以配合Kcachegrind使用:
只要利用pprof生成callgrind格式的文件即可:
pprof --callgrind ./myprogram xxx.prof > xxx.callgrind
然后使用Kcachegrind打开就可以了。
安装Kcachegrind在ubuntu下比较简单:
sudo apt-get install kcachegrind
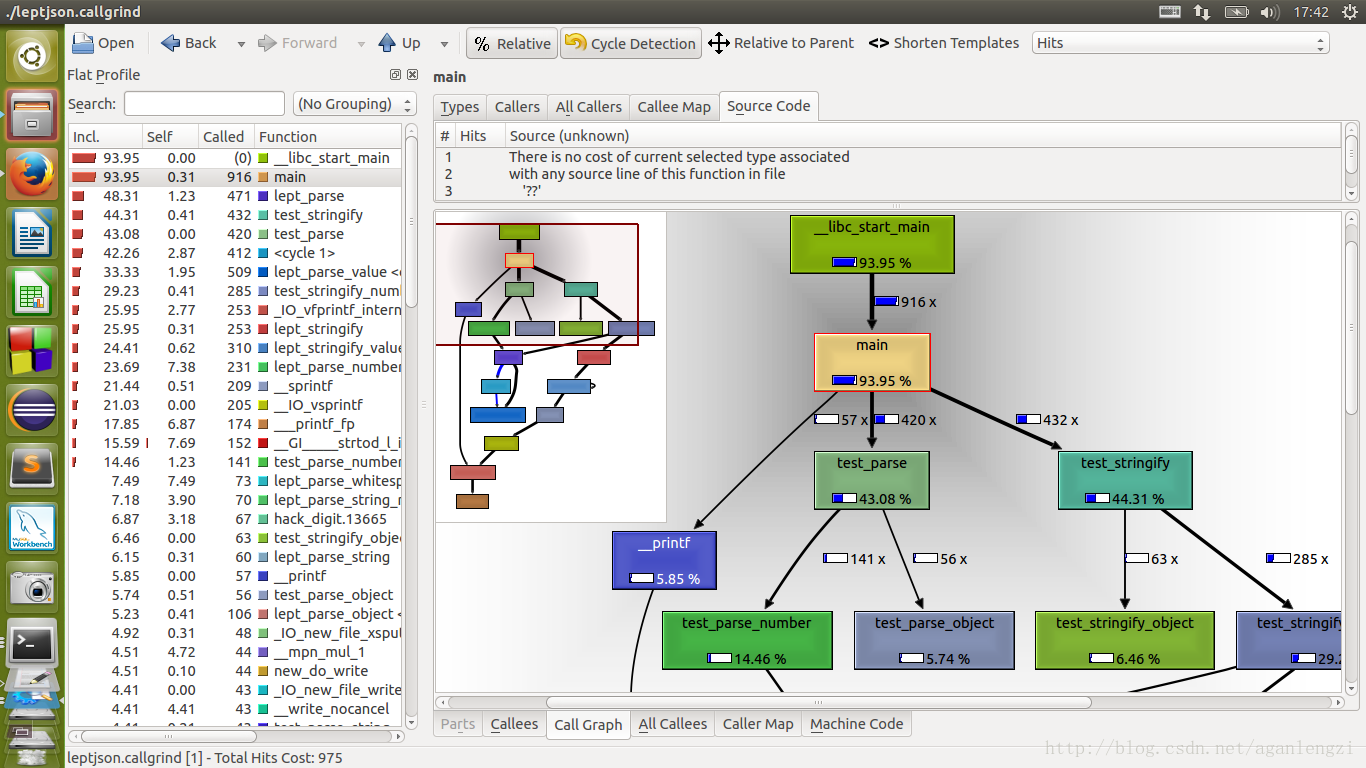
注:这是另一个程序分析结果。
注意:
1.如果程序的执行时间太短,比如说像我以为挺大的一个程序结果执行时间是这样的:
sjc@sjc-pc:~$ time ./myprogram
PROFILE: interrupts/evictions/bytes = 0/0/64
real    0m0.010s
user    0m0.008s
sys     0m0.000s
上面说了gperftools的采样时间是10ms,程序总共执行的时间是10ms,所以出现这样的结果是正常的.
对于这类比较小的程序,可以采用的测量方式是,不断重复执行多次…
2.如果是server上的程序,启动后一般不会主动退出(即使退出,也一般不会正常退出,而gperftools必须在程序正常退出的情况下才能够正常收集或者收集完整profile数据),对这类程序进行测量,可以使用信号和信号处理函数完成。
在网上看到有使用SIGUSR1和SIGUSR2分别进行ProfilerStart()和ProfilerStop()函数调用的,略有修改,贴在下面:
sjc@sjc-pc:~/baidu/gperftool/test-server$ tree -L 1
.
├── build
├── CMakeLists.txt
└── test-server.cpp
test-server.cpp:
#include <stdio.h>
#include <sys/types.h>
#include <unistd.h>
#include <signal.h>
#include <google/profiler.h>
static void gprof_callback(int signum) {
if (signum == SIGUSR1) {
printf("Catch the signal ProfilerStart\n");
ProfilerStart("bs.prof");
}
else if (signum == SIGUSR2) {
printf("Catch the signal ProfilerStop\n");
ProfilerStop();
}
}
static void setup_signal() {
struct sigaction profstat;
profstat.sa_handler = gprof_callback;
profstat.sa_flags = 0;
sigemptyset(&profstat.sa_mask);
sigaddset(&profstat.sa_mask, SIGUSR1);
sigaddset(&profstat.sa_mask, SIGUSR2);
if (sigaction(SIGUSR1, &profstat,NULL) < 0)
fprintf(stderr, "SIGUSR1 Fail !");
if (sigaction(SIGUSR2, &profstat,NULL) < 0)
fprintf(stderr, "SIGUSR2 Fail !");
}
int loopop_callee() {
int n=0;
for(int i=0; i<10000; i++)
for(int j=0; j<10000; j++)
n |= i%100 + j/100;
return n;
}
int loopop() {
int n=0;
while(1) {
for(int i=0; i<10000; i++)
for(int j=0; j<10000; j++)
n |= i%100 + j/100;
printf("result: %d\n", (loopop_callee)() );
}
return n;
}
int main(int argc,char** argv) {
setup_signal();
printf("result: %d\n", (loopop)() );
return 0;
}
CMakeLists.txt
cmake_minimum_required(VERSION 2.8)
project (testserver)
if (CMAKE_C_COMPILER_ID MATCHES "GNU|Clang")
set(CMAKE_C_FLAGS "${CMAKE_C_FLAGS} -g -ansi -pedantic -Wall")
endif()
ADD_EXECUTABLE(testserver test-server.cpp)
INCLUDE_DIRECTORIES(/home/sjc/tools/gperftools/include)
FIND_LIBRARY(UNWIND_LIB NAMES unwind PATHS "/home/sjc/tools/gperftools/lib/")
MESSAGE(STATUS "Library path UNWIND_LIB is " ${UNWIND_LIB})
FIND_LIBRARY(PROFILER_LIB NAMES profiler PATHS "/home/sjc/tools/gperftools/lib/")
MESSAGE(STATUS "Library path PROFILER_LIB is " ${PROFILER_LIB})
TARGET_LINK_LIBRARIES(testserver ${UNWIND_LIB})
TARGET_LINK_LIBRARIES(testserver ${PROFILER_LIB})
SET(EXECUTABLE_OUTPUT_PATH ${PROJECT_BINARY_DIR}/bin)
测试过程:
启动./testserver
ps -ef | grep “testserver” 得到testserver pid
kill -s SIGUSR1 $pid
kill -s SIGUSR2 $pid
github:
https://github.com/lengzizgnel/gperftools-demo/
参考
[1] http://www.cnblogs.com/GODYCA/archive/2013/05/28/3104281.html
本文内容由网友自发贡献,版权归原作者所有,本站不承担相应法律责任。如您发现有涉嫌抄袭侵权的内容,请联系:hwhale#tublm.com(使用前将#替换为@)