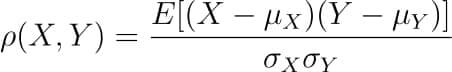
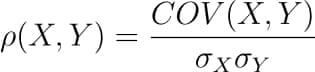
It is defined as the covariance between two variables divided by the product of the standard deviations of the two variables.
Where the covariance between X and Y COV(X, Y) is further defined as the ‘expected value of the product of the deviations of X and Y from their respective means’.
The formula for covariance would make it clearer.
So the formula for Pearson’s correlation would then become:
The value of ρ lies between -1 and +1.
Values nearing +1 indicate the presence of a strong positive relation between X and Y, whereas those nearing -1 indicate a strong negative relation between X and Y.
Values near to zero mean there is an absence of any relationship between X and Y.
求给定数据的相关矩阵
让我们生成两个变量的随机数据,然后为它们构建相关矩阵。
import numpy as np
np.random.seed(10)
# generating 10 random values for each of the two variables
X = np.random.randn(10)
Y = np.random.randn(10)
# computing the corrlation matrix
C = np.corrcoef(X,Y)
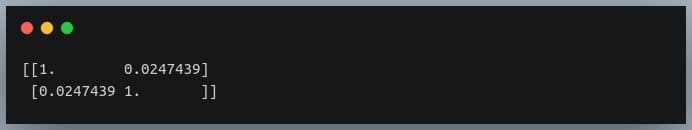
print(C)
Output:
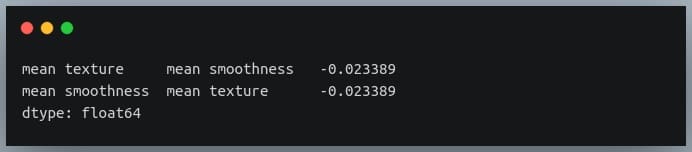
Since we compute the correlation matrix of 2 variables, its dimensions are 2 x 2.
The value 0.02 indicates there doesn’t exist a relationship between the two variables. This was expected since their values were generated randomly.
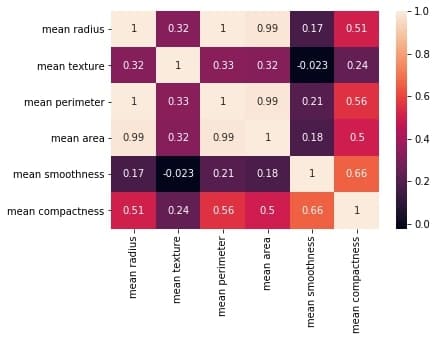
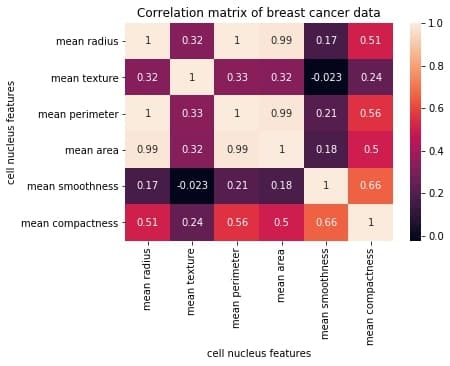
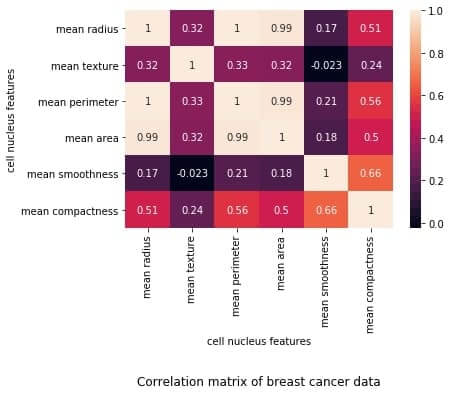
Let’s first reproduce the matrix generated in the earlier section and then discuss it.
You must keep the following points in mind with regards to the correlation matrices such as the one shown above:
网格中的每个单元格代表两个变量之间的相关系数的值。
(a,b)位置的值表示a行和b列的特征之间的相关系数。这将等于位置 (b, a) 处的值
It is a square矩阵——每一行代表一个变量,所有列代表与行相同的变量,因此行数 = 列数。
It is a 对称的矩阵——这是有道理的,因为 a,b 之间的相关性与 b, a 之间的相关性相同。
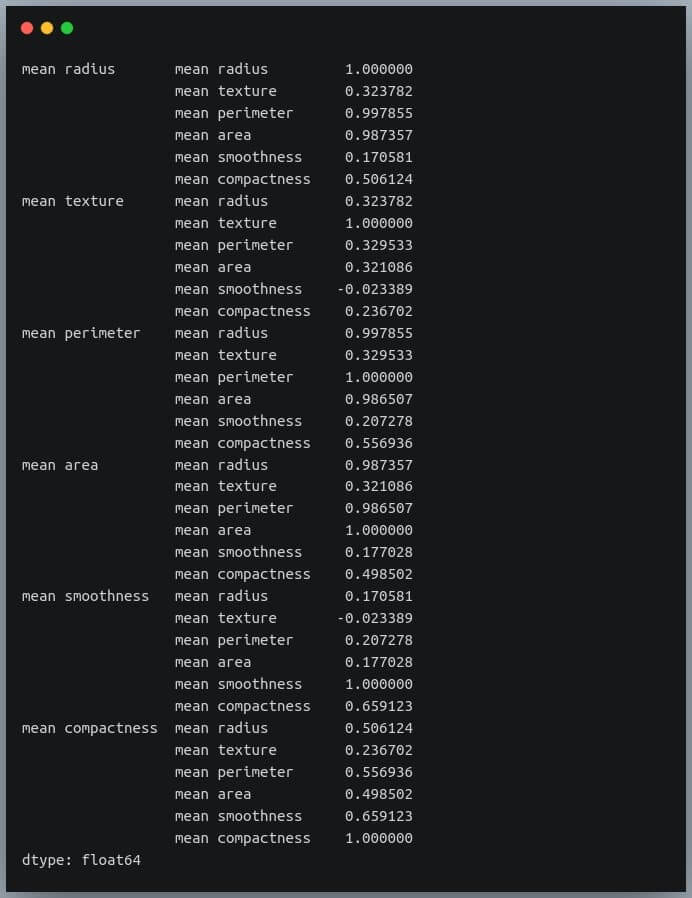
Output:
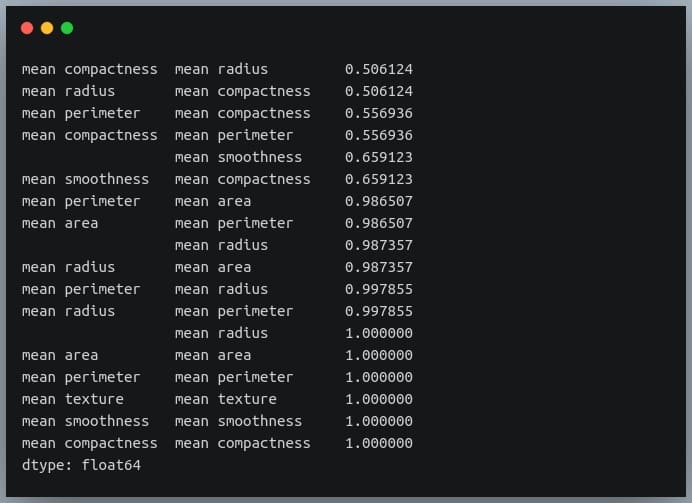
The unstack method on the Pandas DataFrame returns a Series with MultiIndex.That is, each value in the Series is represented by more than one indices, which in this case are the row and column indices that happen to be the feature names.
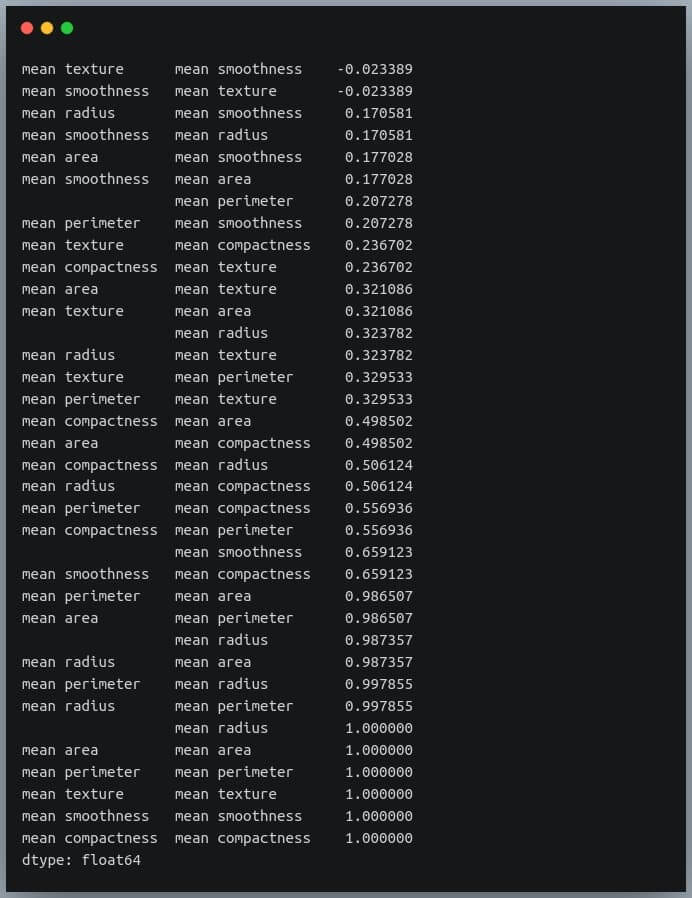
Output:
We can see each value is repeated twice in the sorted output. This is because our correlation matrix was a symmetric matrix, and each pair of features occurred twice in it.
We have seen the relationship between the covariance and correlation between a pair of variables in the introductory sections of this blog.
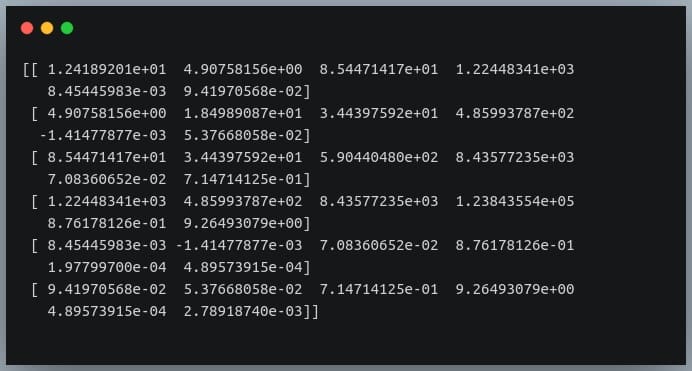
Let us understand how we can compute the covariance matrix of a given data in Python and then convert it into a correlation matrix. We’ll compare it with the correlation matrix we had generated using a direct method call.
Output:
We’re passing the transpose of the matrix because the method expects a matrix in which each of the features is represented by a row rather than a column.
所以我们的分子是正确的。 现在我们需要计算一个 6×6 矩阵,其中 i、j 处的值是位置 i 和 j 处特征的标准差的乘积。
然后,我们将协方差矩阵除以该标准差矩阵来计算相关矩阵。
让我们首先构建标准差矩阵。
#compute standard deviations of each of the 6 features
stds = np.std(df_small, axis = 0) #shape = (6,)
stds_matrix = np.array([[stds[i]*stds[j] for j in range(6)] for i in range(6)])
print("standard deviations matrix of shape:",stds_matrix.shape)
Output:
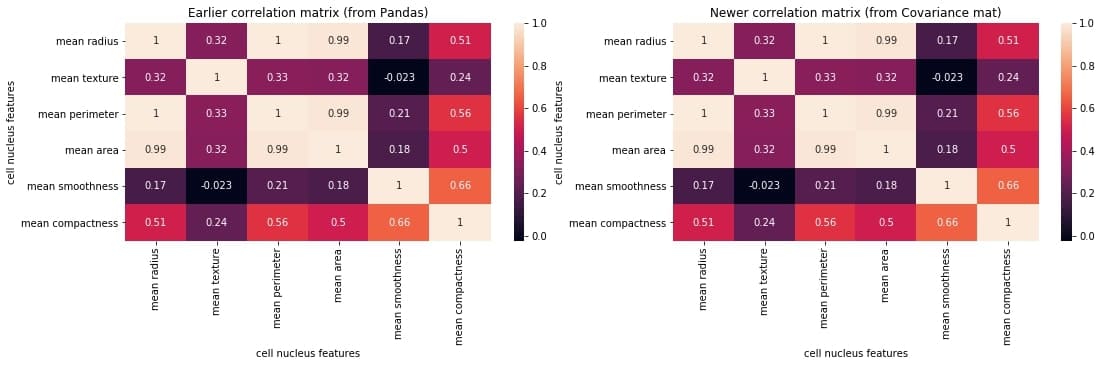
Now that we have the covariance matrix of shape (6,6) for the 6 features, and the pairwise product of features matrix of shape (6,6), we can divide the two and see if we get the desired resultant correlation matrix.