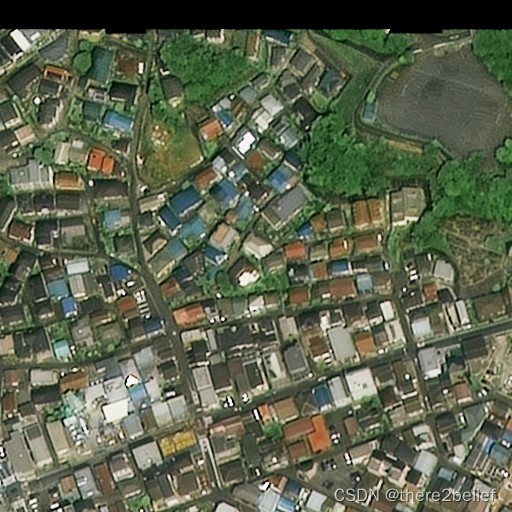
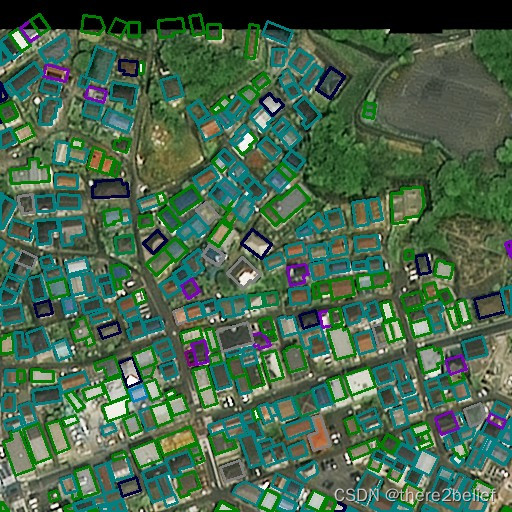
使用pycocotools读取和opencv绘制,实现COCO格式数据边框显示的可视化,可视化前后的示例为:
代码:
# -*- coding: utf-8 -*-
import os
import sys, getopt
from pycocotools.coco import COCO, maskUtils
import cv2
import numpy as np


def voc_colormap(N=256):
    def bitget(val, idx):
        return ((val & (1 << idx)) != 0)

    # cmap = np.zeros((N, 3), dtype=np.uint8)
    cmap = []
    for i in range(N):
        r = g = b = 0
        c = i
        for j in range(8):
            r |= (bitget(c, 0) << 7 - j)
            g |= (bitget(c, 1) << 7 - j)
            b |= (bitget(c, 2) << 7 - j)
            c >>= 3
        print([r, g, b])
        # cmap[i, :] = [r, g, b]
        color = tuple([int(x) for x in [r, g, b]])
        cmap.append(color)
    return cmap


def mkdir_os(path):
    if not os.path.exists(path):
        os.makedirs(path)


def main(argv):
    color_map = voc_colormap()

    inputfile = ''
    jsonfile = ''
    outputfile = ''

    try:
        opts, args = getopt.getopt(argv, "hi:j:o:", ["ifile=", "jfile=", "ofile="])
    except getopt.GetoptError:
        print('test.py -i <inputfile> -j <jsonfile> -o <outputfile>')
        sys.exit(2)
    for opt, arg in opts:
        if opt == '-h':
            print('test.py -i <inputfile> -j <jsonfile> -o <outputfile>')
            sys.exit()
        elif opt in ("-i", "--ifile"):
            inputfile = arg
        elif opt in ("-j", "--jfile"):
            jsonfile = arg
        elif opt in ("-o", "--ofile"):
            outputfile = arg

    print('\n输入的文件为:', inputfile)
    print('\n输入的json为:', jsonfile)
    print('\n输出的文件为:', outputfile)

    mkdir_os(outputfile)

    coco = COCO(jsonfile)
    catIds = coco.getCatIds(catNms=['wires'])  # catIds=1 表示人这一类
    imgIds = coco.getImgIds(catIds=catIds)  # 图片id,许多值
    for i in range(len(imgIds)):
        if i % 100 == 0:
            print(i, "/", len(imgIds))
        img = coco.loadImgs(imgIds[i])[0]

        cvImage = cv2.imread(os.path.join(inputfile, img['file_name']), -1)

        annIds = coco.getAnnIds(imgIds=img['id'], catIds=catIds, iscrowd=None)
        anns = coco.loadAnns(annIds)

        polygons = []
        color = []
        for ann in anns:
            if 'segmentation' in ann:
                if type(ann['segmentation']) == list:
                    # polygon
                    for seg in ann['segmentation']:
                        poly = np.array(seg).reshape((int(len(seg) / 2), 2))
                        # poly_list = poly.tolist()
                        poly_list = poly.reshape((-1, 1, 2))
                        polygons.append(poly_list)
                        color.append(color_map[ann['category_id']])
                        # if ann['iscrowd'] == 0:
                        #     color.append([0, 0, 255])
                        # if ann['iscrowd'] == 1:
                        #     color.append([0, 255, 255])
                else:
                    # RLE
                    t = imgIds[ann['image_id']]
                    if type(ann['segmentation']['counts']) == list:
                        rle = maskUtils.frPyObjects([ann['segmentation']], t['height'], t['width'])
                    else:
                        rle = [ann['segmentation']]
                    m = maskUtils.decode(rle)
                    m = np.ascontiguousarray(np.squeeze(m).astype(np.uint8))
                    contours, _ = cv2.findContours(m, cv2.RETR_EXTERNAL, cv2.CHAIN_APPROX_SIMPLE)

                    for i in range(len(contours)):
                        poly_list = contours[i]
                        polygons.append(poly_list)
                        color.append(color_map[ann['category_id']])

                    # if ann['iscrowd'] == 0:
                    #     color_mask = np.array([0, 0, 255])
                    # if ann['iscrowd'] == 1:
                    #     color_mask = np.array([0, 255, 255])
                    #
                    # mask = m.astype(np.bool)
                    # cvImage[mask] = cvImage[mask] * 0.7 + color_mask * 0.3

        point_size = 2
        thickness = 2
        for key in range(len(polygons)):
            ndata = polygons[key]
            cur_color = color[key]
            cv2.polylines(cvImage, [ndata], isClosed=True, color=cur_color, thickness=thickness)
        cv2.imwrite(os.path.join(outputfile, img['file_name']), cvImage)


if __name__ == "__main__":
    main(sys.argv[1:])
本文内容由网友自发贡献,版权归原作者所有,本站不承担相应法律责任。如您发现有涉嫌抄袭侵权的内容,请联系:hwhale#tublm.com(使用前将#替换为@)