从 Apache IoTDB 0.13.0 版本开始,我们引入了系统监控模块,可以完成对 Apache IoTDB 的重要运行指标进行监控,本文介绍了如何在 Apache IoTDB 分布式开启系统监控模块,并且使用 Prometheus + Grafana 的方式完成对系统监控指标的可视化。
本文在一台机器上启动 1 个 ConfigNode 和 1 个 DataNode 来搭建最简单的 Apache IoTDB 分布式集群,后续可以根据自己的需求调整 ConfigNode 和 DataNode 的数量,相关的配置是类似的。本文搭建的集群的基本配置信息如下表所示:
apache-iotdb-1.0.0-all-bin
conf/iotdb-confignode.properties
cn_metric_reporter_list=PROMETHEUS
cn_metric_level=IMPORTANT
cn_metric_prometheus_reporter_port=9091
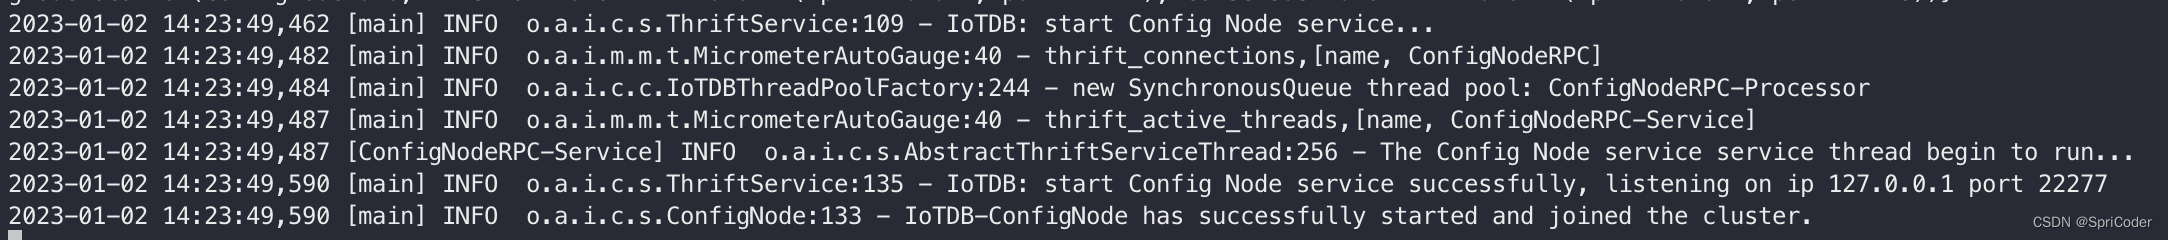
./sbin/start-confignode.sh
conf/iotdb-datanode.properties
dn_metric_reporter_list=PROMETHEUS
dn_metric_level=IMPORTANT
dn_metric_prometheus_reporter_port=9093
./sbin/start-datanode.sh
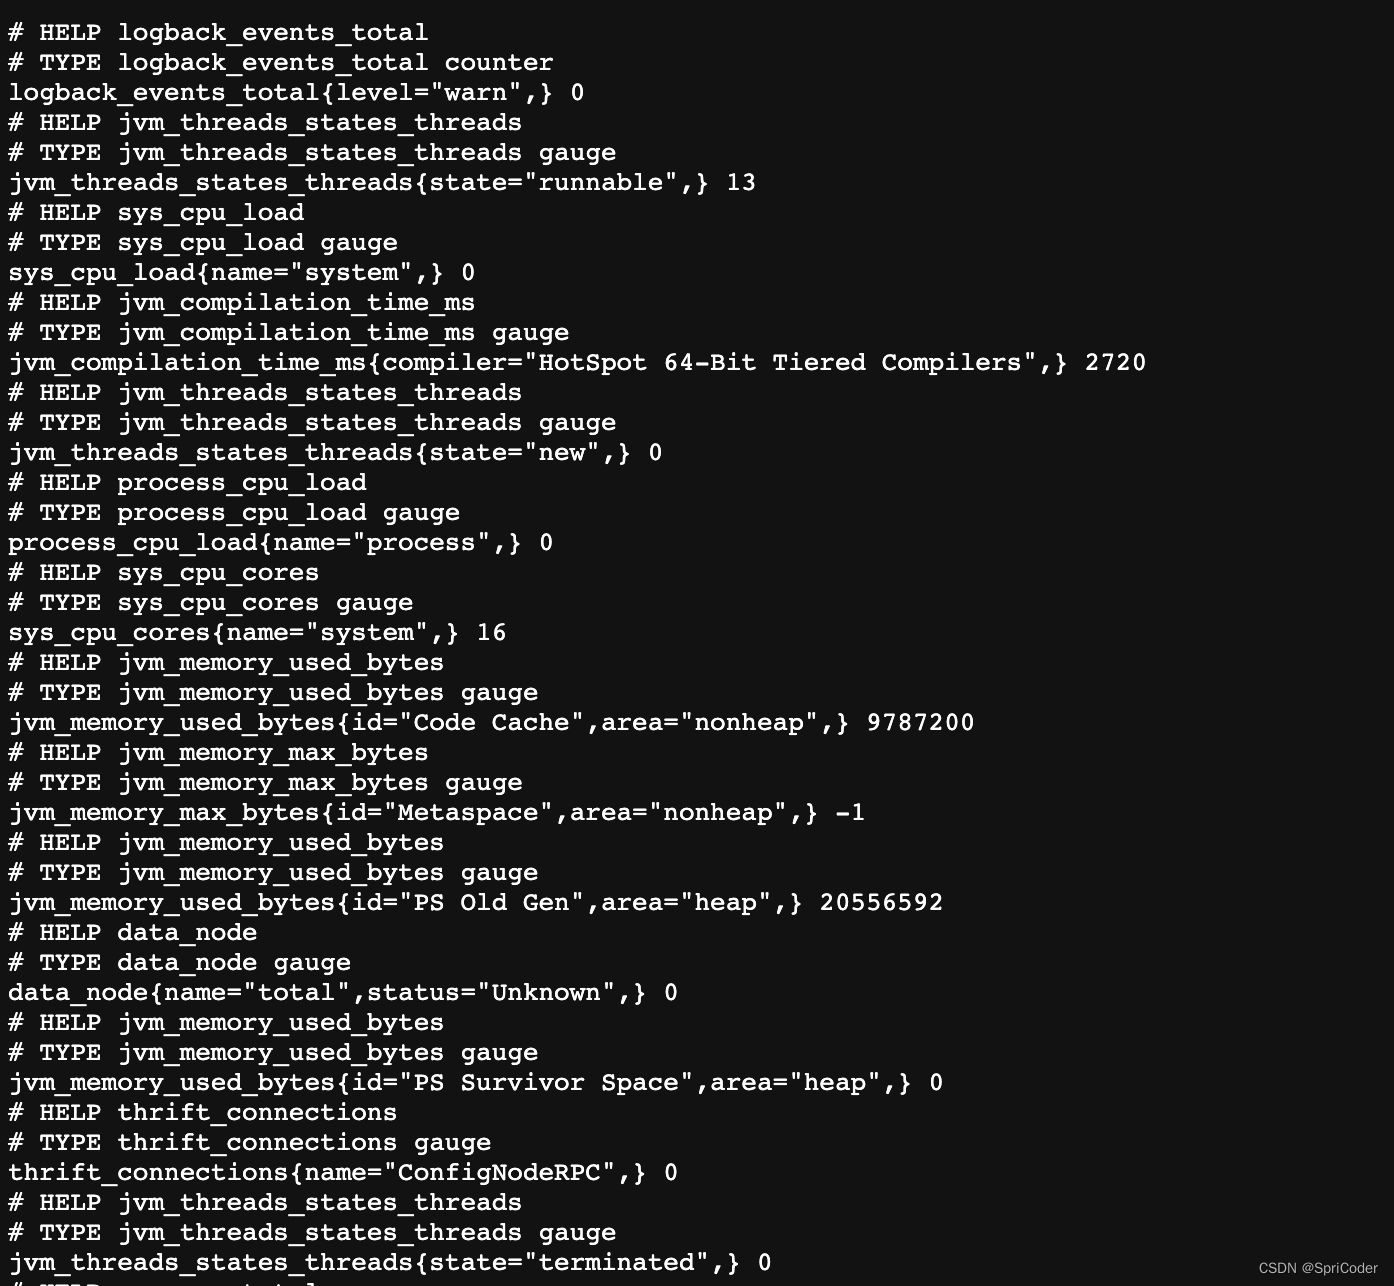
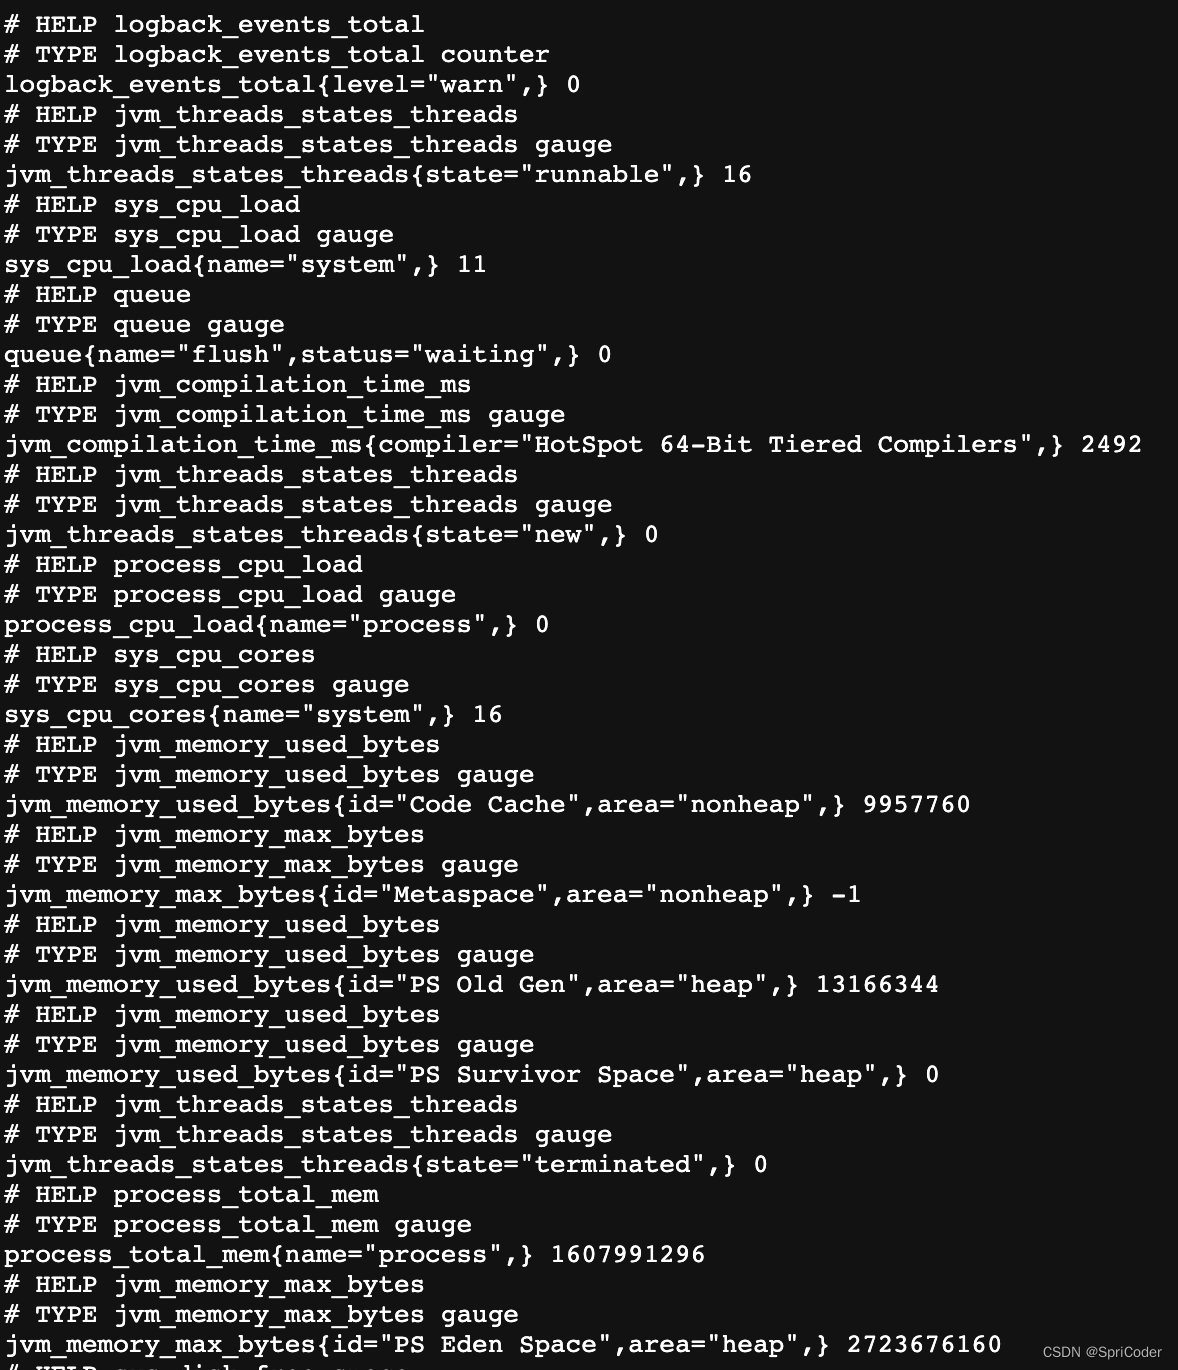
http://localhost:9093/metrics
tar xvfz prometheus-*.tar.gz
cd prometheus-*
global:
  scrape_interval: 15s

scrape_configs:
  - job_name: "prometheus"
    static_configs:
    - targets: ["localhost:9090"]
  - job_name: "confignode"
    static_configs:
    - targets: ["localhost:9091"]
    honor_labels: true
  - job_name: "datanode"
    static_configs:
    - targets: ["localhost:9093"]
    honor_labels: true
./prometheus --config.file=prometheus.yml
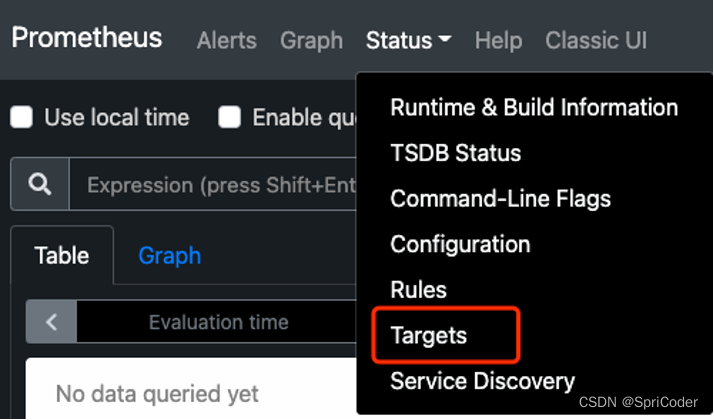
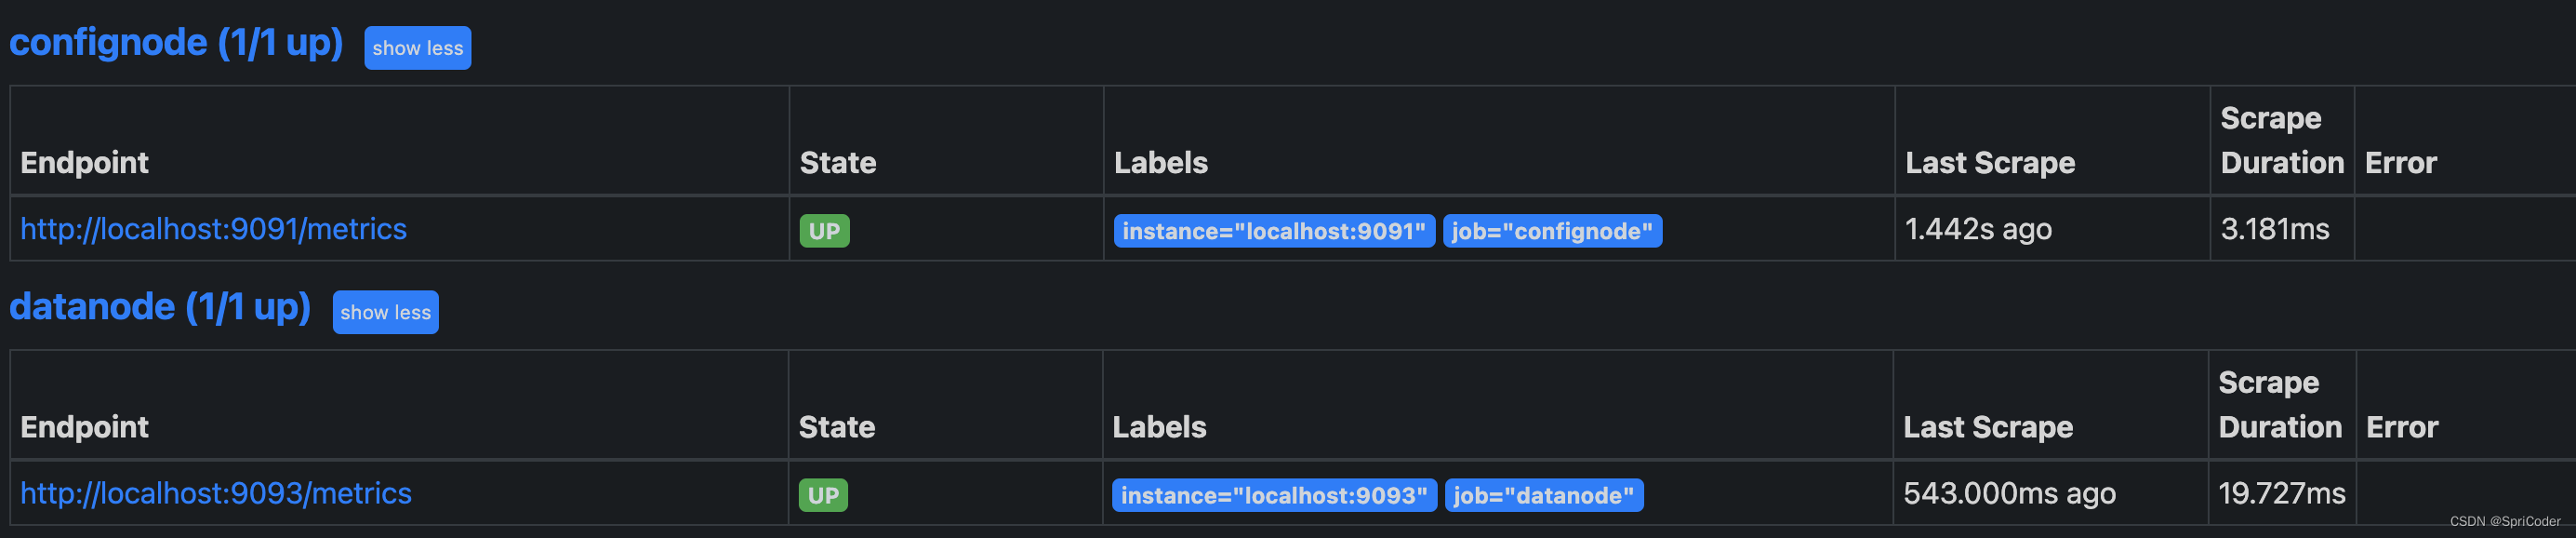
6. 当我们看到如下图State均为Up时表示配置成功并已经联通,点击左侧链接可以跳转到网页监控。
tar -zxvf grafana-*.tar.gz
cd grafana-*
./bin/grafana-server web
中文用户手册