问题
在做二分类问题时候,有正样本和负样本。构建的算法,针对每个样本会输出一个分数值。假设该分数大小为[0, 1]区间内的值。有时候单纯地以分数0.5位阈值划分样本为预测为1或者预测为0,效果有时候并不好,此时如何确定很好的阈值分数呢?答案是可以利用roc曲线来确定比较好的划分阈值。
ROC曲线介绍
二分类过程,设定阈值,大于该分数为1,小于该分数为0,统计计算TP, FN, FP,TN等数据计算FPR,TPR
- p(positive): 标签1
- n(negative): 标签0
- t(true): 预测正确
- f(false): 预测错误
- TP: 实例是正类并被预测成正类 正确预测正类(把正类预测正类)
- FP:实例是负类并被预测成正类 错误预测正类(把负类预测为正类)
- TN:实例是负类并被预测成负类 正确预测负类(把负类预测为负类)
- FN:实例是正类并被预测为负类 错误预测负类 (把正类预测为负类)
        |          -      |     实际表现           |
        ---------------------------------------------------
        |                |      1        0       |   合计
        |--------------------------------------------------
        |           | 1  |     11(TP)    01(FP)  |   TP+FP
        | 预测表现   |    |                       |
        |           |  0 |     10(FN)    00(TN)  |   FN+TN
        | ----------------------------------------------------------
        |   合计        |       TP+FN      FP+TN |  TP + FP + FN + TN
        -------------------------------------------------------------
-
真正类率(TPR):TPR = TP/(TP+FN) 刻画的是分类器所识别出的 正实例占所有正实例的比例 灵敏度
-
负正类率(FPR): FPR = FP/(FP+TN) 计算的是分类器错认为正类的负实例占所有负实例的比例 1-特异度
-
真负类率(TNR): TNR = TN/(FP+TN) = 1-FPR 分类器所识别出的负实例占所有负实例的比例 特异度
-
准确率: accuracy = (TP+TN) / (TP+TN+FP+FN) 准确率的定义是预测正确的结果占总样本的百分比, 样本不均衡时候不好
-
精准率: precision = TP / (TP+FP) 所有被预测为正的样本中实际为正的样本的概率
-
召回率(查全率): recall = TP / (TP+FN) 在实际为正的样本中被预测为正样本的概率
-
P-R曲线:查准率-查全率, 希望查准率和查全率同时高,但不现实
-
F1分数均衡:F1_score = (2pr)/(p+r)
-
ROC曲线: 横坐标FPR, 纵坐标TPR
代码实现
两种方式:
import sys
import numpy as np
from sklearn import metrics
from sklearn.metrics import auc
import matplotlib.pyplot as plt
class DrawRoc(object):
def __init__(self):
pass
def draw_roc(self, predict_scores: list, ture_labelsi: list) -> float:
"""二分类过程,设定阈值,大于该分数为1,小于该分数为0,统计计算TP, FN, FP,TN等数据
计算FPR,TPR
p(positive): 标签1
n(negative): 标签0
t(true): 预测正确
f(false): 预测错误
TP: 实例是正类并被预测成正类 正确预测正类(把正类预测正类)
FP:实例是负类并被预测成正类 错误预测正类(把负类预测为正类)
TN:实例是负类并被预测成负类 正确预测负类(把负类预测为负类)
FN:实例是正类并被预测为负类 错误预测负类 (把正类预测为负类)
-----------------------------------------
| | 实际表现 |
---------------------------------------------------
| | 1 0 | 合计
|--------------------------------------------------
| | 1 | 11(TP) 01(FP) | TP+FP
| 预测表现 | | |
| | 0 | 10(FN) 00(TN) | FN+TN
| ----------------------------------------------------------
| 合计 | TP+FN FP+TN | TP + FP + FN + TN
-------------------------------------------------------------
真正类率(TPR):TPR = TP/(TP+FN) 刻画的是分类器所识别出的 正实例占所有正实例的比例 灵敏度
负正类率(FPR): FPR = FP/(FP+TN) 计算的是分类器错认为正类的负实例占所有负实例的比例 1-特异度
真负类率(TNR): TNR = TN/(FP+TN) = 1-FPR 分类器所识别出的负实例占所有负实例的比例 特异度
准确率: accuracy = (TP+TN) / (TP+TN+FP+FN) 准确率的定义是预测正确的结果占总样本的百分比, 样本不均衡时候不好
精准率: precision = TP / (TP+FP) 所有被预测为正的样本中实际为正的样本的概率
召回率(查全率): recall = TP / (TP+FN) 在实际为正的样本中被预测为正样本的概率
P-R曲线:查准率-查全率, 希望查准率和查全率同时高,但不现实
F1分数均衡:F1_score = (2*p*r)/(p+r)
ROC曲线: 横坐标FPR, 纵坐标TPR
"""
ths = list(np.linspace(0, 1, 100))
tprs = []
fprs = []
diffs = []
auc = 0
for th in ths:
tp = 0
tn = 0
fp = 0
fn = 0
predict_labels = [1 if score >= th else 0 for score in predict_scores]
length = len(predict_labels)
for idx in range(len(predict_labels)):
predict_label = predict_labels[idx]
ture_label = ture_labels[idx]
if ture_label == 1 and predict_label == 1:
tp += 1
if ture_label == 1 and predict_label == 0:
fn += 1
if ture_label == 0 and predict_label == 0:
tn += 1
if ture_label == 0 and predict_label == 1:
fp += 1
tpr = tp / (tp+fn)
fpr = fp / (fp+tn)
tprs.append(tpr)
fprs.append(fpr)
diffs.append(tpr-fpr)
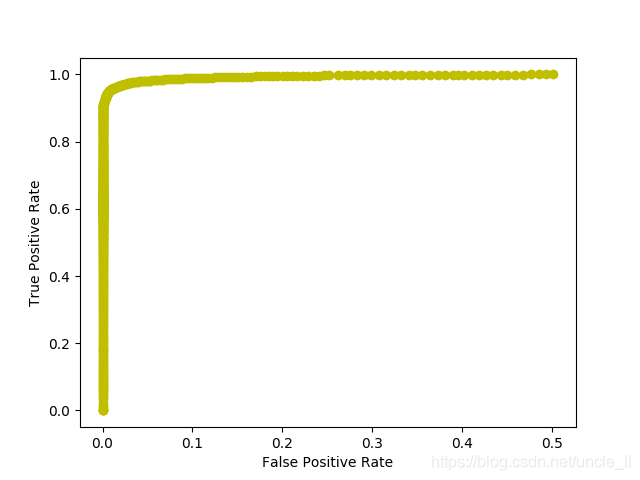
plt.plot(fprs, tprs, 'yo-')
plt.ylabel('True Positive Rate')
plt.xlabel('False Positive Rate')
plt.show()
plt.savefig('roc1.png')
"""
fprs_tprs = []
for i in range(len(ths)):
fpr = tprs[i]
tpr = fprs[i]
fprs_tprs.append([fpr, tpr])
fprs_tprs.sort(key=lambda x:x[0], reverse=False)
for i in range(1, len(ths)):
fpr, tpr = fprs_tprs[i-1]
fpr_i, tpr_i = fprs_tprs[i]
height = tpr_i
weight = fpr_i - fpr
auc += height * weight
print("auc1:", auc)
"""
max_diff = max(diffs)
optimal_idx = diffs.index(max_diff)
optimal_th = ths[optimal_idx]
return optimal_th
def draw_roc_by_sklearn(self, predict_scores: list, ture_labels: list) -> float:
score = np.array(predict_scores)
y = np.array(ture_labels)
fpr, tpr, thresholds = metrics.roc_curve(y, score)
auc = metrics.auc(fpr, tpr)
print("auc2:", auc)
optimal_idx = np.argmax(tpr - fpr)
optimal_th = thresholds[optimal_idx]
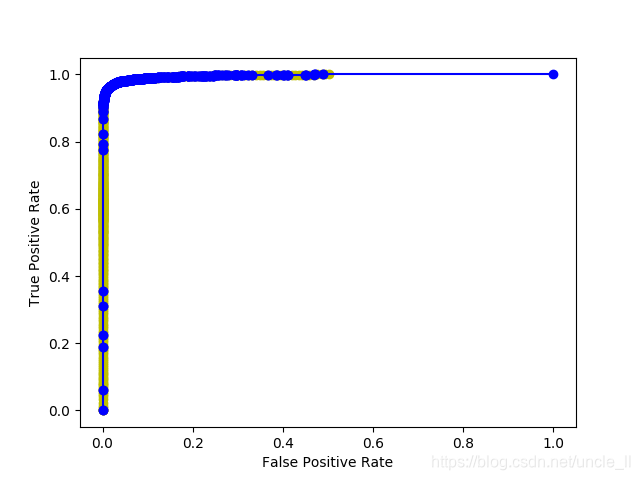
plt.plot(fpr, tpr, 'bo-')
plt.ylabel('True Positive Rate')
plt.xlabel('False Positive Rate')
plt.show()
plt.savefig('roc2.png')
return optimal_th
if __name__ == '__main__':
dr = DrawRoc()
right_scores_file = sys.argv[1]
error_scores_file = sys.argv[2]
predict_scores = []
ture_labels = []
with open(right_scores_file) as f:
for line in f:
data = line.rstrip('\n')
if data:
score = float(data)
predict_scores.append(score)
ture_labels.append(1)
with open(error_scores_file) as f:
for line in f:
data = line.rstrip('\n')
if data:
score = float(data)
predict_scores.append(score)
ture_labels.append(0)
th1 = dr.draw_roc(predict_scores, ture_labels)
print("th1:", th1)
th2 = dr.draw_roc_by_sklearn(predict_scores, ture_labels)
print("th2:", th2)
结果
- roc1
- roc2
参考
- https://blog.csdn.net/ybdesire/article/details/51999995
- https://zhuanlan.zhihu.com/p/25212301
- https://www.cnblogs.com/nxld/p/6365637.html
- https://zhuanlan.zhihu.com/p/32824418
- https://blog.csdn.net/qq_34840129/article/details/85253932
- https://www.cnblogs.com/nxld/p/6365637.html
- https://stackoverflow.com/questions/28719067/roc-curve-and-cut-off-point-python
- https://blog.csdn.net/ZYC88888/article/details/103755818
- https://zhuanlan.zhihu.com/p/46714763(推荐)
本文内容由网友自发贡献,版权归原作者所有,本站不承担相应法律责任。如您发现有涉嫌抄袭侵权的内容,请联系:hwhale#tublm.com(使用前将#替换为@)