Echarts(二、柱状图(各参数详细描述))

2023-05-16

1.jsp页面

<body>
 <div class="menutab">
             <ul>
                 <li id="zldb">质量等别监测预警</li>
             </ul>
</div>
               <!--质量等别监测预警-->
              <div class="section hide">
                   <div class="byl-bot">
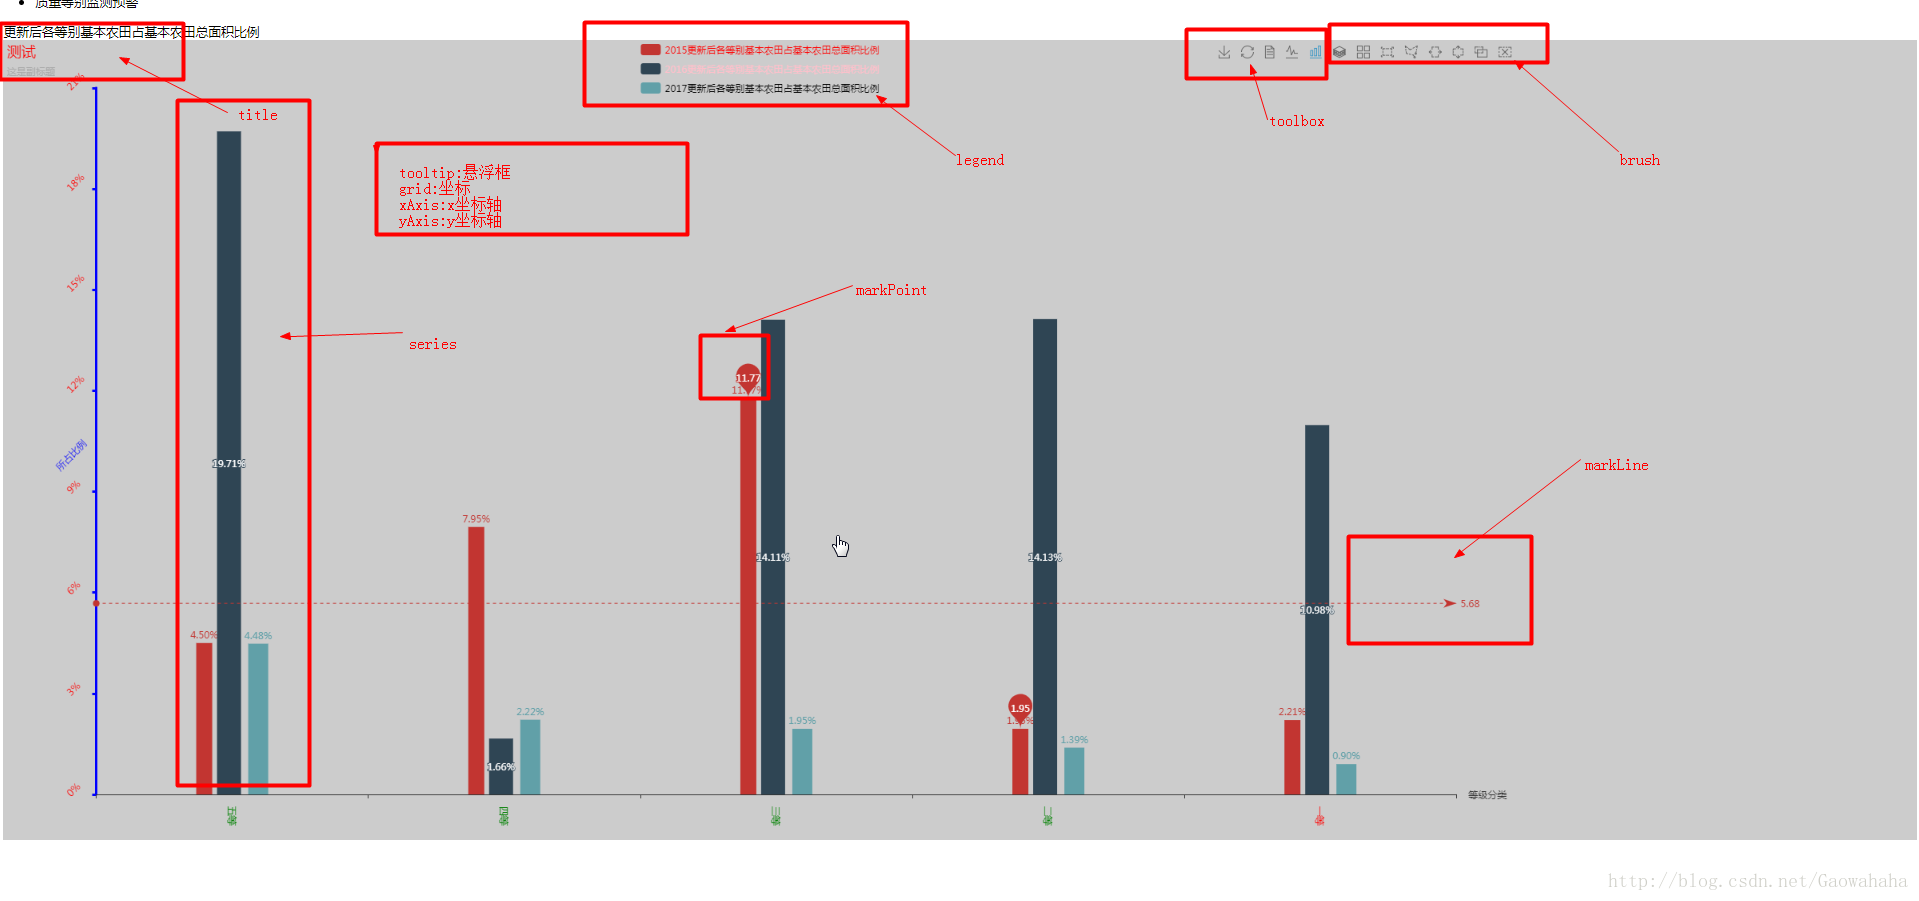
                        <div class="t">更新后各等别基本农田占基本农田总面积比例</div>
                        <div class="byl-chart">
                              <div class="totalProportion" id="qualityLevelchart" style="width:100%;height:1000px"></div>
                        </div>
                   </div>

               </div>
</body>

2.js文件

$(document).on("click","#zldb",function(){ 
//这部分表格处理数据暂时无用
     $('#qualityLevel').datagrid({
            url:null,
            pagination:false,
            nowrap:false,
            fitColumns:true,
            fit:false,
            rownumbers:true,
            height:$(window).height()-130,
            width:'100%',
            columns:[[
                        {field:'等别',title:'等别',width:70,align:'center'},
                        {field:'GXQMJ',title:'更新前面积',width:70,align:'center'},                      
                        {field:'GXHMJ',title:'更新后面积',width:70,align:'center'},
                        {field:'CYZ',title:'差异值',width:70,align:'center',
                            formatter:function(value,rowData,rowIndex){
                                  var val=rowData.GXHMJ-rowData.GXQMJ;
                                  return val.toFixed(2);
                              } 
                        },
                        {field:'BHQS',title:'变化趋势',width:70,align:'center',                         
                            formatter:function(value,rowData,rowIndex){
                                  var val=rowData.GXQMJ-rowData.GXHMJ;                                
                                  if(val>=0){
                                      return '<img src="distmap/resources/images/false.png">';
                                  }else{
                                      return '<img src="distmap/resources/images/true.png">';  
                                  }     
                              } 
                            }

                    ]],
            data:ZLDB,

        });      
    //处理数据为之后的chart展示
        var val_14=(ZLDB.rows[14].GXHMJ/99874.46*100).toString();
            val_14= val_14.substring(0,val_14.indexOf(".")+3);
        var val_13=(ZLDB.rows[13].GXHMJ/99874.46*100).toString();
            val_13= val_13.substring(0,val_13.indexOf(".")+3);
        var val_12=(ZLDB.rows[12].GXHMJ/99874.46*100).toString();
            val_12= val_12.substring(0,val_12.indexOf(".")+3);
        var val_11=(ZLDB.rows[11].GXHMJ/99874.46*100).toString();
            val_11= val_11.substring(0,val_11.indexOf(".")+3);
        var val_10=(ZLDB.rows[10].GXHMJ/99874.46*100).toString();
            val_10= val_10.substring(0,val_10.indexOf(".")+3);
        var val_9=(ZLDB.rows[9].GXHMJ/99874.46*100).toString();
            val_9= val_9.substring(0,val_9.indexOf(".")+3);
        var val_8=(ZLDB.rows[8].GXHMJ/99874.46*100).toString();
            val_8= val_8.substring(0,val_8.indexOf(".")+3);
        var val_7=(ZLDB.rows[7].GXHMJ/99874.46*100).toString();
            val_7= val_7.substring(0,val_7.indexOf(".")+3);
        var val_6=(ZLDB.rows[6].GXHMJ/99874.46*100).toString();
            val_6= val_6.substring(0,val_6.indexOf(".")+3);
        var val_5=(ZLDB.rows[5].GXHMJ/99874.46*100).toString();
            val_5= val_5.substring(0,val_5.indexOf(".")+3);
        var val_4=(ZLDB.rows[4].GXHMJ/99874.46*100).toString();
            val_4= val_4.substring(0,val_4.indexOf(".")+3);
        var val_3=(ZLDB.rows[3].GXHMJ/99874.46*100).toString();
            val_3= val_3.substring(0,val_3.indexOf(".")+3);
        var val_2=(ZLDB.rows[2].GXHMJ/99874.46*100).toString();
            val_2= val_2.substring(0,val_2.indexOf(".")+3);
        var val_1=(ZLDB.rows[1].GXHMJ/99874.46*100).toString();
            val_1= val_1.substring(0,val_1.indexOf(".")+3);
        var val_0=(ZLDB.rows[0].GXHMJ/99874.46*100).toString();
            val_0= val_0.substring(0,val_0.indexOf(".")+3);
        function test(){
            alert("这是link");
        }

        var chartDate = [val_14,val_13,val_12,val_11,val_10];
        var chartDate2 = [val_9,val_8,val_7,val_6,val_5];
        var chartDate3 = [val_4,val_3,val_2,val_1,val_0];

        // 初始化图表标签
        var myChart = echarts.init(document.getElementById('qualityLevelchart'));
        var options={
                title:{
                    show: true,
                    text: '测试',
                    link: '<a href="javascript:void(0)" onclick="test()"></a> ',
                    target: 'self',
                    textStyle: {
                        padding: 5,                     
                        color:'red',//也可以设置字体,字号等
                        fontStyle: 'normal',
                        fontWeight: 'normal',
                        fontFamily: 'sans-serif',
                        fontSize: 18,
                        z: 2,
                        backgroundColor: 'transparent',//默认透明

                    },
                    subtext: '这是副标题',
                    itemGap: 10,//控制主副标题之间的距离
                    sublink: '',
                    subtarget: 'blank',
                    padding: 5,
                    //left: 'center',
                    //top: 'auto',
                    //right: 'auto',
                    //bottom: 'auto',
                    backgroundColor: 'transparent',//'rgb(128, 60, 128)',//默认透明
                    },
            //定义一个标题
            legend:{
                type:'scroll',//scroll,可以滚动翻页的图例,一般在图例较多时使用,默认plain
                itemGap: 10,//图例之间的距离
               // data:['更新后各等别基本农田占基本农田总面积比例'],
                x:'center',//设置X就是在以x轴为参照,y则以y为参照
                orient: 'vertical',//'horizontal',//vertical,图例列表布局方向
                align:'auto',//对齐方式
                selectedMode: true,//点击图例,显示状态
                inactiveColor: '#ccc',//'green'//图例关闭时的颜色
                selected: {
                    // 选中'系列1'
                    '系列1': true,
                    // 不选中'系列2'
                    '系列2': false,            
                },
                //left: 'auto',
               // top: 'auto',
                //right: 'auto',
               // bottom: 'auto',
                width: 'auto',
                height: 'auto',
                textStyle: {
                    color: 'blue',
                    fontStyle: 'normal',
                    fontWeight: 'normal',
                    fontFamily: 'sans-serif',
                    fontSize: 12,
                    backgroundColor: 'transparent',
                    borderColor: 'transparent',
                    borderWidth: 0,
                    borderRadius: 0,
                    padding: 0,
                },
                //backgroundColor: 'pink',//背景色
                data: [{
                    name: '2015更新后各等别基本农田占基本农田总面积比例',
                  //图例项的 icon ECharts 提供的标记类型包括 'circle', 'rect', 'roundRect', 'triangle', 'diamond', 'pin', 'arrow'
                       //也可以通过 'image://url' 设置为图片,其中 url 为图片的链接,或者 dataURI。
                       //可以通过 'path://' 将图标设置为任意的矢量路径。这种方式相比于使用图片的方式,
                    //不用担心因为缩放而产生锯齿或模糊,而且可以设置为任意颜色。路径图形会自适应调整为合适的大小。
                    //路径的格式参见 SVG PathData。可以从 Adobe Illustrator 等工具编辑导出。
                    // 强制设置图形为圆。
                  // icon: 'diamond',
                    // 设置文本为红色
                    textStyle: {
                        color: 'red',
                    },
                },{
                    name: '2016更新后各等别基本农田占基本农田总面积比例',                    
                        // 设置文本为红色
                        textStyle: {
                            color: 'pink',
                        },
                    },{
                    name: '2017更新后各等别基本农田占基本农田总面积比例',                    
                        // 设置文本为红色
                        textStyle: {
                            color: 'black',
                        },
                    }],
            },
            //区域选中组件
            brush: {
                //'rect':开启矩形选框选择功能。'polygon':开启任意形状选框选择功能。'lineX':开启横向选择功能。
                //'lineY':开启纵向选择功能。'keep':切换『单选』和『多选』模式。后者可支持同时画多个选框。前者支持单击清除所有选框。'clear':清空所有选框。
                toolbox: ['rect', 'polygon', 'lineX', 'lineY', 'keep', 'clear'],
                brushStyle: {
                    borderWidth: 2,
                    color: 'rgba(0,0,0,0.2)',
                    borderColor: 'rgba(0,0,0,0.5)',
                },
                xAxisIndex: 0
            },
            //工具栏组件,一个用导出图片,数据视图,动态类型切换,数据区域缩放,重置五个工具。
            toolbox: {
                show:true,
                orient:'horizontal',//布局方向vertical,'horizontal',
                itemSize: 15,//大小
                itemGap: 10,
                showTitle: false,//是否展示title
                feature: {
                    //保存图片
                    saveAsImage: {
                        type: 'png',
                        name: '保存图片',
                        backgroundColor: 'auto',
                        excludeComponents: ['toolbox'],
                        show: true,
                        title: '保存为图片',
                        //icon: ...,
                        //iconStyle: {...},
                        pixelRatio: 1,
                        },
                        //重置
                        restore: {
                            show: true,
                            title: '还原',
                            //icon: ...,
                            //iconStyle: {...},
                            },
                            //数据视图
                            dataView: {
                                show: true,
                                title: '数据视图',
                                //icon: ...,
                              //iconStyle: {...},
                                readOnly: false,
                                lang: ['数据视图', '关闭', '刷新'],
                                backgroundColor: '#fff',
                                textareaColor: '#fff',
                                textareaBorderColor: '#333',
                                textColor: '#000',
                                buttonColor: '#c23531',
                                buttonTextColor: '#fff',
                                },
                    //动态类型切换
                    magicType: {
                        type: ['line', 'bar', 'stack', 'tiled']
                    }                  
                }
            },
            //提示框组件
            tooltip: {
                show: true,
                trigger: 'item',
                //axisPointer: {...},
                showContent: true,
                alwaysShowContent: false,
                triggerOn: 'mousemove|click',
                showDelay: 0,
                hideDelay: 100,
                enterable: false,
                confine: false,
                transitionDuration: 0.4,
                //position: ...,
                //formatter: ...,
                backgroundColor: 'green',//'rgba(50,50,50,0.7)',
                borderColor: '#333',
                borderWidth: 0,
                padding: 5,
                //textStyle: {...},
                //extraCssText: ...,
                },
          //坐标系设置
          grid: {
                left: '3%',
                right: '4%',
                bottom: '3%',
                containLabel: true
            },
            //X轴设置
            yAxis:{
                show: true,
                gridIndex: 0,//x轴所在的坐标系,默认第一个坐标系
                position:'bottom',//X轴位置bottom,top
                offset: 0,//默认位置的偏移距离,在有多个x轴时
                type: 'value',//'category',value//
                name: '所占比例',
                inverse: false,//坐标轴是否反向
                //boundaryGap: ['20%', '20%'],
                //坐标轴名称设置
                triggerEvent: false,//坐标轴是否触发事件,默认不触发,
                nameLocation: 'center',//start,center坐标名称
                nameTextStyle: {
                    color: 'blue',
                    fontStyle: 'normal',
                    fontWeight: 'normal',
                    fontFamily: 'sans-serif',
                    fontSize: 12,
                    align:'center',
                    verticalAlign: 'top',//文字垂直对齐方式,默认自动top,middle,bottom。

                },
                nameGap: 15,//坐标轴名称与轴线之间的距离
                nameRotate: 45,//坐标轴旋转角度
                //坐标轴设置
                axisLine: {
                    show: true,
                    onZero: true,
                    //onZeroAxisIndex: ...,
                    symbol: ['none','arrow'],//默认不显示箭头,即 'none'。两端都显示箭头可以设置为 'arrow',只在末端显示箭头可以设置为 ['none', 'arrow']。
                    symbolSize: [30, 50],
                    //轴线设置
                    lineStyle: {
                    color: 'blue',
                    width: 3,
                    type: 'solid',//'solid',dashed,dotted

                    //shadowBlur: ...,
                    //shadowColor: ...,
                    shadowOffsetX: 0,
                    shadowOffsetY: 0,
                    //opacity: ...,
                    },
                    },
                    //坐标轴刻度设置
                    axisTick: {
                        show: true,
                        alignWithLabel: false,
                        interval: 'auto',
                        inside: false,//坐标轴刻度是从内还是从无外
                        length: 5,//刻度长度
                        lineStyle: {
                        color: 'blue',
                        width: 3,
                        type: 'solid',
                        },
                        },                  
                    //刻度标签设置
                  axisLabel: {  
                        show: true,  
                        interval: 'auto',  
                       //formatter: '{value}%',
                        interval: 'auto',
                        inside: false,//刻度标签朝内还是朝外
                        rotate: 45,//旋转角度-90 90
                        margin: 35,//刻度标签与轴线之间的距离。
                        formatter:function(value,index){return value+"%"},
                        showMinLabel: null,
                        showMaxLabel: null,
                        color: 'red',
                        fontStyle: 'normal',
                        fontWeight: 'normal',
                        fontFamily: 'sans-serif',
                        fontSize: 12,
                        align: 'bottom',//top,middle,bottom
                       // verticalAlign: ...,
                       // lineHeight: ...,
                        backgroundColor: 'transparent',
                        borderColor: 'transparent',
                        borderWidth: 0,
                        borderRadius: 0,
                        padding: 0,
                        shadowColor: 'transparent',
                        shadowBlur: 0,
                        shadowOffsetX: 0,
                        shadowOffsetY: 0,
                      //  width: ...,
                      //  height: ...,
                        textBorderColor: 'transparent',
                        textBorderWidth: 0,
                        textShadowColor: 'transparent',
                        textShadowBlur: 0,
                        textShadowOffsetX: 0,
                        textShadowOffsetY: 0,
                  }
            },
            xAxis:{
                position:'left',//坐标轴显示位置left,right
                type : 'category',//类目轴category,数据轴value
                name: '等级分类',
                nameLocation: 'end',
                //nameTextStyle: {...},/颜色字体等设置
                nameGap: 15,
             //刻度标签设置
                  axisLabel: {  
                        show: true,  
                        interval: 'auto',  
                       //formatter: '{value}%',
                        interval: 'auto',
                        inside: false,//刻度标签朝内还是朝外
                        rotate: -90,//旋转角度-90 90
                        margin: 15,//刻度标签与轴线之间的距离。
                       // formatter:function(value,index){return value+"%"},
                        showMinLabel: null,
                        showMaxLabel: null,
                        color: 'green',
                        fontStyle: 'normal',
                        fontWeight: 'normal',
                        fontFamily: 'sans-serif',
                        fontSize: 12,
                        align: 'bottom',//top,middle,bottom               
                  },
                data:['五等','四等','三等','二等',
                  {
                    value: '一等',// 突出十五
                    textStyle: {
                       // fontSize: 20,
                        color: 'red',
                    }
                }    ] 
            },
            //name=legend.data的时候才能显示图例
            //数据设置
            series:[{
                "name":'2015更新后各等别基本农田占基本农田总面积比例',
                "type":'bar',
                "data":chartDate,
               // stack:'测试',//分类标志,将一致的在一个柱子上
                barWidth:'20',
                markPoint : {
                    data : [
                        {type : 'max', name: '最大值'},
                        {type : 'min', name: '最小值'}
                    ]
                },
                markLine : {
                    data : [
                        {type : 'average', name: '平均值'}
                    ]
                },
                //标志线
                /*markLine : {
                    lineStyle: {
                        normal: {
                            type: 'dashed'
                        }
                    },
                    data : [
                        [{type : 'min'}, {type : 'max'}]
                    ]
                },*/
                itemStyle: {
                    normal: {
                      label: {
                        show: true,
                        position: 'top',//数据在中间显示
                        formatter:'{c}%'//百分比显示
                      }
                    }
                  }
            },{
                "name":'2016更新后各等别基本农田占基本农田总面积比例',
                "type":'bar',//line,bar,pie,lines,gauge,funnel漏斗图
                "data":chartDate2,
               // stack:'测试',
                barWidth:'30',
                itemStyle: {
                    normal: {
                      label: {
                        show: true,
                        position: 'inside',//数据在中间显示
                        formatter:'{c}%'//百分比显示
                      }
                    }
                  }
            },{
                "name":'2017更新后各等别基本农田占基本农田总面积比例',
                "type":'bar',
                "data":chartDate3,
                barWidth:'25',
                itemStyle: {
                    normal: {
                      label: {
                        show: true,
                        position: 'top',//数据在中间显示
                        formatter:'{c}%'//百分比显示
                      }
                    }
                  }
            }],
           color:['#c23531','#2f4554', '#61a0a8', '#d48265', '#91c7ae','#749f83',  '#ca8622', '#bda29a','#6e7074', '#546570', '#c4ccd3'],
           backgroundColor:'#ccc',//设置背景色

        };
        myChart.setOption(options);
        myChart.on('brushselected', renderBrushed);
        myChart.on('brushselected', renderBrushed);
        //鼠标事件click:,dblclick,mousedown, mouseup,mouseover,mouseout,globalout,
        myChart.on('click', function (params) {
            alert(params.data+'---'+params.name);
        });
        function renderBrushed(params){
          console.log(params);

        }

 });

这里写图片描述

本文内容由网友自发贡献,版权归原作者所有,本站不承担相应法律责任。如您发现有涉嫌抄袭侵权的内容,请联系:hwhale#tublm.com(使用前将#替换为@)

Echarts(二、柱状图(各参数详细描述)) 的相关文章

随机推荐

  • 常用数学公式汇总

    常用数学公式汇总 一 基础代数公式 1 平方差公式 xff1a xff08 a xff0b b xff09 xff08 a xff0d b xff09 xff1d a2 xff0d b2 2 完全平方公式 xff1a xff08 a b x
  • Kubernetes--API Server资源隔离

    Kubernetes的一些功能特性也与公有云提供商密切相关 xff0c 例如 xff1a 负载均衡服务 弹性公网IP 存储服务等 xff0c 具体实现也需要与API Server通信 xff0c 也属于运行商内部重点保障的安全区域 此外 x
  • 公式提取方法

    Mathpix Snipping Tool和MathType配合用法 Mathpix Snipping Tool是一个可以提取数学公式的工具 xff0c 当我们写毕业论文或者结课报告或者参加数学建模等比赛的用到的公式 xff0c 可以用这款
  • (学习unix编程)关于文件流与文件描述符的区别

    文件描述符 xff08 就是整数 xff09 用于在一个进程内唯一的标识打开的文件 这假定了内核能够在用户进程的描述符和内核内部使用的机构之间 xff0c 建立一种关联 xff08 深入linux内核架构 xff09 由于唯一标识进程的结构
  • 2000页kubernetes操作手册,内容详细代码清晰,小白也能看懂

    现如今 xff0c Kubernetes业务已成长为新时代的IT基础设施 xff0c 并成为高级运维工程师 架构师 后端开发工程师的必修技术栈 毫无疑问 xff0c Kubernetes是云计算发展演进的一次彻底革命性的突破 xff0c 只
  • Linux安装nodejs和npm

    最近window系统转向linux系统开发 xff0c linux系统的确适合程序员的开发 作为前端安装了nodejs和npm xff0c 遇到了一些坑 xff0c 赶紧记录下来 第一种安装方法 xff1a 安装nodejs xff1a s
  • 查看core dumped的详细错误原因

    什么是Core Dump Core的意思是内存 Dump的意思是扔出来 堆出来 开发和使用Unix程序时 有时程序莫名其妙的down了 却没有任何的提示 有时候会提示core dumped 这时候可以查看一下有没有形如core 进程号的文件
  • IntelliJ IDEA创建Servlet最新方法 Idea版本2020.2.2以及IntelliJ IDEA创建Servlet 404问题(超详细)

    第一次用IntelliJ IDEA写java代码 xff0c 之前都是用eclipse xff0c 但eclipse太老了 下面为兄弟们奉上IntelliJ IDEA创建Servlet方法 xff0c 写这个的目的也是因为在网上找了很多资料
  • Linux下做C语言/C++开发的一些建议

    相对于Linux下的C C 43 43 开发 xff0c 在windows下的初学者往往容易入门 xff0c 原因是visual studio 这个强大的工具隐藏了很多的细节 xff0c 好多人甚至以为拖拖控件 xff0c 写写消息响应函数
  • Target ‘STM32F4xx‘ uses ARM-Compiler ‘Default Compiler Version 5‘ which is not available.找不到v5版本解决方法

    现在官网上没有v5的版本了 xff0c keil默认安装的是v6的版本 xff0c 如果工程想要运行以前的工程 xff0c 可以设置将工程的编辑器从v5转到v6 xff0c 下面是方法 xff1a 1 使用MDK打开工程 2 选择 Proj
  • 关于imu的介绍

    1 imu时惯性运动丹云 xff0c 包含加速度计和陀螺传感器的组合 它被用来检查加速度和角速度 xff08 IMU传感器 xff0c 你所需要知道的全部 知乎 xff09 虽然时外文翻译的 xff0c 凡是整体风格清晰 2 imu的使用
  • LSTM与GRU

    LSTM 与 GRU 一 综述 LSTM 与 GRU是RNN的变种 xff0c 由于RNN存在梯度消失或梯度爆炸的问题 xff0c 所以RNN很难将信息从较早的时间步传送到后面的时间步 LSTM和GRU引入门 xff08 gate xff0
  • Pytorch 实战RNN

    一 简单实例 span class token comment coding utf8 span span class token keyword import span torch span class token keyword as
  • Pytorch : Dataset和DataLoader

    一 综述 Dataset 对数据进行抽象 xff0c 将数据包装为Dataset类 DataLoader 在 Dataset之上对数据进行进一步处理 xff0c 包括进行乱序处理 xff0c 获取一个batch size的数据等 二 Dat
  • 特征工程

    一 数据读取 1 1 读取CSV文件 1 1 1 原文件内容 1 1 2 读取csv span class token keyword import span csv csv file span class token operator 6
  • 续集来了!我让 GPT-4 用 Laf 三分钟写了个完整的待办事项 App

    书接前文 xff0c 上篇文章我们教大家如何三分钟时间用 Laf 实现一个自己的 ChatGPT 一觉醒来 xff0c GPT 4 已经发布了 xff01 GPT 4 实现了真正的多模态 xff0c 可以把纸笔画的原型直接写出网页代码 读论
  • 代码命名规范

    代码命名规范 现在是2016年12月30日中午12点35分 xff0c 这是我第一次写博客 xff0c 用的是markdown编辑器 xff0c 还不太会用 今天就先简单的写一下 xff0c 看看写出来的效果是什么样的 xff01 xff0
  • 盘点2016

    年年有计划 xff0c 岁岁有复盘 xff0c 今天是2016年的最后一天 我也来回忆一下我的2016年 xff0c 展望一下2017年 记得去年的跨年是和几个朋友在一块儿的过的 xff0c 记得当时玩儿了麻将 xff0c 我输了 xff0
  • easyui combobox动态绑定数据

    1 jsp上的写法 lt input span class hljs keyword class span 61 span class hljs string 34 easyui combobox 34 span id 61 span cl
  • Echarts(二、柱状图(各参数详细描述))

    1 jsp页面 span class hljs tag lt span class hljs title body span gt span span class hljs tag lt span class hljs title div